
It was expected that the downside for price was limited. A very slight new low for the session perfectly fits this expectation.
Summary: On Balance Volume and the AD line remain very bullish, supporting the main Elliott wave count. The next target is now at 2,526 to 2,529. It may be met in another 4 sessions.
Stay nimble and keep stops tight. This trend is extreme and over stretched. There is reasonable downside risk.
Always trade with stops and invest only 1-5% of equity on any one trade.
Last monthly and weekly charts are here. Last historic analysis video is here.
Due to strong support for a bullish wave count from On Balance Volume and the AD line, the wave counts are now labeled “main” and “alternate” and have been swapped over.
MAIN ELLIOTT WAVE COUNT
WEEKLY CHART
Click chart to enlarge.
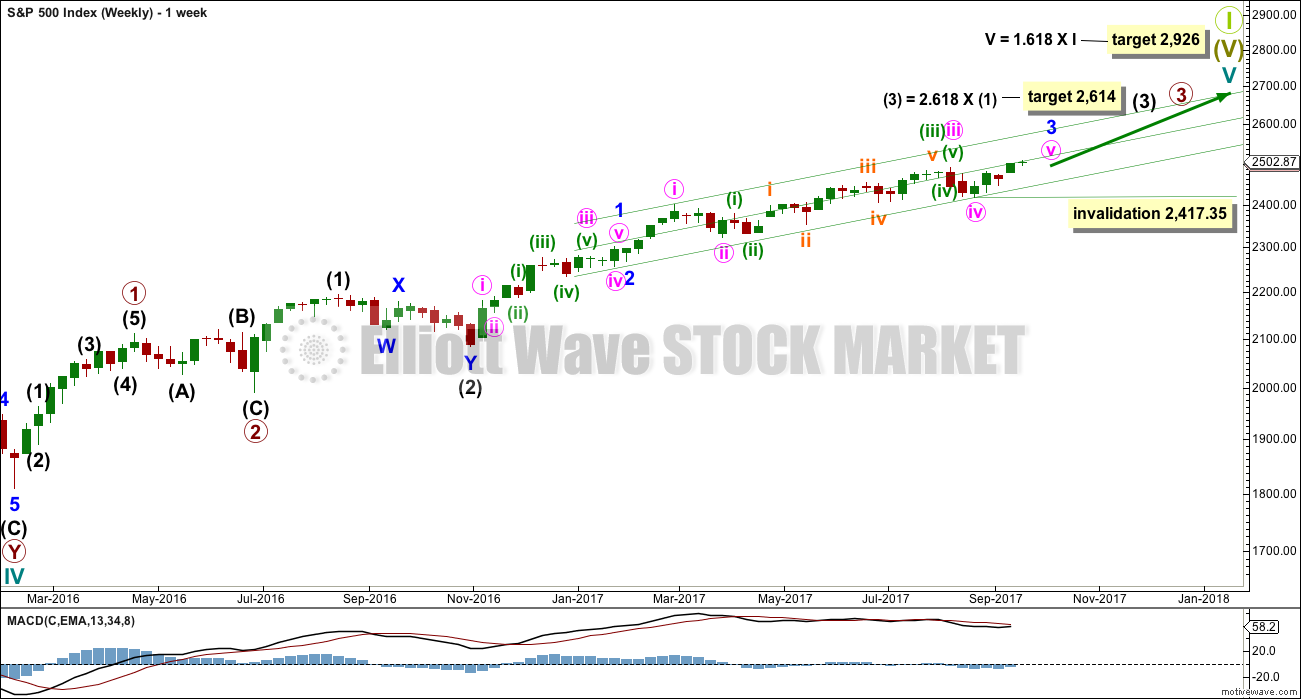
This wave count has strong support from a clear and strong bullish signal from On Balance Volume. While classic analysis is still very bullish for the short term, there will be corrections along the way up. Indicators are extreme and there is considerable risk to the downside still.
If primary wave 3 isn’t over, then how would the subdivisions fit? Would it fit with MACD? What would be the invalidation point and would the Fibonacci ratios be adequate?
Of several ideas I have tried, this one has the best fit in terms of subdivisions and meets all Elliott wave rules.
Despite this wave count appearing forced and manufactured, and despite persistent weakness in volume and momentum for this third wave, On Balance Volume does now strongly favour it. It may be that as a Grand Super Cycle wave comes to an end, that weakness may develop and persist for very long periods of time (up to three years is warned as possible by Lowry’s for the end of a bull market), so this weakness may be viewed in that larger context.
Within minute wave v, no second wave correction may move beyond the start of its first wave below 2,417.35.
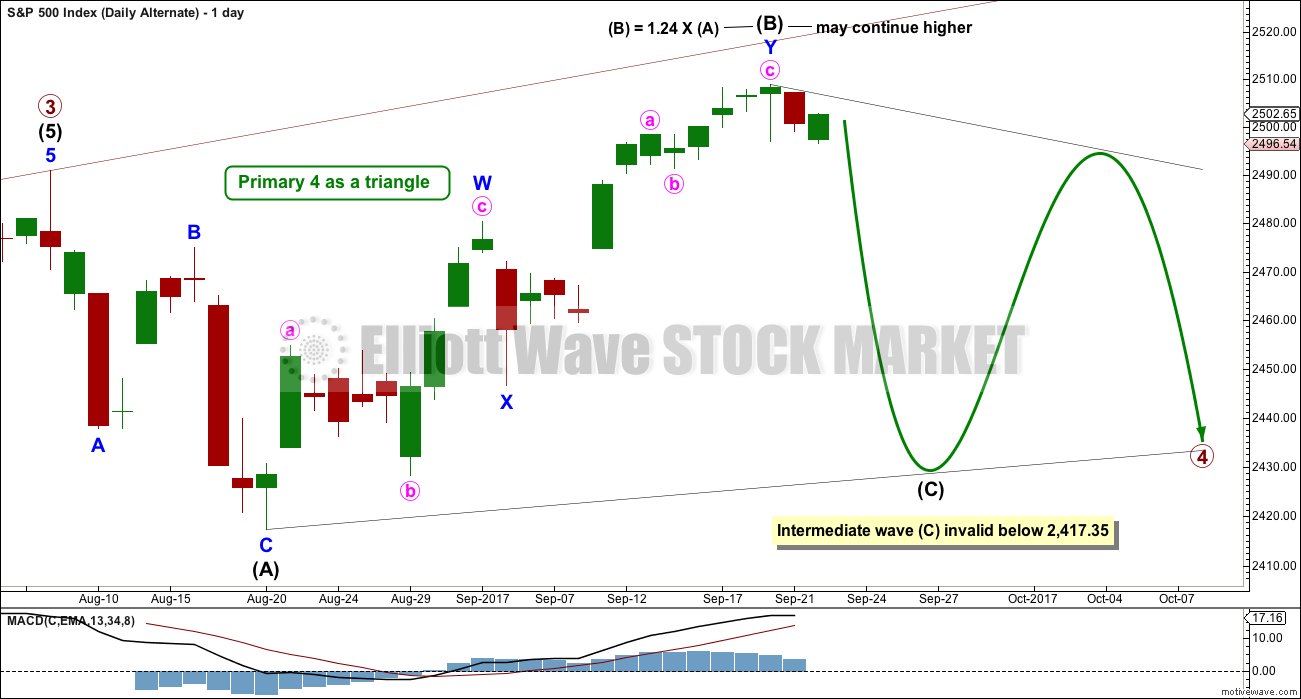
The next reasonable correction should be for intermediate wave (4). When it arrives, it should last over two months in duration, and it may find support about the lower edge of this best fit channel. The correction may be relatively shallow, a choppy overlapping consolidation, at the weekly chart level.
DAILY CHART
Click chart to enlarge.
To see details of the whole of primary wave 3 so far and compare and contrast with the alternate wave count, see the analysis here.
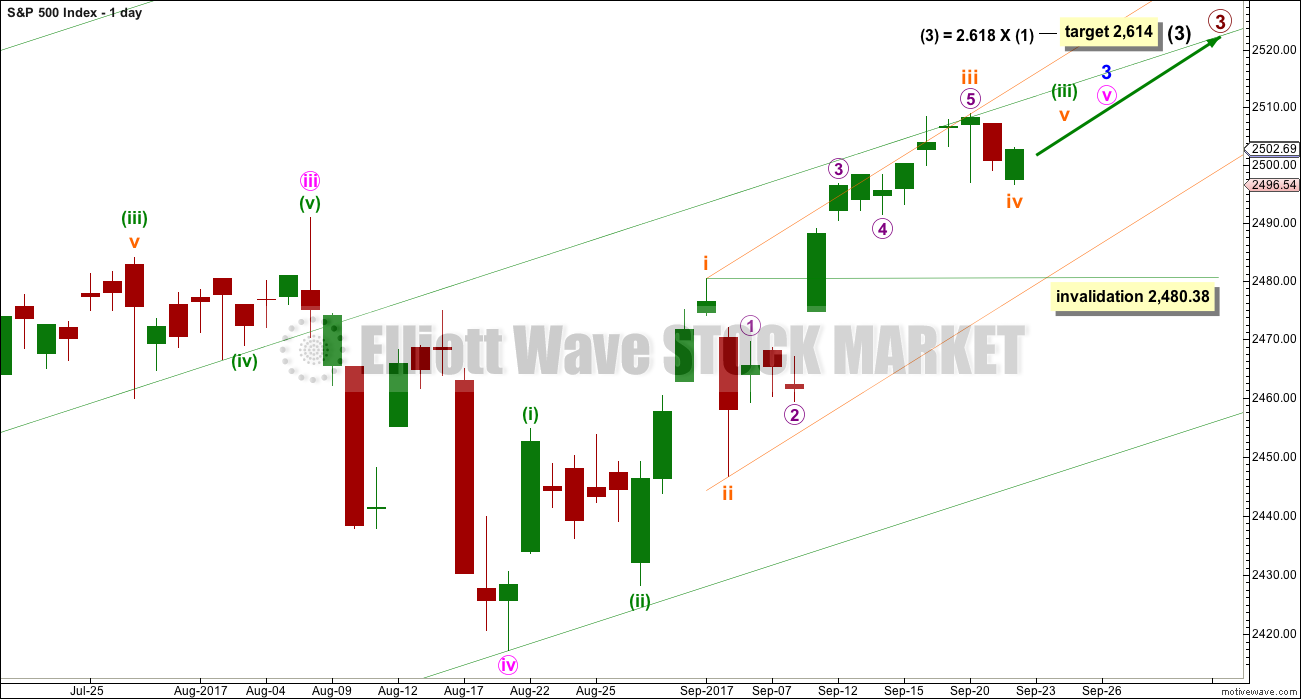
Minute wave v to complete minor wave 3 must subdivide as a five wave structure. It looks like an incomplete impulse. Within the impulse, subminuette wave iv may not move into subminuette wave i price territory below 2,480.38.
Subminuette wave iv now looks to be complete at the daily and hourly chart levels. At the daily chart level, the structure and proportions within minuette wave (iii) so far look very good. This part of the wave count has the right look.
So far minuette wave (iii) has lasted 17 sessions. If it exhibits a Fibonacci duration, then the next number in the sequence is 21; this duration would see it end in another 4 sessions.
HOURLY CHART
Click chart to enlarge.
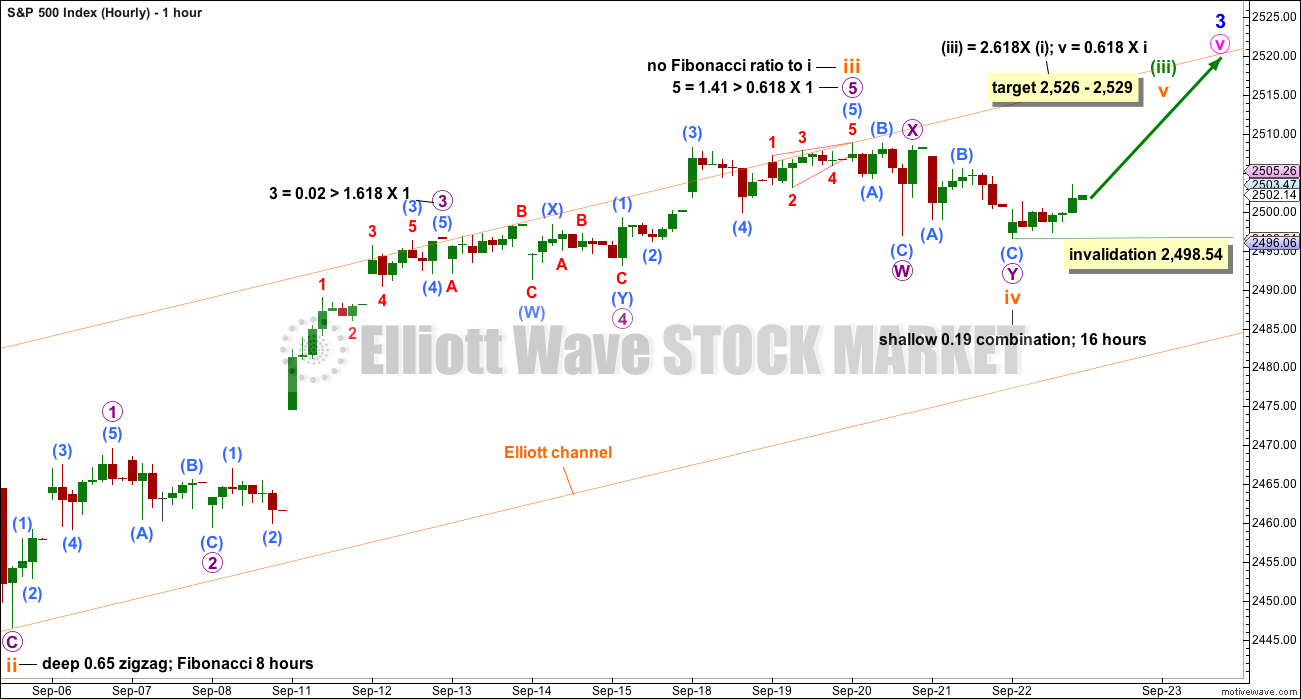
At the hourly chart level, this wave count now still has a better look over the alternate wave count. Subminuette wave iii looks so far like a typical unfolding impulse and its second and fourth wave corrections for micro waves 2 and 4 both look to be in proportion.
Subminuette wave iv now fits perfectly as a shallow double combination: flat – X – zigzag. This provides perfect alternation with the deeper zigzag of subminuette wave ii.
Subminuette wave v may end about the upper edge of the orange Elliott channel.
If subminuette wave iv is correctly labelled as complete, then within subminuette wave v no second wave correction may move beyond its start below 2,498.54.
ALTERNATE WAVE COUNT
WEEKLY CHART
Click chart to enlarge.
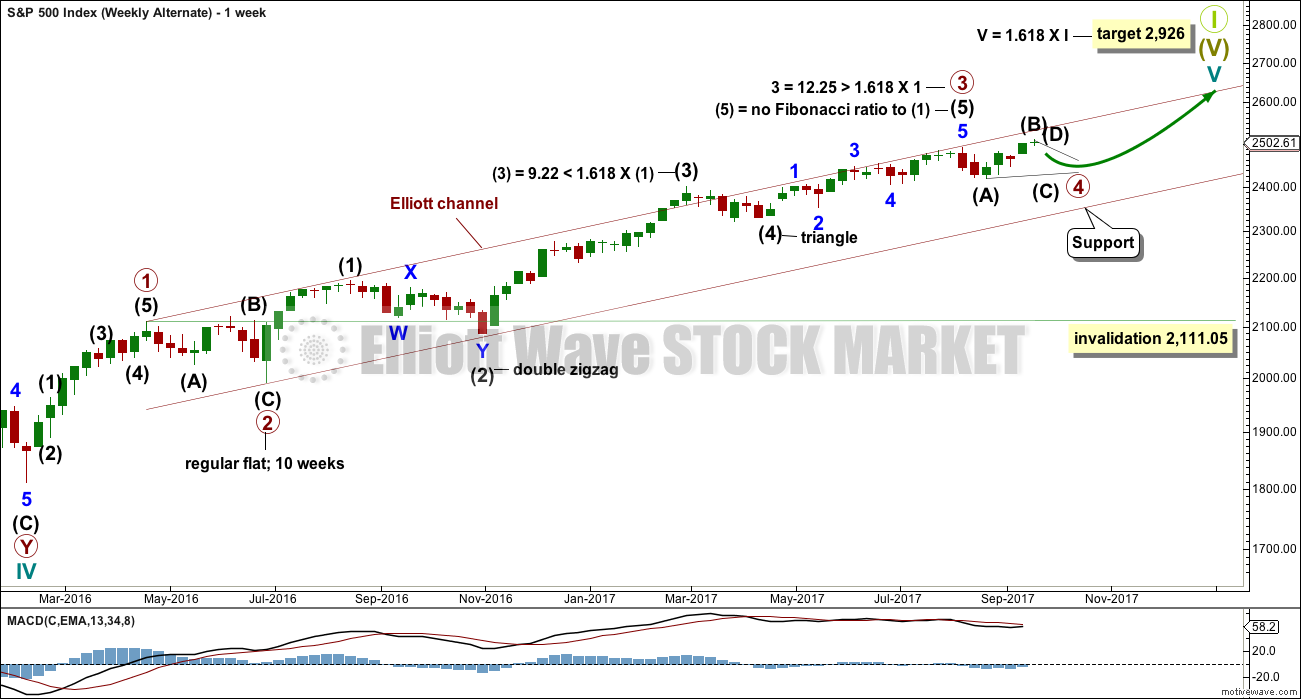
Primary wave 3 may be complete. Confidence may be had if price makes a new low below 2,480.38 now. That would invalidate the main wave count at the daily chart level. Fibonacci ratios are calculated at primary and intermediate degree. If primary wave 3 is complete, then it still exhibits the most common Fibonacci ratio to primary wave 1.
Primary wave 4 may not move into primary wave 1 price territory below 2,111.05.
Primary wave 4 should last about 8 weeks minimum for it to have reasonable proportion with primary wave 2. It is the proportion between corrective waves which give a wave count the right look. Primary wave 4 may last 13 or even 21 weeks if it is a triangle or combination. So far it may have completed its fifth week.
If primary wave 4 unfolds as a single or double zigzag, then it may find support about the lower edge of the maroon Elliott channel. If it is a triangle or combination, it may be more shallow, ending about mid way within the channel. At this stage, a single zigzag has been invalidated and a double zigzag is discarded based upon a very low probability. It looks like primary wave 4 is to be a very shallow sideways consolidation rather than a deeper pullback.
Only two daily charts are now published for primary wave 4: a triangle and a combination. It is impossible still for me to tell you with any confidence which of these two structures it may be. The labelling within each idea may still change as the structure unfolds.
The daily charts are presented below in order of probability based upon my judgement.
The final target for Grand Super Cycle wave I to end is at 2,926 where cycle wave V would reach 1.618 the length of cycle wave I.
DAILY CHART – TRIANGLE
Click chart to enlarge.
This first daily chart will illustrate how price might move if primary wave 4 unfolds as a triangle.
Intermediate wave (B) may be a double zigzag. One of the five sub-waves of a triangle should be a more complicated multiple; most commonly that is wave C, but it may be any sub-wave. Intermediate wave (B) has made a new all time high, so it may be a running triangle.
The triangle may last a total of a Fibonacci 13 or 21 weeks.
Both intermediate waves (A) and (B) look like three wave structures.
Intermediate wave (C) may not move beyond the end of intermediate wave (A).
HOURLY CHART
Click chart to enlarge.
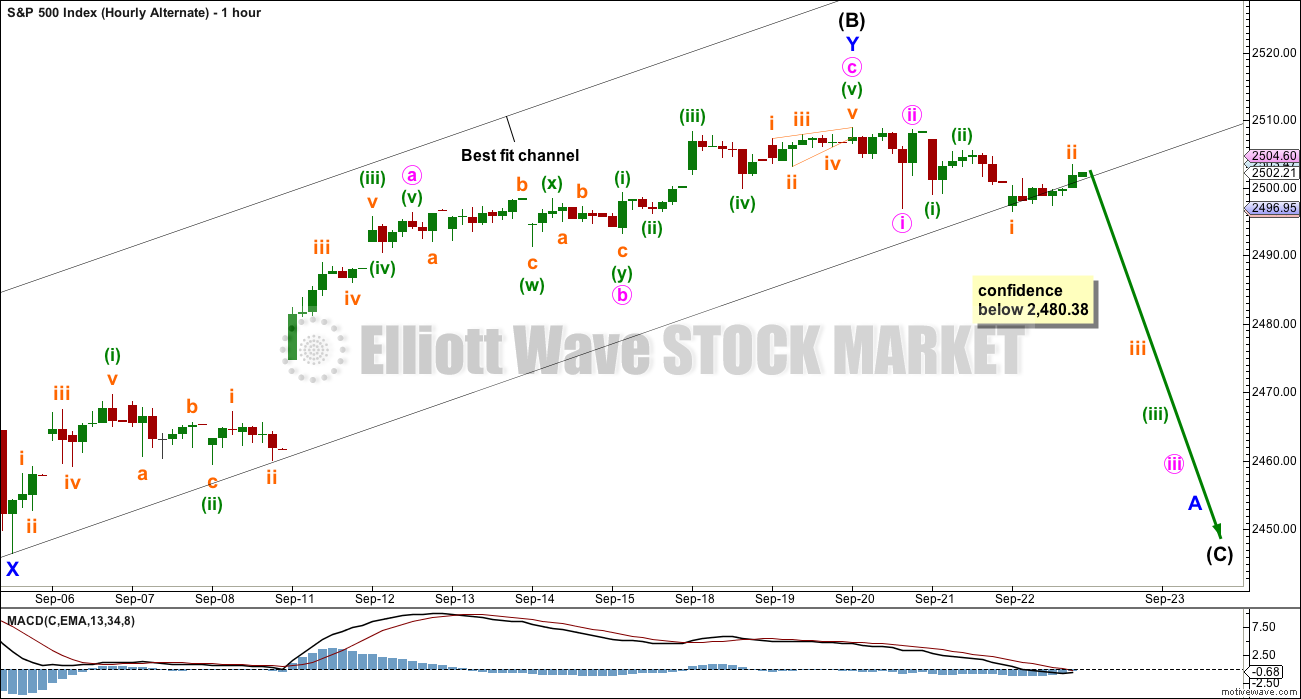
A double zigzag may be again complete for intermediate wave (B).
Use the black best fit channel. If price breaks below the lower edge, then expect the upwards swing is over and the next swing down has begun. While price remains within this channel, then it is entirely possible price may continue higher; minute wave c may not be complete. For much of Friday’s session price has found support about the lower edge of this channel.
There is still zero evidence of a trend change. A new low below 2,480.38 is required for any confidence that a high is in place.
We should assume that the trend remains up while price remains within the black channel and above 2,480.38.
DAILY CHART – COMBINATION
Click chart to enlarge.
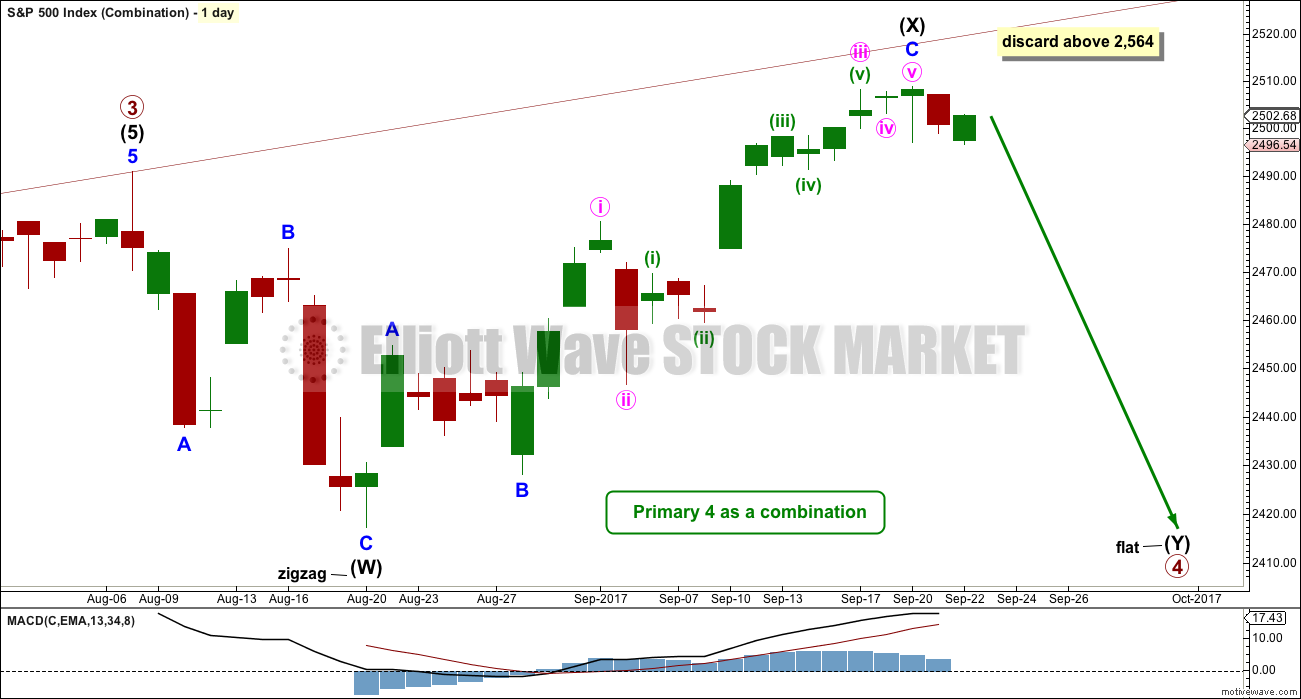
A combination for primary wave 4 would still offer some alternation with the regular flat of primary wave 2. Whenever a triangle is considered, always consider a combination alongside it. Very often what looks like a triangle may be unfolding or may even look complete, only for the correction to morph into a combination.
There may only be one zigzag within W, Y and Z of a combination (otherwise the structure is a double or triple zigzag, which is very different and is now discarded). At this stage, that would be intermediate wave (W), which is complete.
Combinations are big sideways movements. To achieve a sideways look their X waves are usually deep (and often also time consuming) and the Y wave ends close to the same level as wave W.
This wave count sees upwards movement continuing as intermediate wave (X). Unfortunately, there is no Elliott wave rule regarding the length of X waves, so they may make new price extremes. I am applying the convention within Elliott wave regarding B waves within flats here to this X wave within a combination: When it reaches more than twice the length of intermediate wave (W), then the idea of a combination continuing should be discarded based upon a very low probability.
With intermediate wave (W) a zigzag, intermediate wave (Y) would most likely be a flat correction but may also be a triangle. Because a triangle for intermediate wave (Y) would essentially be the same wave count as the triangle for the whole of primary wave 4, only a flat correction will be considered.
But first, an indication would be needed that the upwards wave of intermediate wave (X) is over. As yet there is no evidence of this.
TECHNICAL ANALYSIS
WEEKLY CHART
Click chart to enlarge. Chart courtesy of StockCharts.com.
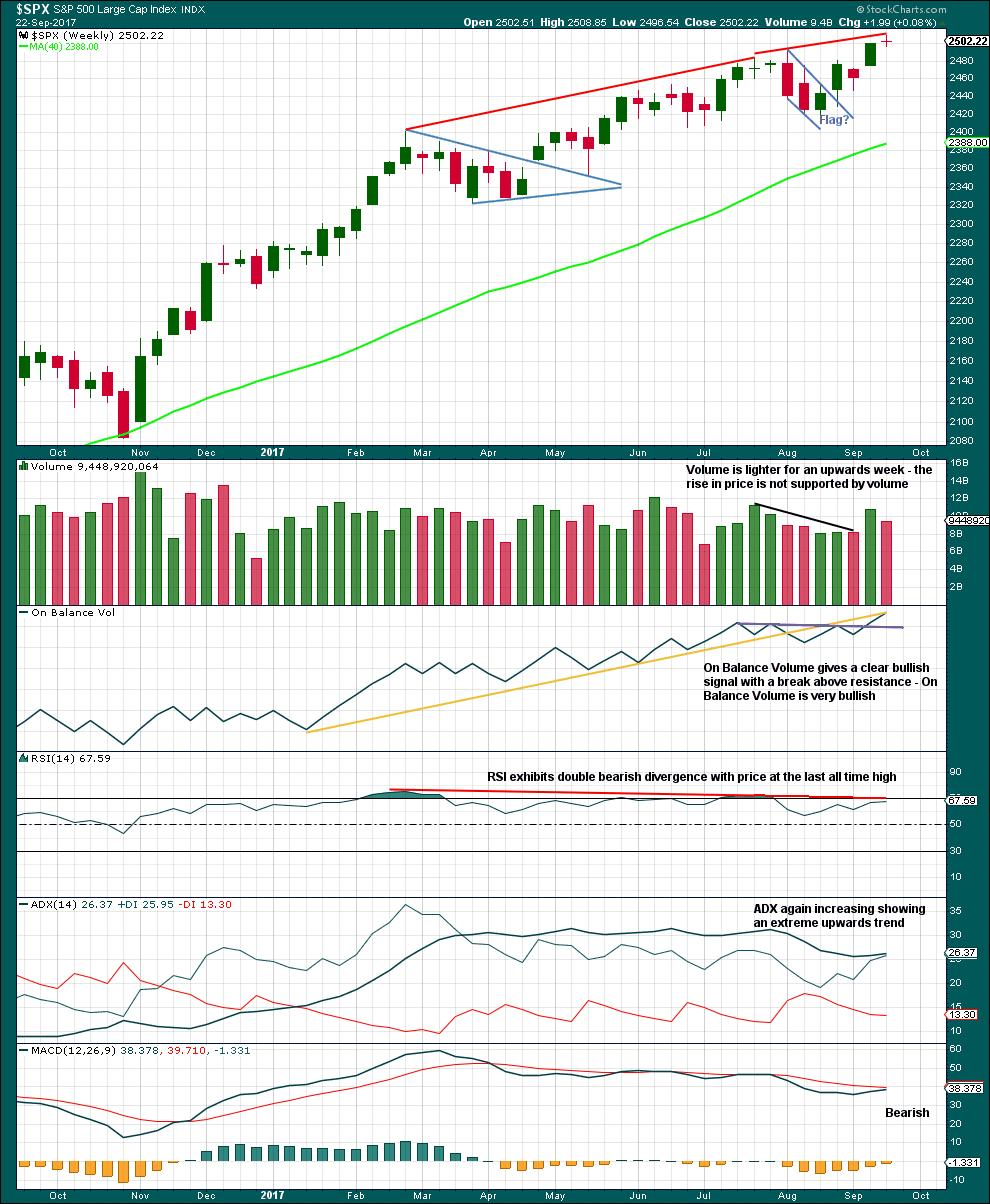
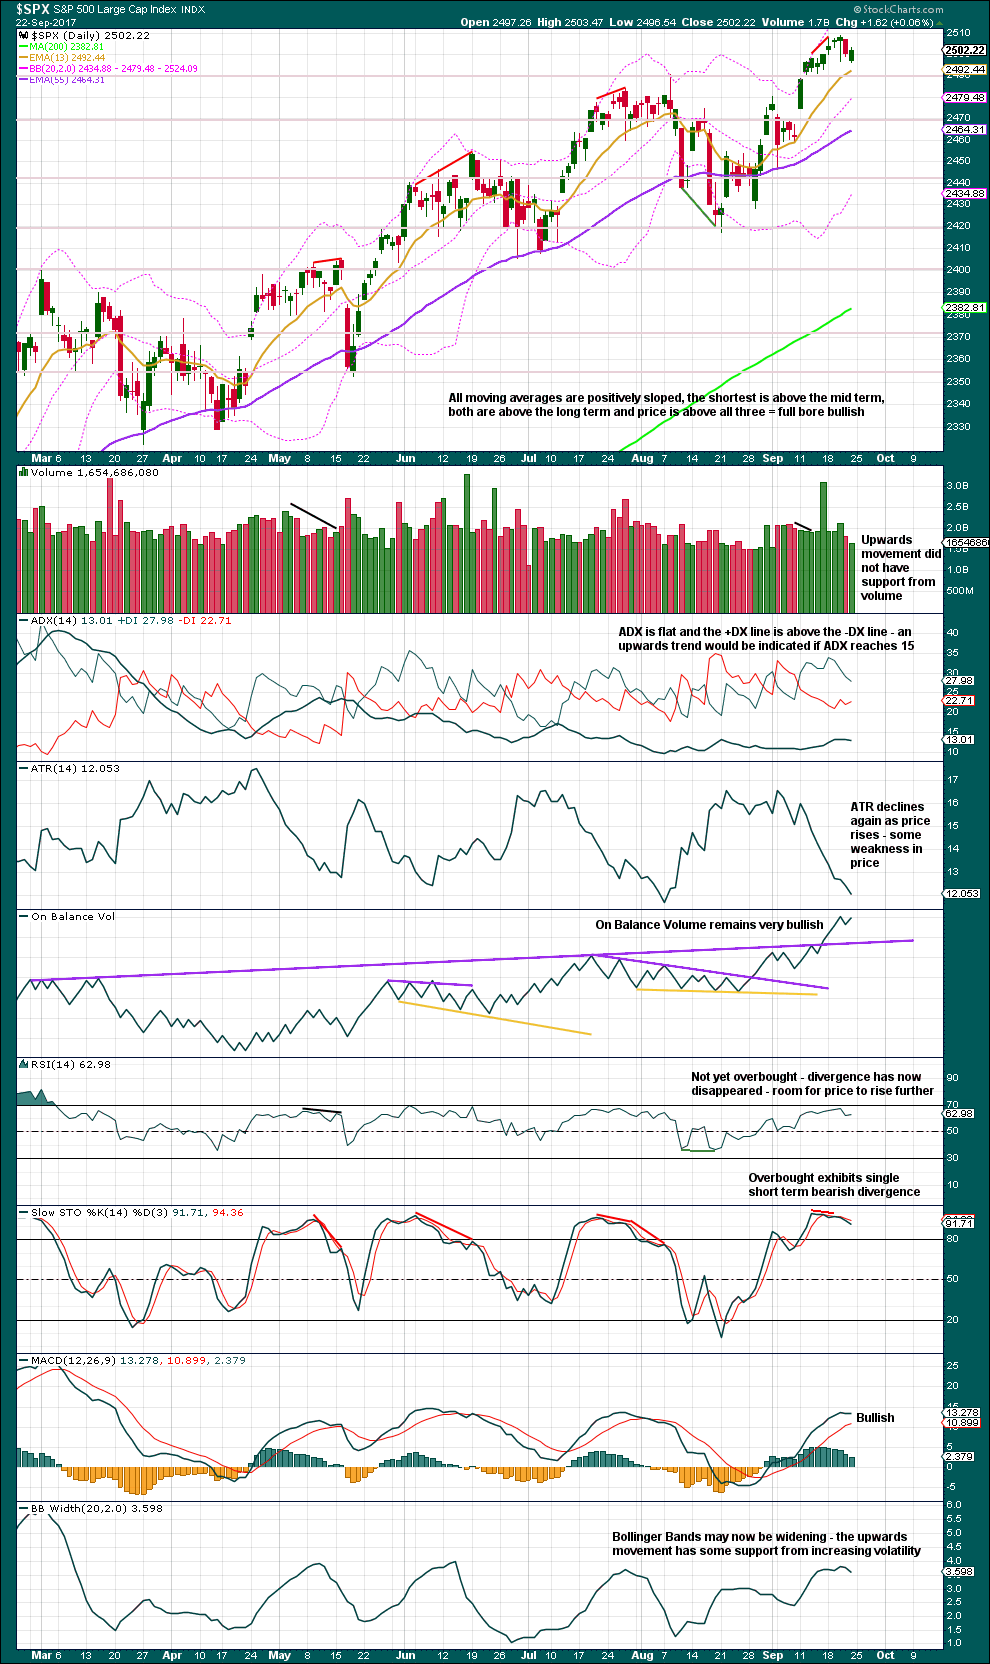
A strong weekly candlestick gaps higher and has support from volume. This looks like a classic upwards breakout after a small consolidation, and there may have been a small flag pattern in it. This supports the main Elliott wave count.
If the flag pole is taken from 2,405.70 to 2,490.87, then a target for the next wave up may be about 2,527.
The bullish signal from On Balance Volume is clear. It should be given reasonable weight. This supports the main Elliott wave count.
ADX is still just extreme. If the black ADX line crosses above the +DX line, then the upwards trend would no longer be considered extreme. RSI still exhibits double bearish divergence. This trend is extreme; beware that the alternate wave count may still be correct.
DAILY CHART
Click chart to enlarge. Chart courtesy of StockCharts.com.
The Hanging Man pattern now has bearish confirmation. It may be a reversal signal. This favours the second wave count.
For Friday’s session, although price moved lower, the balance of volume was upwards. Upwards movement during Friday’s session did not have support from volume. This may be read as bearish for the short term.
Still expect strong support about 2,500.
Stochastics may remain extreme for a fairly long period of time during a bull trend. There is still room for price to rise further.
VOLATILITY – INVERTED VIX CHART
Click chart to enlarge. Chart courtesy of StockCharts.com.
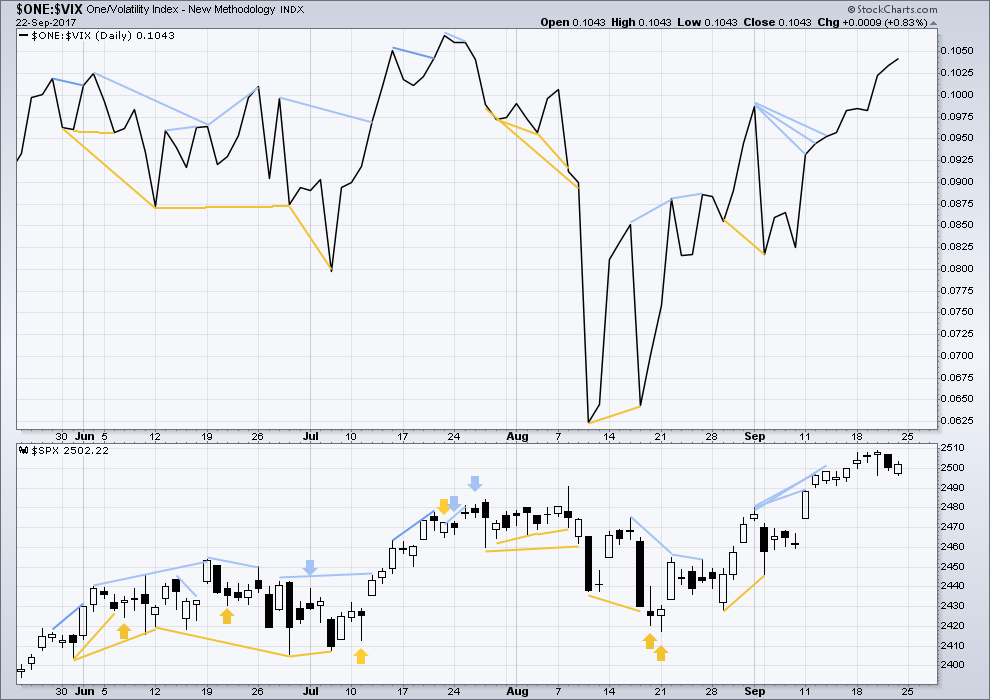
Normally, volatility should decline as price moves higher and increase as price moves lower. This means that normally inverted VIX should move in the same direction as price.
There is still mid and longer term bearish divergence, but it has been noted in the past that divergence over a longer term does not seem to work as well for VIX. Short term bearish divergence has disappeared.
There is no new short term divergence at the end of this week between price and inverted VIX. While price moved lower on Friday, the balance of volume during the session was upwards. This upwards movement during the session came with a corresponding decline in market volatility. This is bullish.
BREADTH – AD LINE
Click chart to enlarge. Chart courtesy of StockCharts.com.
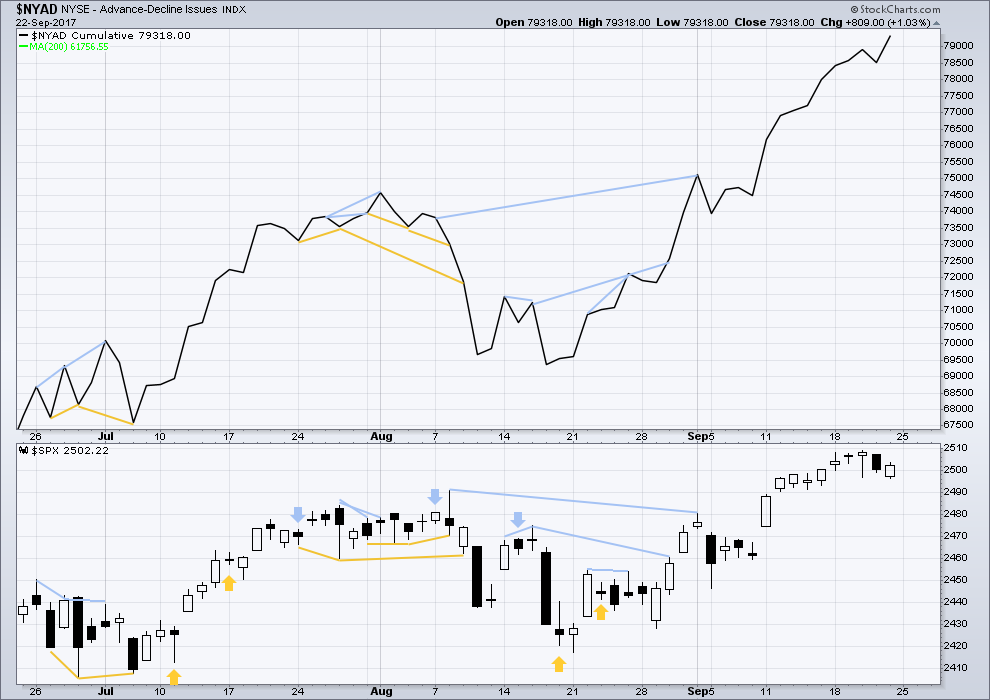
With the last all time high for price, the AD line also made a new all time high. Up to the last high for price there was support from rising market breadth.
There is normally 4-6 months divergence between price and market breadth prior to a full fledged bear market. This has been so for all major bear markets within the last 90 odd years. With no divergence yet at this point, any decline in price should be expected to be a pullback within an ongoing bull market and not necessarily the start of a bear market.
The AD line is often a leading indicator, in the same way that On Balance Volume may be. The new all time high for market breadth during Friday’s session is interpreted as bullish. This supports the main Elliott wave count.
DOW THEORY
The S&P’s new all time high last week is confirmed by DJIA and Nasdaq also making new all time highs. However, DJT has not yet made a new all time high, so the continuation of the bull market at this stage lacks confirmation.
The following lows need to be exceeded for Dow Theory to confirm the end of the bull market and a change to a bear market:
DJIA: 17,883.56.
DJT: 7,029.41.
S&P500: 2,083.79.
Nasdaq: 5,034.41.
Charts showing each prior major swing low used for Dow Theory are here.
Published @ 02:15 a.m. EST on 23rd September, 2017.
Hi Lara,
I guess your 2498 invalidation point is a hangover from this mornings chart?
Oops! Yes. Sorry everybody. It should read
2,480.38.
Thanks Nick
Updated main hourly chart:
Subminuette iv not over? The invalidation point was pulled up too quickly.
A double zigzag may end about 0.382 Fibonacci ratio, finding support at the lower edge of the Elliott channel. Look out for very strong support there.
This would still have some alternation with the deep single zigzag of submineutte ii. The proportions are still reasonable, for the S&P. On the daily chart it still looks okay.
Lara,
On the hourly chart, the current low is just beyond 1.618 of circle-W, if I’ve measured correctly. If circle-Y continues down to 2485, is that still a good proportion?
Yes, because subminuette iv would still be shallow, close to 0.382 X subminuette iii.
It’s the duration between subminuette ii and iv which is going to give the wave count good proportion.
Submineutte wave iv is now quite a bit longer in duration than submineutte ii. Some difference is acceptable and somewhat common (particularly for this market). And at higher time frames, daily, it still looks okay.
VIX broke above falling wedge today so should head back to tap top boundary tomorrow before spiking higher….
Immediate focus on 2490 and low volume suggests not much of a battle underway. Market sinking on internal torpidity. This argues for a successful closing ramp, but not one that will necessarily be sustained….
I think we are gong to see some cards before the close. Either we get a manic run back toward 2500 into the close, or the bears opine “Oh no, you don’t!” and fill that 2488.11 closing gap from September 11.
well Verne, it appears we might get both
Indeed! We get to have our cake and eat it too! 🙂
Penetration of gap from September 11 forcefully rejected. A move back and close below 2488.95 could spell trouble for the bulls….
Cashing in half long vol trades for another nice 30% pop. Will reload at any bounce at today’s gap or wait if it is filled….
Current move too out of proportion to be a fourth wave. Other possibility is an initial impulse down completed and a second wave bounce under way. If so, a juicy third should be on deck and 2470 will fall. If not, a slow boring bankster crawl back to 2500…Zzzzzzzzz! 🙂
Either a fourth wave next to complete some kind of corrective C wave and back above 2500 today, or a second wave correction and serious droopage to follow with 2470 demolition…which, Oh which will it be?! 🙂
Again, 2470 needs to fall or the bears merely being baited… 🙂
I have a different take… Bulls will be baited all this week!
THEN:
Extreme Valuations of each individual Stock in the S&P500 and DJIA & other indexes by any proven Long-term valuation method will NOT react well to that Sucking Sound of Liquidity being removed from markets by the…
October 1st start of Fed Balance Sheet reductions via Maturities of US Treasuries, Agencies and Natural MBS principle reductions each month.
By… $10 Billion/mo increasing $10 Billion/Qtr to Max per month of $50 Billion.
All this Buying Power goes away beginning October 1st… not to mention that Stock Buybacks by Co’s will drop dramatically as new real long-term investment into business operations from companies of all sizes will begin in earnest. This investment will NOT turn into material revenue or profits for at least 3+ Years after said investment begins. The Paper economy dies for a few years and the Real economy (Production of Goods & infrastructure) will materialize all across the USA. Unfortunately, for paper assets… there will be an adjustment period of 3+ years IMO.
Whoooooshhhh!!!!!! 🙂
Any confidence in a near term bearish count absolutely requires the bears to decisively rescind the 2470 pivot capture. Any continuing meandering today back towards 2500 and I will be going fully long short term. Price will start to look too much like consolidation ahead of a strong move higher…we will see…. 🙂
For anyone who likes equities in long term uptrends that are in a nice pullback to lower B and K bands…check ANET, and UL. I bought in to ANET on a limit. “It should be as easy as going to the corner and picking up the bag of money”. I sure hope so!!
SPX pull back bounced and stalled at the 23.4% fibo (and a decent uptrend line, see chart). If those go, next stop 2475 the 38.2%, where there is symmetric support as well. Below that, several symmetry projections around the 61.8% at 2452. But it may very well just hold here and continue the stair step up process, after this touch and drop off the 1.27% extension upward. “Assume the trend will continue…”
I watched a free John Carter video on his latest indicator (ADX/DI based color coding of trend up, neutral, or down, along with volume spike “commitment” dots). He wants a couple hundred $ for it, yet he described it in some detail so…I found some vaguely similar free code online, wacked on it a bit and got what what I think is the same thing, for Thinkorswim. If anyone wants a copy, happy to share, zinc1024 at the gmail place. If anyone knows a free indicator/code for Darvas box generation (it’s easy visually, it’s hard computationally), a pointer would be welcome! Thx.
mega fight going on here – looks like bulls might have just won?
I am waiting to award the checkered flag until I see whether the bears can take out 2470. A close back above 2500 today and the bears are toast short term to say the least….
The SPX daily has shown a neutral trend based on ADX < 20 since mid-June. Price has just come off a 21 period bollinger upper band and is just breaking through a 21 period keltner channel. The hourly trend shifted to down since late Wednesday. The 5 minute trend is up and quite extended. Appears to be setting up for a downswing. When comparing the main and alternates at the hourly level, I know that both have very close by invalidation points, which signals to me that I got a high leverage entry signal close by, either way. Let's see…if 2503.47 gets exceeded on the upside, hourly #2 gets severely compromised, and if 2498.54 is broken to the downside, the hourly #1 is invalidated. So yup, 2500 is a heck of a pivot!
Protracted battles around these pivots is generally a bad sign for the bears as they seem to always eventually loose them. The move back above 2470 was very bullish. The next serious decline will take it out with probably only a brief intra day back test.
Fascinating that ES stalled just below 2500 as that is the currently contested pivot. A deeper correction would be indicated with a fall away from it and confirmed with a move below 2470…
“They don’t mark to market or have profits like a company…
They hold to maturity or as in their MBS portfolio it naturally runs off.
There is no reporting pressure to sell. If you hold to maturity there are no realized losses!”
I have been enjoying the spirited discussion with Joseph regarding the FED’s balance sheet. While we both agree that the larger economy is in trouble, we have a different view of the magnitude of the FED’s exposure to downside risk and the above quote from Joe gives the reasons for why he thinks it is limited. I agree with his statements with regard to marking to market and holding instruments to maturity.
There is however one great big caveat and it is this. Much of the FED’s portfolio is comprised of so called MBS – Mortgage backed securities. The underlying asset against which the securities have been issued is real estate. As is the case with any bond that you are holding, it is pointless to hold it to maturity if the bond issuer defaults!
Recent bubbles have moved from housing and real estate, to student loans, to auto loans, and now the grand daddy of all bubbles – government debt.
In a deflationary depression, prices of all assets fall, including and especially real estate. To argue that the FED can safely hold all, or even most of its MBS securities is to argue that there is no danger of default on these instruments; I would not bet on it!
Even though they do not have to mark to market, the FED are not stupid. If there is a plunge in the value of these securities, marked to market or not, what do you think the FED is going to do? Remember they too are in business to make money, not loose it.
They are going to try to SELL…!
You can see where I am going with this I am sure…. 🙂
Yes. I see what you’re doing there….
I too am very much enjoying the exchange. I’m learning a lot. Thanks guys!
Most welcome!
The implications for which side of this argument is correct is incredibly huge. If I am right, it gives us a very clear road map for where we are headed monetarily for the next decade or more. The FED, rather than let bad debts default during the last financial crisis, chose to reward the malfeasance of banking institutions by bailing them out. When all the accumulated debt on everyone’s balance sheet, not just the FED (we know corporations are now loaded to the gills!) begins to implode, there will be on one left do any bailing out. We know exactly how the FED is going to react to the prospect of their own insolvency when deflation takes hold – they are going to PRINT like there is no tomorrow. So while the next major event is a deflationary cycle, it will almost certainly be followed by hyper-inflation unlike anything the world has ever seen. That scenario calls for a completely different preparatory strategy than if it were not the case, so these discussions are not merely academic. They have profound implications for how we manage our own financial affairs, based on our perspective, going forward.
The hyperinflation will not be unlike what Venezuela is experiencing now, or Zimbabwe, or Germany post World War I. That is the real event to be fearful of; much more so than a market crash/correction, and it is a mathematical and historical certainty at this point.
What you are going to have is Deflation… Not inflation let alone hyper inflation.
The deflationary cycle is coming to its end; culminating with a market collapse, but hyper-inflation will follow. Also Joe, the Fed is ridiculous/arrogant/sinister and very dumb. See 1929, 70s inflation, 1987, savings and loan crisis, Asian currency crisis, LTCM, 2000 dot com crash, housing bubble and financial crisis. Their models are outdated mundane and chronically wrong about GDP, Unemployment, and inflation. Not once have they been right this cycle. The only thing the have done correctly is backstop speculation and created scarcity in financial assets, which will end when the faith in them is lost.
I am not defending the Fed… I am only pushing back on anyone that say’s reducing the balance sheet will have no effect on markets. It most certainly will have the effect of draining liquidity.
Also pushing back on those that say the Fed will deviate from their plan of reducing that balance sheet.
They will not deviate.
The size of the dollar denominated debt that will implode dwarfs anything seen previously. It is entirely possible that the enormity of what we are facing will also surpass the examples you cited…hard to imagine is it not?
Thank You Verne… This is why the Balance Sheet Run Off will Start October 1st and Run without interruption no mater what happens to and in the stock market!
The Fed also is not stupid… the have only purchased the highest quality of the MBS Securities tranches. Plus the vast batch of underlying mortgages have been strictly underwritten in the last 7 years. So even if things get bad in the residential market… only a small percentage will enter default. That is an acceptable risk.
Also, currently there are zero signs of any material risk in the US Residential Housing Market.
Everything else they buy are US Government backed… so zero risk of default there.
Liquidity begins to drain out of markets October 1st!
The Balance Sheet will shrink naturally over the next 4 years to approximately 1/2 of what it is today without having to make a single sale transaction!
And Verne… They are not Holding anything.
The size will run down naturally as maturities occur and as MBS are paid each month.
By… $10 Billion/mo increasing $10 Billion/Qtr to Max per month of $50 Billion.
I agree Joe, it will absolutely have an effect, and I also do not believe they will stop.
The reason I find the balance sheet reduction promise laughable is that it somehow implies a cessastion of “support” for equities. Someone has suggested the possibility of a market collapse being used as a political weapon and I guess anything is possible…
Since Verne found the data that is up to date, here are the maturities of the Treasury securities in their Balance Sheet… The run off is easily accomplished naturally as they mature and according to plan without a ONE sale by the Fed…
https://fred.stlouisfed.org/release/tables?rid=20&eid=4422&snid=4372
Also… as some of you may know… a Factor is applied each month to principle balance… which in effect reduces the total Outstanding Principle Balance once per month. What that means is that MBS naturally mature as the monthly payments for the each underlying mortgage in that specific pool are paid. + any mortgages in that pool that are paid off due to some being paid off in full due to refinancing’s.
Go way back into history… to see what happens every time liquidity is drained.
Look what happened when liquidity was pumped in with QE in very recent history. What asset class benefited most?
That is the asset class what will be effected the most.
A lot of banks have made quite a foray into equities, most notably the Swiss and the Japanese. I think the FED is also secretly along with the “Working Group” priming the pump. The sad thing is that I think before they liquidate their positions to alleviate the liquidity squeeze they will probably invoke the new “bail-in” provisions and steal depositors money to keep the bubble inflated – talk about adding insult to injury!
One cynic I know contends that they already have! They just have not told depositors about it. lol!
I took a quick gander at the MBS holdings and you are correct. It is only about one third of their holdings at 1.8 T
https://fred.stlouisfed.org/series/MBST
Obviously how badly this portfolio does is very much dependent on how poorly the real estate sector performs during the next down turn. The current delinquency rate for single family residence mortgages is around 3%, down from well over 11% back in 2010. I suspect it is higher for commercial loans. Keep in mind that we are not officially in a recession as yet so that number can be expected to go much higher during a recession.
https://fred.stlouisfed.org/series/DRSFRMACBS
So what’s the most efficient and cost effective means of protection against hyper-inflation?
I think ir will be precious metals , if is stll legal to own them. PM stocks will eventually trade at insane valuations, far exceeding what we saw in tech.
Likely precious metals and a broad basket of commodities. I’d throw in crypto currency as well, but that may not be cost effective at this point.
I am deeply conflicted about crypto currencies. A few really smart people I know like Bob Kudla and a few very savvy programmers all say this is a real paradigm shift and these currencies are going to the moon. Others like Porter Stansberry and Jim Rodgers think they are a classic bubble phenomenon. I guess it does not hurt to hold a few speculative coins on one’s wallet! 🙂
They might be right but it is the only true consensus driven currency on the planet right now other than precious metals
I have been squirreling away shares of a junior minor that pays its dividend in the actual precious metals if one chooses. I think this little gem is either going to get bought out, or is eventually going to be a 50 bagger and am holding as a legacy trade! 🙂
First!!
Have a good weekend you lovely lot!!