
Price moved higher as the main Elliott wave count expected.
Summary: If price makes a new high above 2,462.59 tomorrow, then the target for the bounce to end is at 2,482.
If price breaks below the upwards sloping green channel on the hourly charts tomorrow, then expect a third wave down has just begun. Its short term target would be about 2,382.
Primary wave 4 may be expected to last at least 8 weeks and may end about 2,320.
New updates to this analysis are in bold.
Last monthly and weekly charts are here. Last historic analysis video is here.
ELLIOTT WAVE COUNT
WEEKLY CHART
Click chart to enlarge.
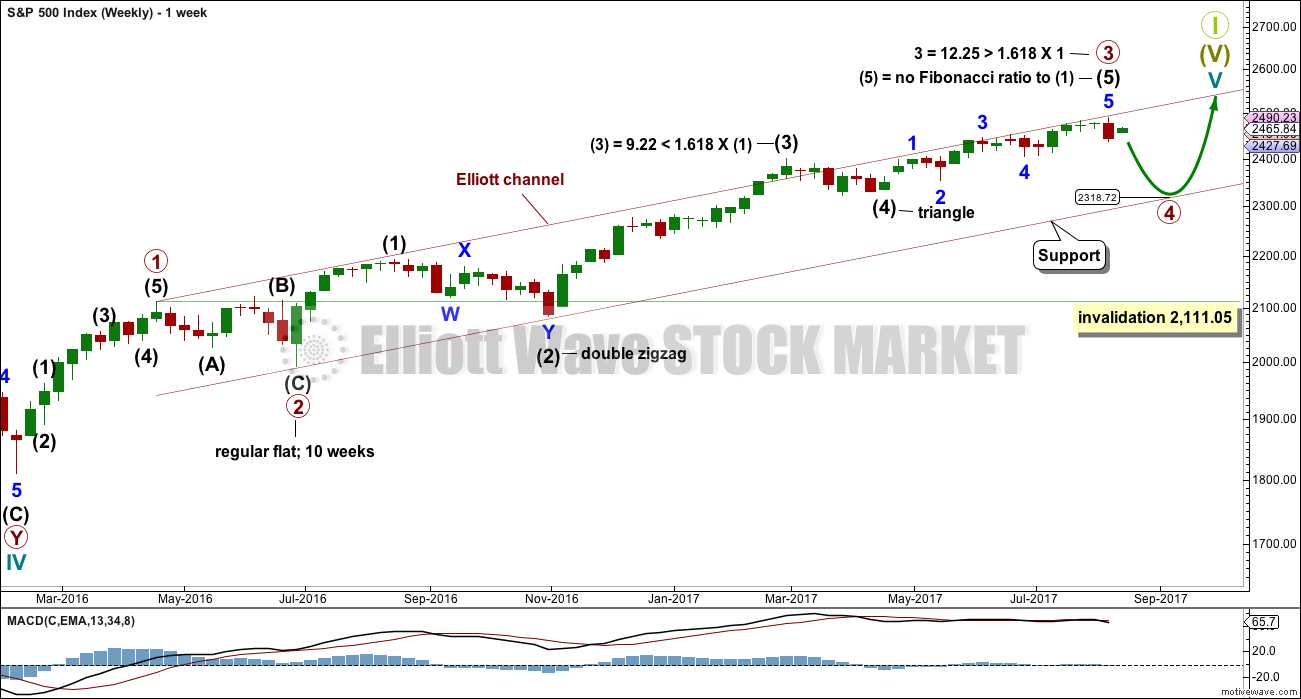
Primary wave 3 now looks complete. Further and substantial confidence may be had if price makes a new low below 2,405.70. Fibonacci ratios are calculated at primary and intermediate degree. If primary wave 3 is complete, then it still exhibits the most common Fibonacci ratio to primary wave 1.
Primary wave 4 may not move into primary wave 1 price territory below 2,111.05.
Primary wave 4 should last about 8 weeks minimum for it to have reasonable proportion with primary wave 2. It is the proportion between corrective waves which give a wave count the right look. Primary wave 4 may last 13 or even 21 weeks if it is a triangle or combination.
If primary wave 4 reaches down to the lower edge of the Elliott channel, it may end about 2,320. This is very close to the lower range of intermediate wave (4); fourth waves often end within the price territory of the fourth wave of one lesser degree, or very close to it.
If price reaches the target at 2,500 and either the structure is incomplete or price keeps rising, then the next target would be the next Fibonacci ratio in the sequence between cycle waves I and V. At 2,926 cycle wave V would reach 1.618 the length of cycle wave I.
DAILY CHART
Click chart to enlarge.
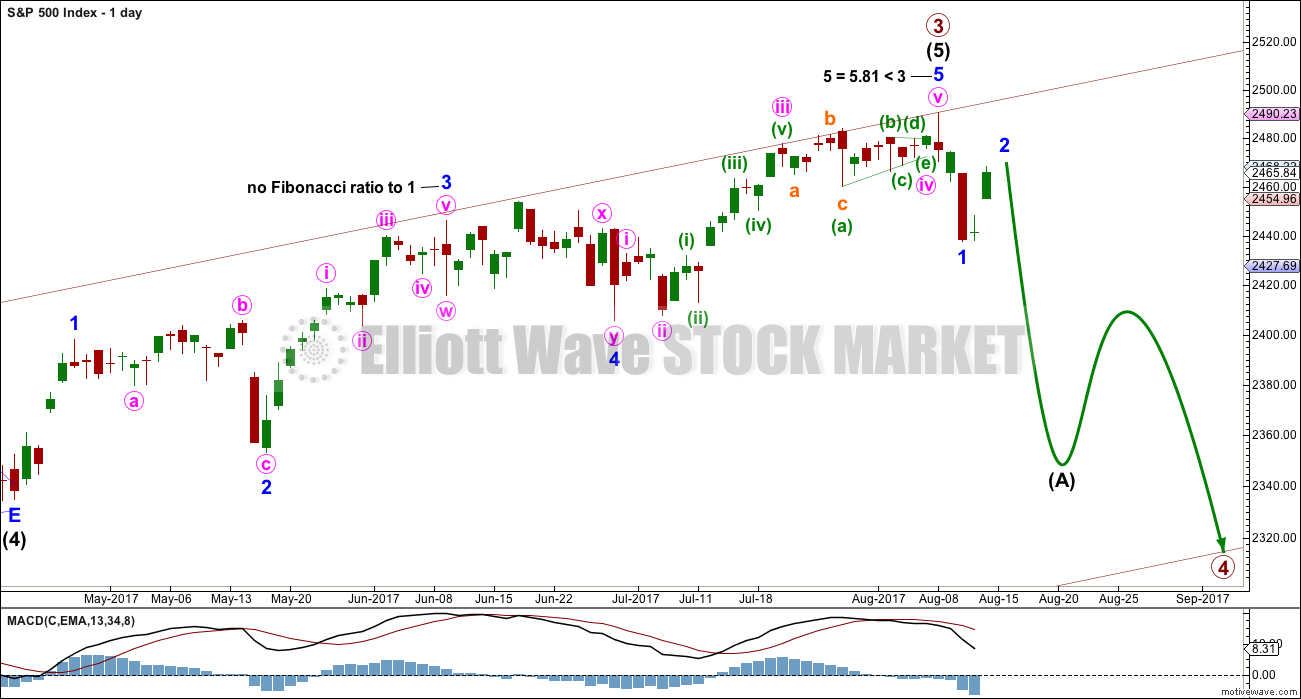
The daily chart shows only the structure of intermediate wave (5); this structure is an impulse.
Primary wave 2 was a regular flat correction lasting 10 weeks. Given the guideline of alternation, primary wave 4 may most likely be a single or double zigzag. Within both of those structures, a five down at the daily chart level should unfold. At this stage, that looks incomplete.
While primary wave 4 would most likely be a single or double zigzag, it does not have to be. It may be a combination or triangle and still exhibit structural alternation with primary wave 2. There are multiple structural options available for primary wave 4, so it is impossible for me to tell you with any confidence which one it will be. It will be essential that flexibility is applied to the wave count while it unfolds. Multiple alternates will be required at times, and members must be ready to switch from bear to bull and back again for short term swings within this correction.
Members with a longer term horizon for their trading may wait for primary wave 4 to be complete to purchase stocks or enter the index long.
HOURLY CHART
Click chart to enlarge.
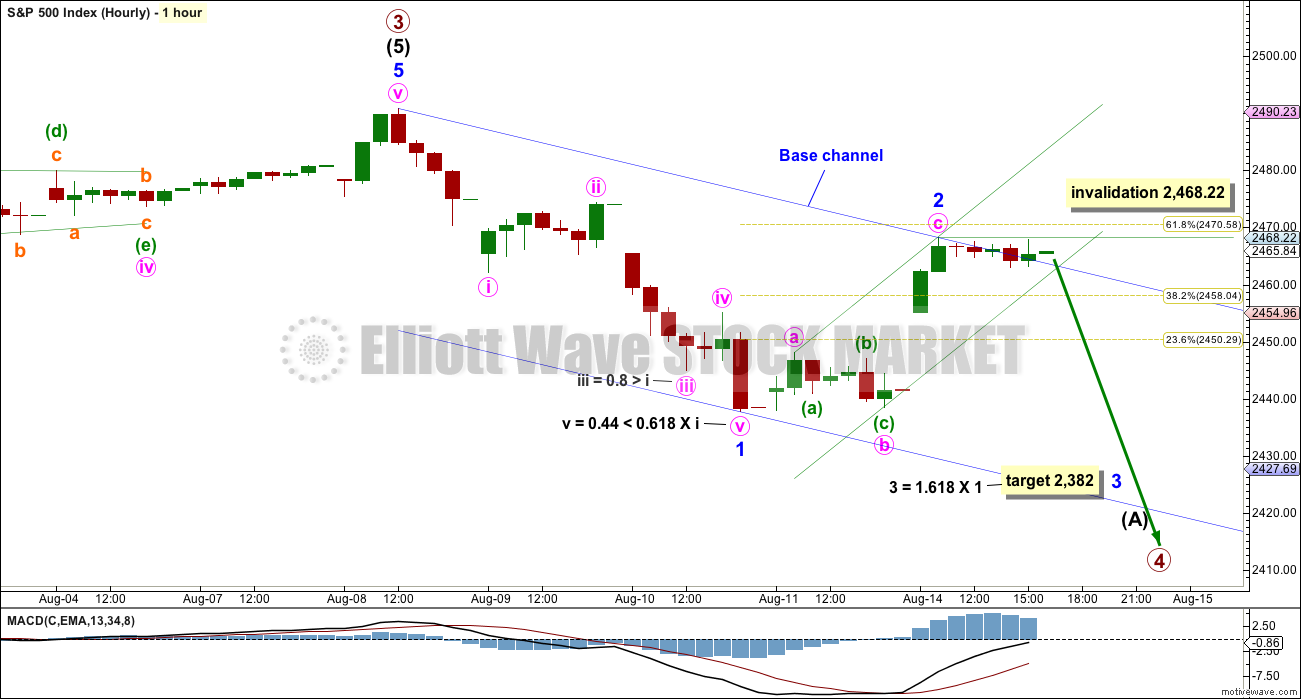
Minor wave 1 downwards looks very clear as a five wave structure.
If price does not make a new high above 2,468.22 tomorrow, then upwards movement will look like a clear three wave structure.
If this is correct, then a five down followed by a three up means another five down should follow it. A target is calculated for minor wave 3 using the most common Fibonacci ratio to minor wave 1.
Within minor wave 3, no second wave correction may move beyond its start above 2,468.22.
The final hourly candlestick of Monday’s session is above the upper edge of the base channel about minor waves 1 and 2. This indicates that minor wave 2 may not be over, so an alternate below is provided.
Use the small green best fit channel about minor wave 2 to indicate when it is over. When price breaks below the lower edge of this channel, it would provide a strong indication that minor wave 2 would most likely be over.
Minor wave 3 should have the power to break below the lower edge of the blue base channel. Once it has done that, upwards movement should find resistance at the lower edge.
ALTERNATE HOURLY CHART
Click chart to enlarge.
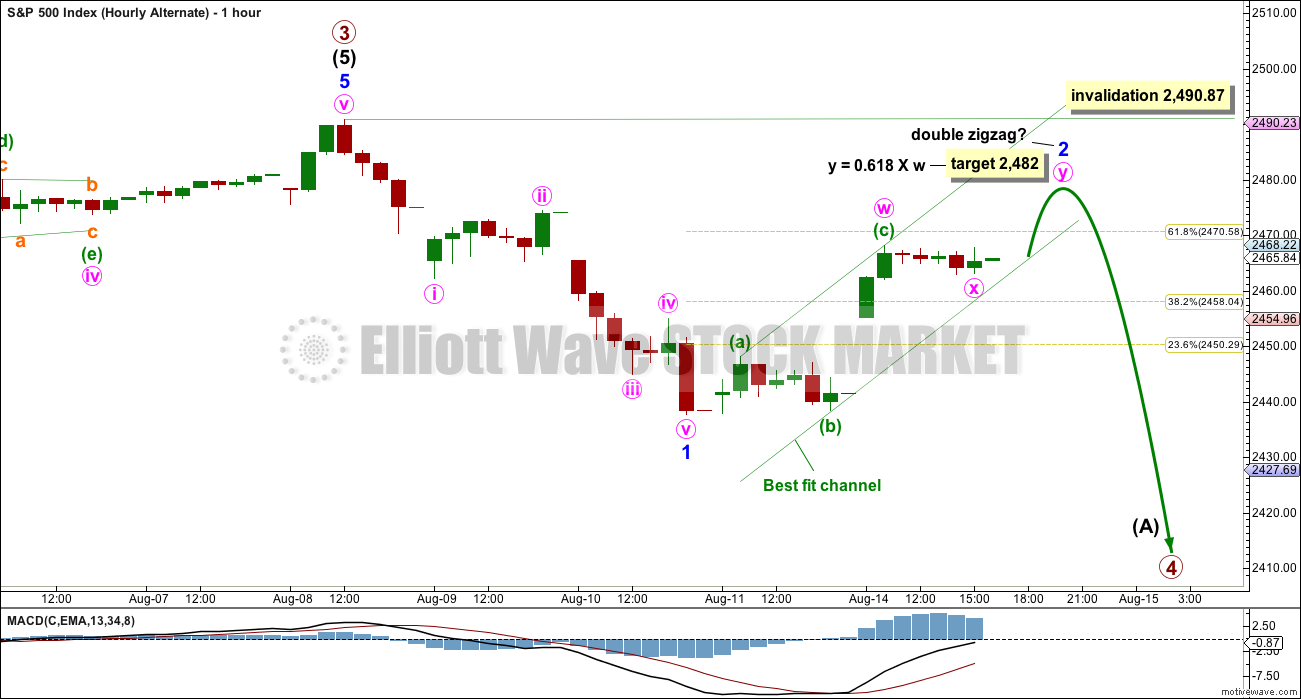
It is entirely possible that minor wave 2 is not over and may continue higher as a double zigzag, or it may continue sideways as a double combination.
Allow for these possibilities while price remains within the small green channel.
Minor wave 2 may not move beyond the start of minor wave 1 above 2,490.87.
TECHNICAL ANALYSIS
WEEKLY CHART
Click chart to enlarge. Chart courtesy of StockCharts.com.
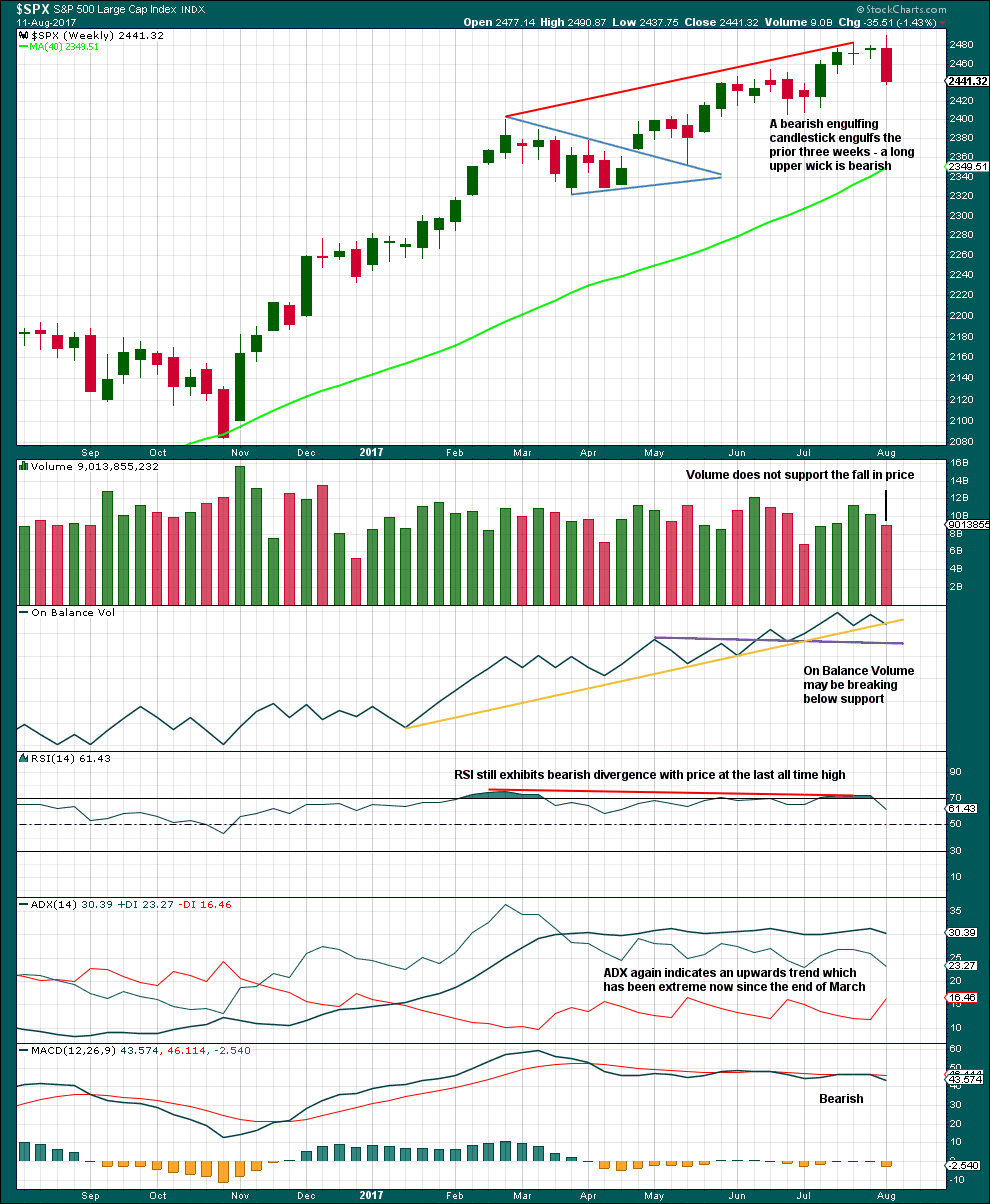
This weekly candlestick is very bearish. A Bearish Engulfing pattern is the strongest reversal pattern.
If this week also moves price lower, then On Balance Volume would give an important bearish signal. For now it may offer some support and assist to initiate a bounce here.
RSI, ADX and MACD all remain bearish.
This weekly chart offers good support to the Elliott wave count.
DAILY CHART
Click chart to enlarge. Chart courtesy of StockCharts.com.
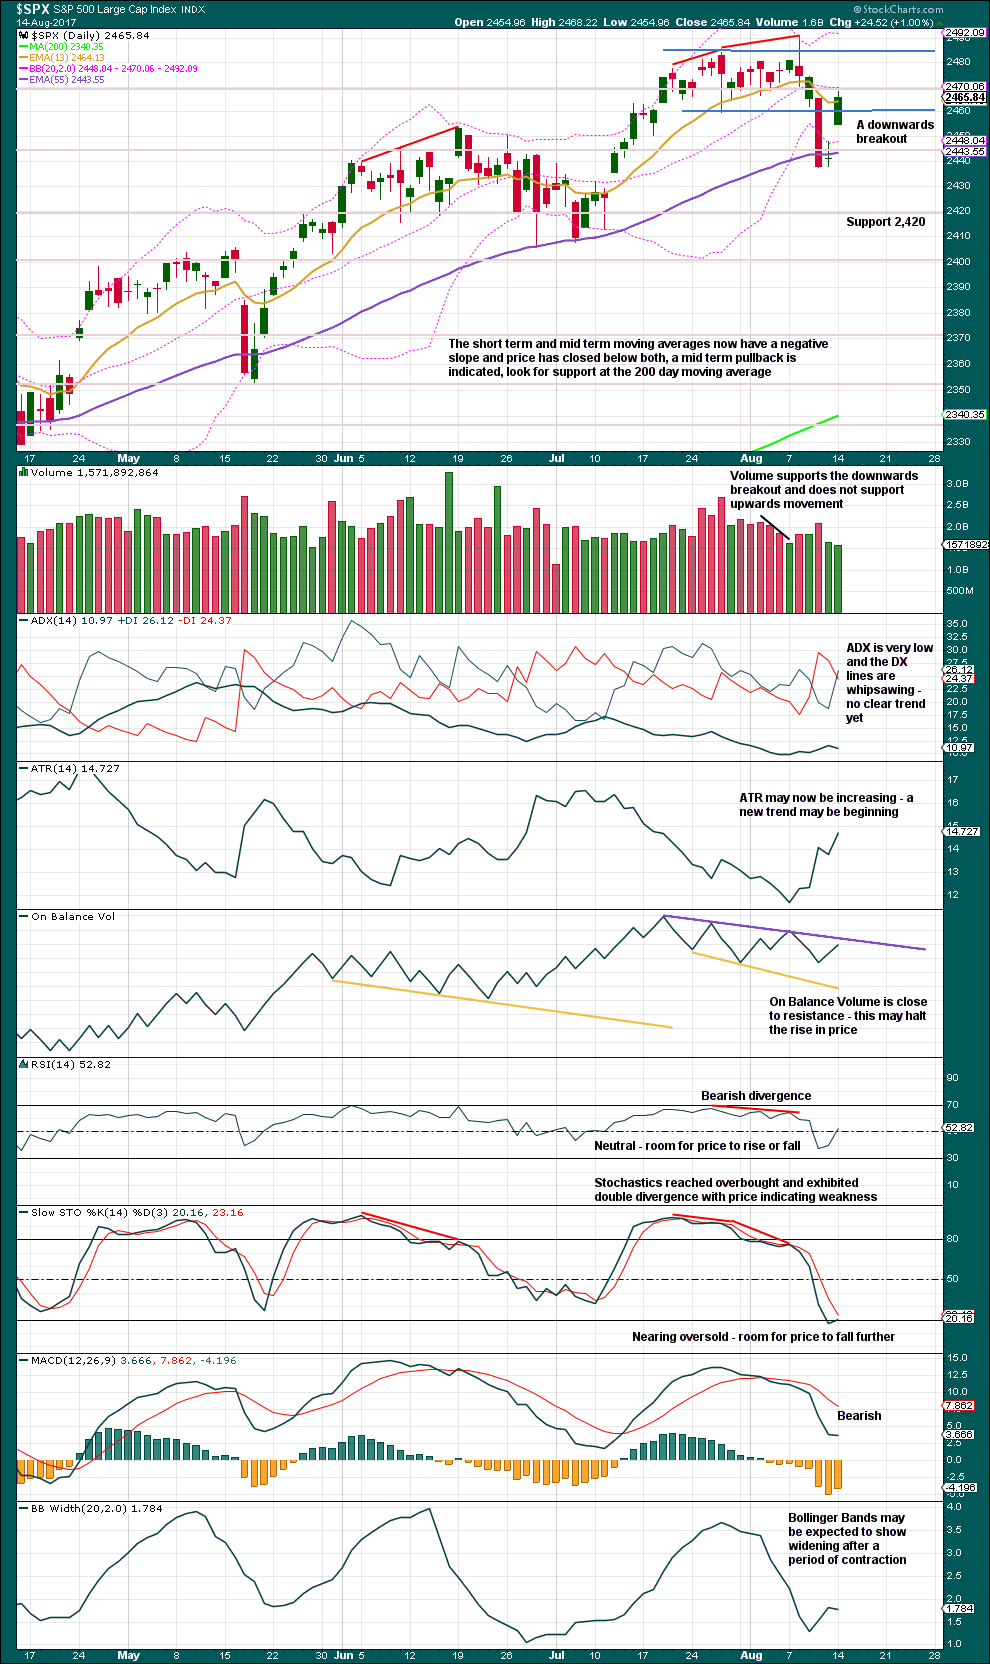
The short term volume profile remains firmly bearish. This supports the Elliott wave count. Price is finding resistance now about 2,470. Next strong resistance would be about 2,485.
There is a little distance to go before On Balance Volume finds resistance. This may allow for one more day of upwards movement, and then it may halt the rise in price.
While ADX does not indicate a new trend, ATR suggests one may be in the early stages.
VOLATILITY – INVERTED VIX CHART
Click chart to enlarge. Chart courtesy of StockCharts.com.
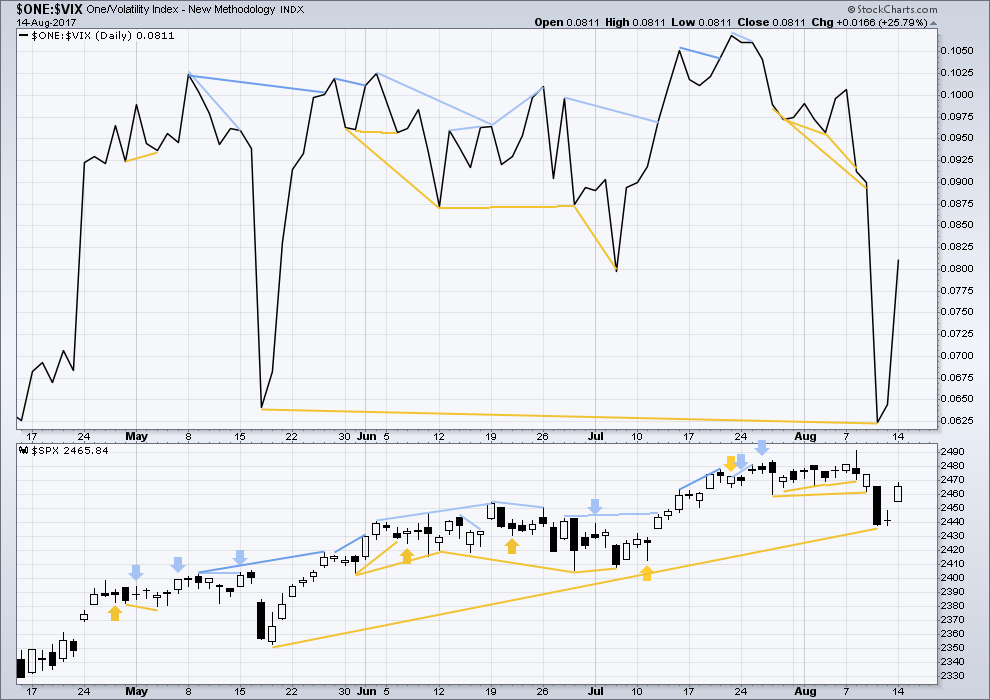
Normally, volatility should decline as price moves higher and increase as price moves lower. This means that normally inverted VIX should move in the same direction as price.
There is longer term divergence between price and inverted VIX, shown in gold lines. However, mid and long term divergence has proven to be reasonably unreliable, so it will be given no weight in this analysis.
BREADTH – AD LINE
Click chart to enlarge. Chart courtesy of StockCharts.com.
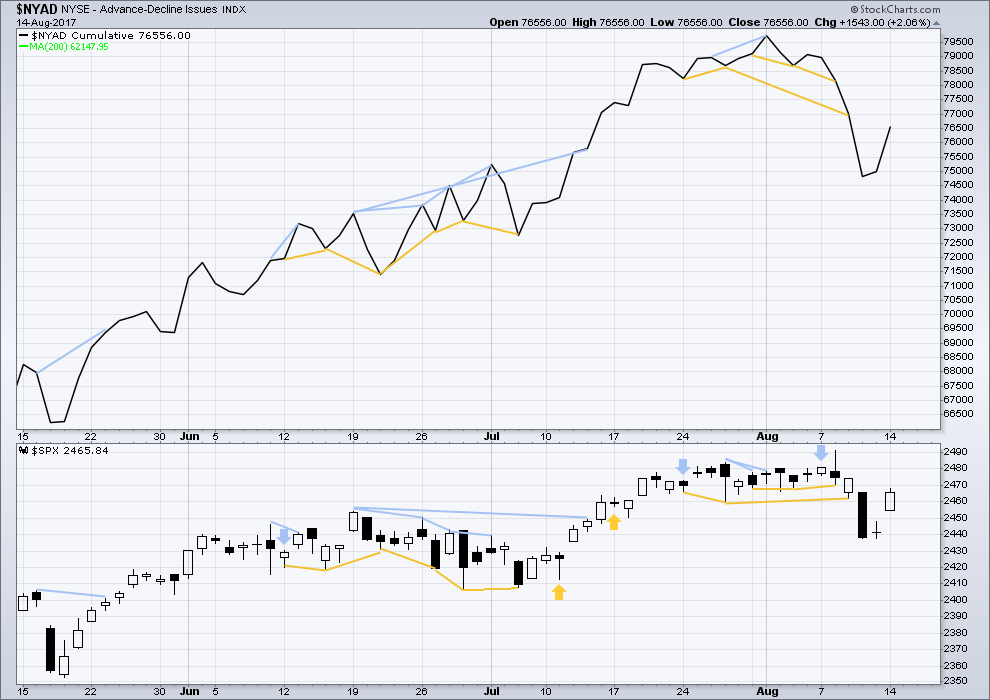
With the last all time high for price, the AD line also made a new all time high. Up to the last high for price there was support from rising market breadth.
There is normally 4-6 months divergence between price and market breadth prior to a full fledged bear market. This has been so for all major bear markets within the last 90 odd years. With no divergence yet at this point, any decline in price should be expected to be a pullback within an ongoing bull market and not necessarily the start of a bear market.
There is no new divergence between price and market breadth today.
DOW THEORY
The S&P500, DJIA, DJT and Nasdaq have all made new all time highs within the last month.
Modified Dow Theory (adding in technology as a barometer of our modern economy) sees all indices confirming the ongoing bull market.
The following lows need to be exceeded for Dow Theory to confirm the end of the bull market and a change to a bear market:
DJIA: 17,883.56.
DJT: 7,029.41.
S&P500: 2,083.79.
Nasdaq: 5,034.41.
Charts showing each prior major swing low used for Dow Theory are here.
Published @ 06:36 p.m. EST.
The alternate hourly chart is the one today. Updated:
Target slightly recalculated. Channel adjusted.
Thank you for the update. The new channel looks remarkably steep. It’s looking like the new count will either need to hit the new target tomorrow or early Thursday, or a new channel will need to be drawn…
Agreed. That channel was too steep. I’m adjusting it.
This action is very similar to the sideways action we got for days Jul 28 – Aug 7, before the headfake “5” pop for a final new high, then instantly diving into the minor 1 down. I don’t expect anything so lengthy here but overall I wouldn’t be surprised at a generally similar conclusion: an eventual quick push up to perhaps the .764 retrace area of minor 1 (about 247.68 SPY) to finish minor 2, and then a swan dive to kick off minor 3. The “weak hands” shorts are probably best shaken out before the sell off gets into serious gear, as well as more buyers are best sucked in to really impel the minor 3 down as they wail and bail. Just like last Tuesday, and again last week Wed-Thurs. My dystopian view of the immediate SP500 future…
I think you are onto something there Kevin. I got shaken out of my short trades on that minute two bounce last week. It has been hard not to have a trigger finger with all the whipsaws we have experienced with this market and it reminded me of how critical it is to have the primary rule of making successful trades right – THE TREND!!
Anyway they got me good.
We have a very firm place to execute our stops and I suspect they are going to take us as close to it as they can.
Figures! Price breaks to the downside.
Aaaaalll Righty Then! Selling to open SPY 245 calls……1.88 per contract
*Yawn*
Not much to see today that’s for sure. Spread at break-even. Let’s see if we can turn it into a profitable bear call spread with a reversal tomorrow. G’nite everyone, have a great evening!! 🙂
Buying SPY 246.5 calls expiring Friday for 0.88.
Opened STC order for 1.10 GTC
Yep! Bored silly…..
Looking like once again some kind of triangle. There has been a never-ending parade of those animals of late. It is not obvious to me what direction it is going to break although if I were to guess I would guess upwards. They are normally fun to trade as the move out of them is typically predictably sharp but somehow right now I find that prospect boring…just want the correction to be done with so I will continue to SOH. I guess I could reload those calls but just too tired…. 🙂
This looks like an expanded flat (or, the dreaded “diamond pattern?”), following the initial ABC zigzag of this overall minor 2. My understanding is triple combos (another corrective structure after we’ve already had 2) are “rare”. Leading me to believe wave 3 down is close to initiating. We’ll see.
Triples are extremely rare. I’ve only ever seen about two or three.
I suspect we will move higher to Lara’s 2482 target after this brief consolidation period.
I will be looking for a classic reversal trigger and ultimately the filling of Monday’s gap before I venture back in…reminds me of Carly Simon’s famous tune…. 🙂
Anticipation! I am expecting the alternate hourly count Lara provided. Then short. Risk is relatively low at that point with stops at new ATH (SPX 2491).
Good point
I’m with you on that play as the most likely, Rodney. Tomorrow, quite possibly. Though tomorrow a gap open down (the minute 1 down), then a gap fill (the minute 2 up), then the minute 3 sell off starting tomorrow is also a potential scenario. I just like to think ahead about alternative “likely” scenarios to not be surprised and not act like a deer in the headlights (which I otherwise do). I expect a fireworks day tomorrow, after today’s noodling. We’ve been in the pattern of “active day, consolidation day” for about a week now.
They will probably pull the same stunt as they did with minute two of minor one, even more so for minute two of minor three. We will probably see minute one down complete intra-day with a deep end of day reversal for minute two that could last a couple days to rattle the bears. I plan on scalping the first wave down, waiting for the second wave bounce, THEN backing up the 18 wheeler!! 🙂
VIX should give a good clue with a slow and steady expansion of the B bands for the third wave down.
I was feeling quite clever over those SPY 246 calls I bought yesterday after futures headed North. I was expecting a very fat trade today and the only thing that saved the day was that I have the habit of entering a STC order at my expected profit target immediately after entering a trade. I have to admit it was pure luck, but I got my STC
order on the calls filled at the top tick of exactly 247.00 this morning for a decent 20% gain; a great example of why it is good having an exit strategy for each trade.
😉
Very nicely done Verne 🙂
And that’s a good point: an exit strategy is just as important as an entry strategy.
Why, thank you kindly mi’Lady! 🙂
Mr. Market looks like he wants to churn today. I will be waiting for a trade-able short side move below 2448.09, the top of the last gap to signal an end to the correction. Time to SOH….
Futures right now pointing to another strong upwards day. Hard to believe we could get back to 2490, but at this rate I expect an invalidation and an extension of P3. I really don’t see a point in calling a top on this market ever.
Don’t let your emotions affect your trading strategy (I have to admit that I sometimes do). We simply do not know what Mr. Market is going to do until he does it. The key is to be prepared for whatever he does, and trade what you see! 🙂
Yikes! That was fast! Thank you, Lara.
🙂 Keeping everyone on their toes?