
A small inside day for Friday changes the very short term picture only slightly.
Summary: A bounce may have begun on Friday. Some confidence in this view may be had if price makes a new high above 2,448.09 now. The target is either 2,458 or 2,470.
Primary wave 4 may be expected to last at least 8 weeks and may end about 2,320.
New updates to this analysis are in bold.
Last monthly and weekly charts are here. Last historic analysis video is here.
ELLIOTT WAVE COUNT
WEEKLY CHART
Click chart to enlarge.
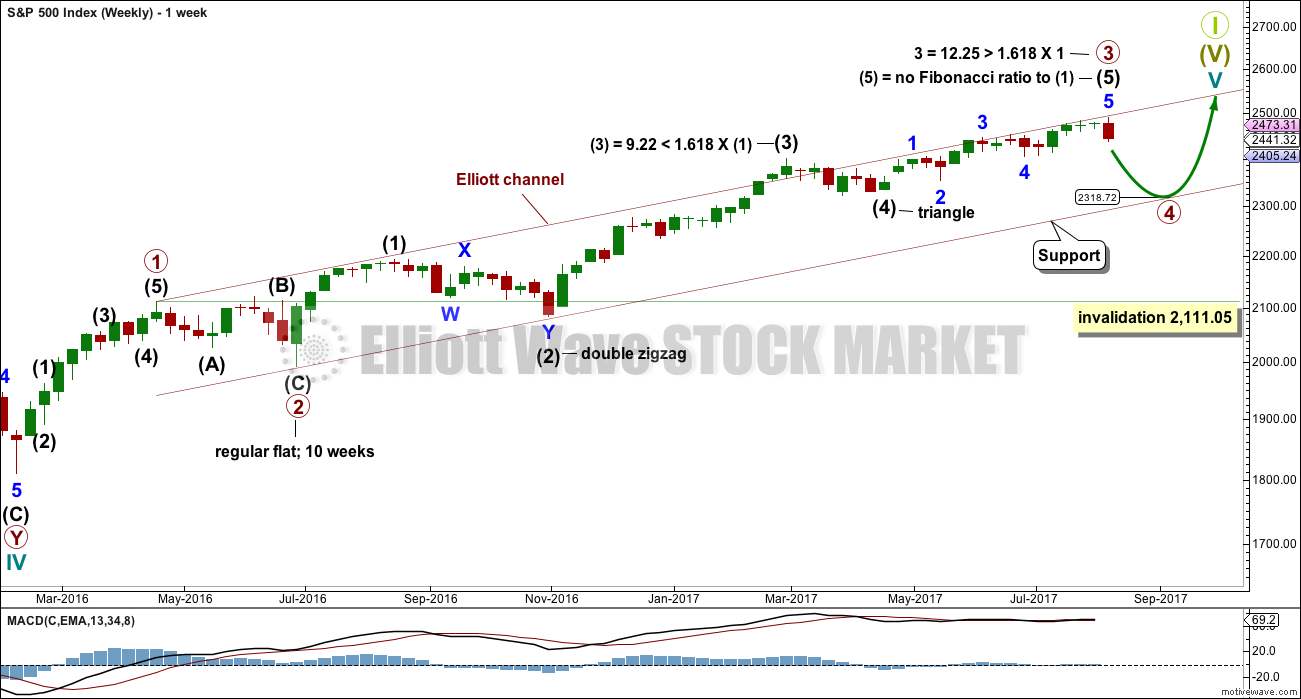
Primary wave 3 now looks complete. Further and substantial confidence may be had if price makes a new low below 2,405.70. Fibonacci ratios are calculated at primary and intermediate degree. If primary wave 3 is complete, then it still exhibits the most common Fibonacci ratio to primary wave 1.
Primary wave 4 may not move into primary wave 1 price territory below 2,111.05.
Primary wave 4 should last about 8 weeks minimum for it to have reasonable proportion with primary wave 2. It is the proportion between corrective waves which give a wave count the right look. Primary wave 4 may last 13 or even 21 weeks if it is a triangle or combination.
If primary wave 4 reaches down to the lower edge of the Elliott channel, it may end about 2,320. This is very close to the lower range of intermediate wave (4); fourth waves often end within the price territory of the fourth wave of one lesser degree, or very close to it.
If price reaches the target at 2,500 and either the structure is incomplete or price keeps rising, then the next target would be the next Fibonacci ratio in the sequence between cycle waves I and V. At 2,926 cycle wave V would reach 1.618 the length of cycle wave I.
At the end of last week, Lowry’s analysis favours the idea that primary wave 4 has begun.
DAILY CHART
Click chart to enlarge.
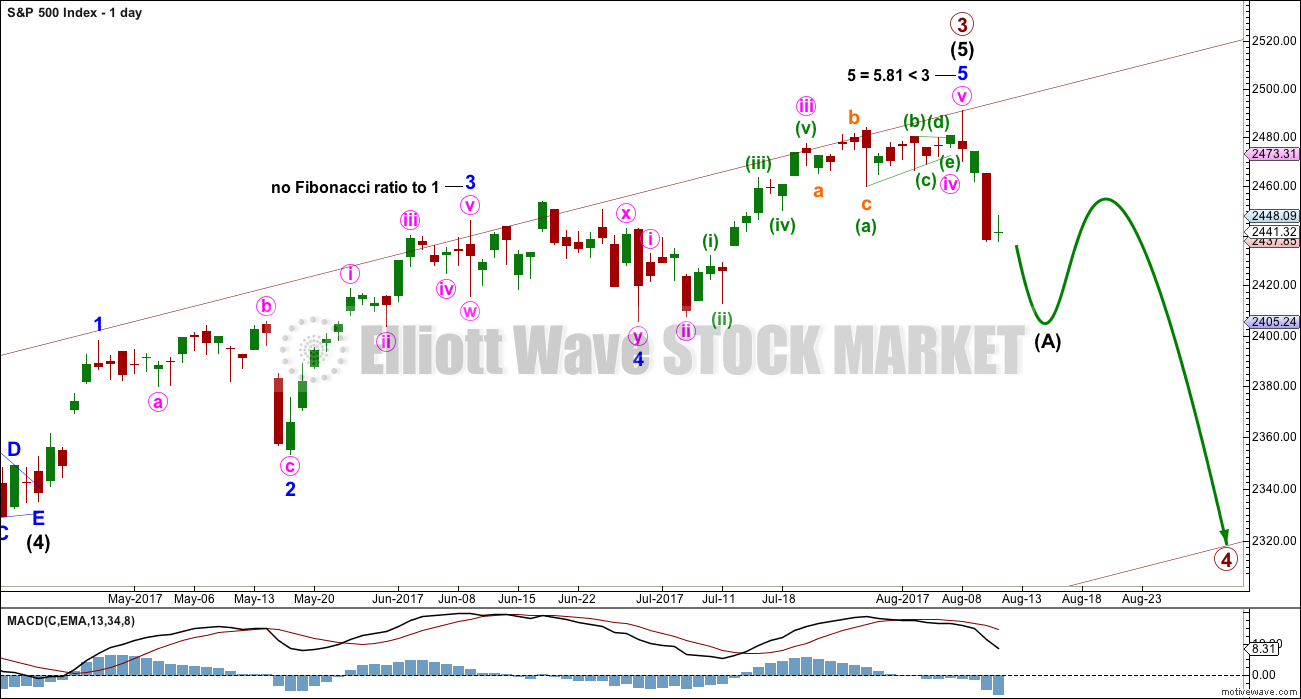
The daily chart shows only the structure of intermediate wave (5); this structure is an impulse.
Primary wave 2 was a regular flat correction lasting 10 weeks. Given the guideline of alternation, primary wave 4 may most likely be a single or double zigzag. Within both of those structures, a five down at the daily chart level should unfold. At this stage, that looks incomplete.
While primary wave 4 would most likely be a single or double zigzag, it does not have to be. It may be a combination or triangle and still exhibit structural alternation with primary wave 2. There are multiple structural options available for primary wave 4, so it is impossible for me to tell you with any confidence which one it will be. It will be essential that flexibility is applied to the wave count while it unfolds. Multiple alternates will be required at times, and members must be ready to switch from bear to bull and back again for short term swings within this correction.
Members with a longer term horizon for their trading may wait for primary wave 4 to be complete to purchase stocks or enter the index long.
HOURLY CHART
Click chart to enlarge.
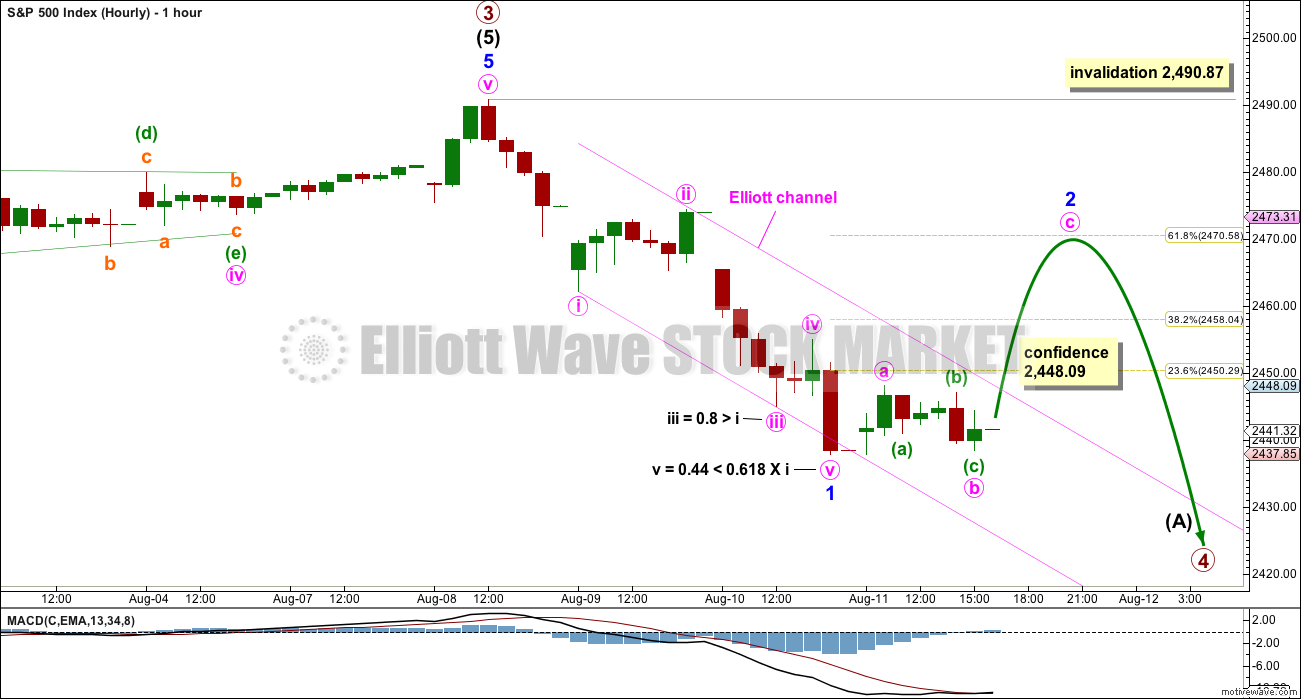
With a five down looking clear on the hourly chart, and now Friday’s movement choppy sideways movement, it looks like minor wave 1 is over and minor wave 2 has begun. There are Fibonacci ratios between all actionary waves within the impulse of minor wave 1.
Minor wave 2 may be any corrective structure except a triangle. Targets for it to end would be the 0.382 and 0.618 Fibonacci ratios, with the 0.618 Fibonacci ratio favoured.
Minor wave 1 lasted two days. Minor wave 2 may last about two to five days to have good proportion to minor wave 1, so that the wave count has the right look.
Minor wave 2 may not move beyond the start of minor wave 1 above 2,490.87.
ALTERNATE HOURLY CHART
Click chart to enlarge.
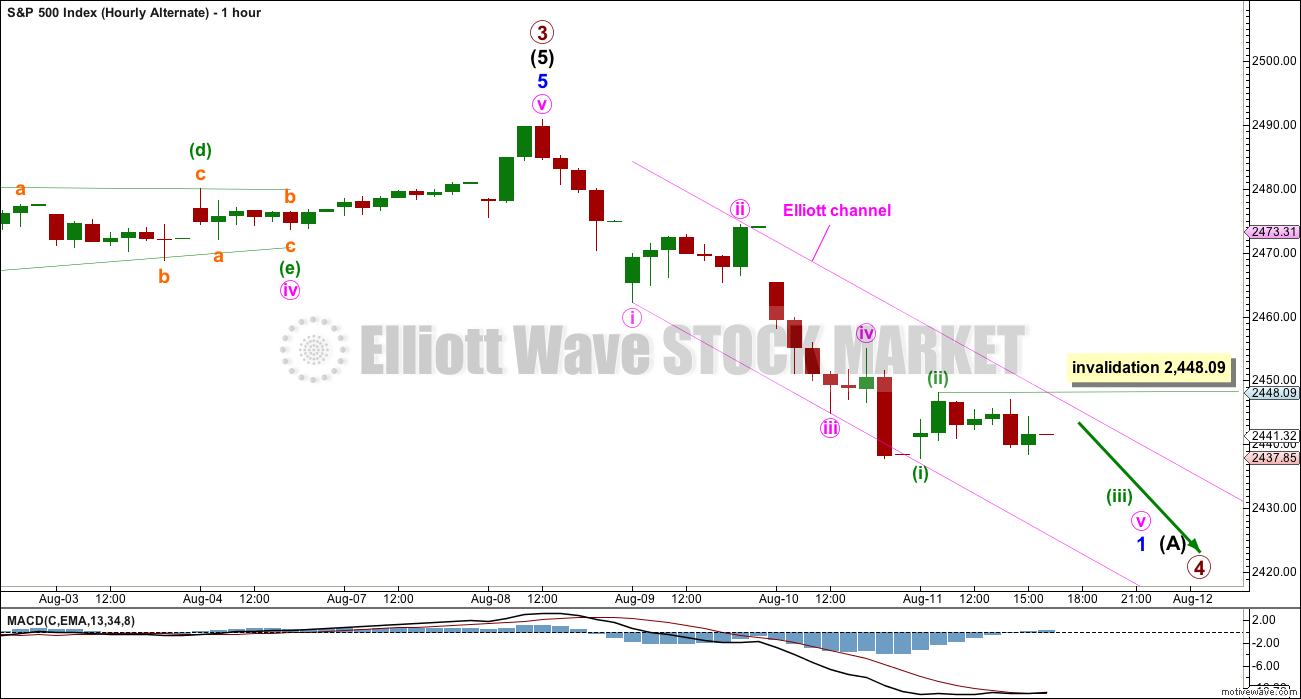
I have considered the possibility that minute wave iv may be continuing as a triangle. It will fit as a triangle, but the upper A-C trend line would have too steep a slope, and it would be difficult for the triangle to end and effect a net retracement of minute wave iii.
I have considered the possibility that minute wave iv may be continuing as an expanded flat correction. That would require the channel to be strongly breached, and minute wave iv would then be grossly disproportionate to minute wave ii.
The most reasonable consideration would be that minute wave iv is over, and Friday’s sideways movement may be part of minute wave v.
Within minute wave v, minuette waves (i) and (ii) may be complete. However, downwards movement at the end of Friday’s session does not look like a third wave unfolding, even one of a small degree.
Within minuette wave (iii), no second wave correction may move beyond its start above 2,448.09.
TECHNICAL ANALYSIS
WEEKLY CHART
Click chart to enlarge. Chart courtesy of StockCharts.com.
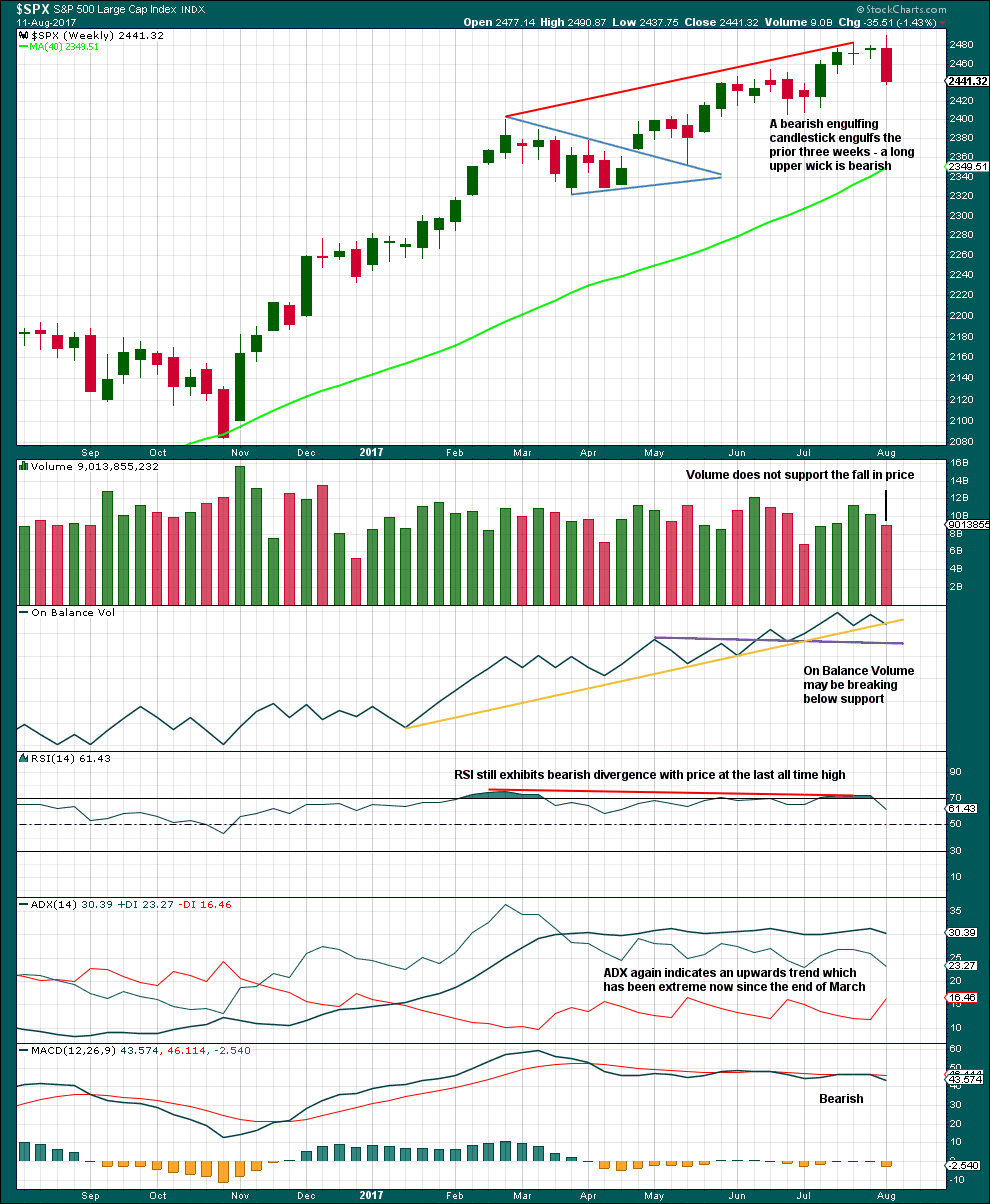
This weekly candlestick is very bearish. A Bearish Engulfing pattern is the strongest reversal pattern.
If next week also moves price lower, then On Balance Volume would give an important bearish signal. For now it may offer some support and assist to initiate a bounce here.
RSI, ADX and MACD all remain bearish.
This weekly chart offers good support to the Elliott wave count.
DAILY CHART
Click chart to enlarge. Chart courtesy of StockCharts.com.
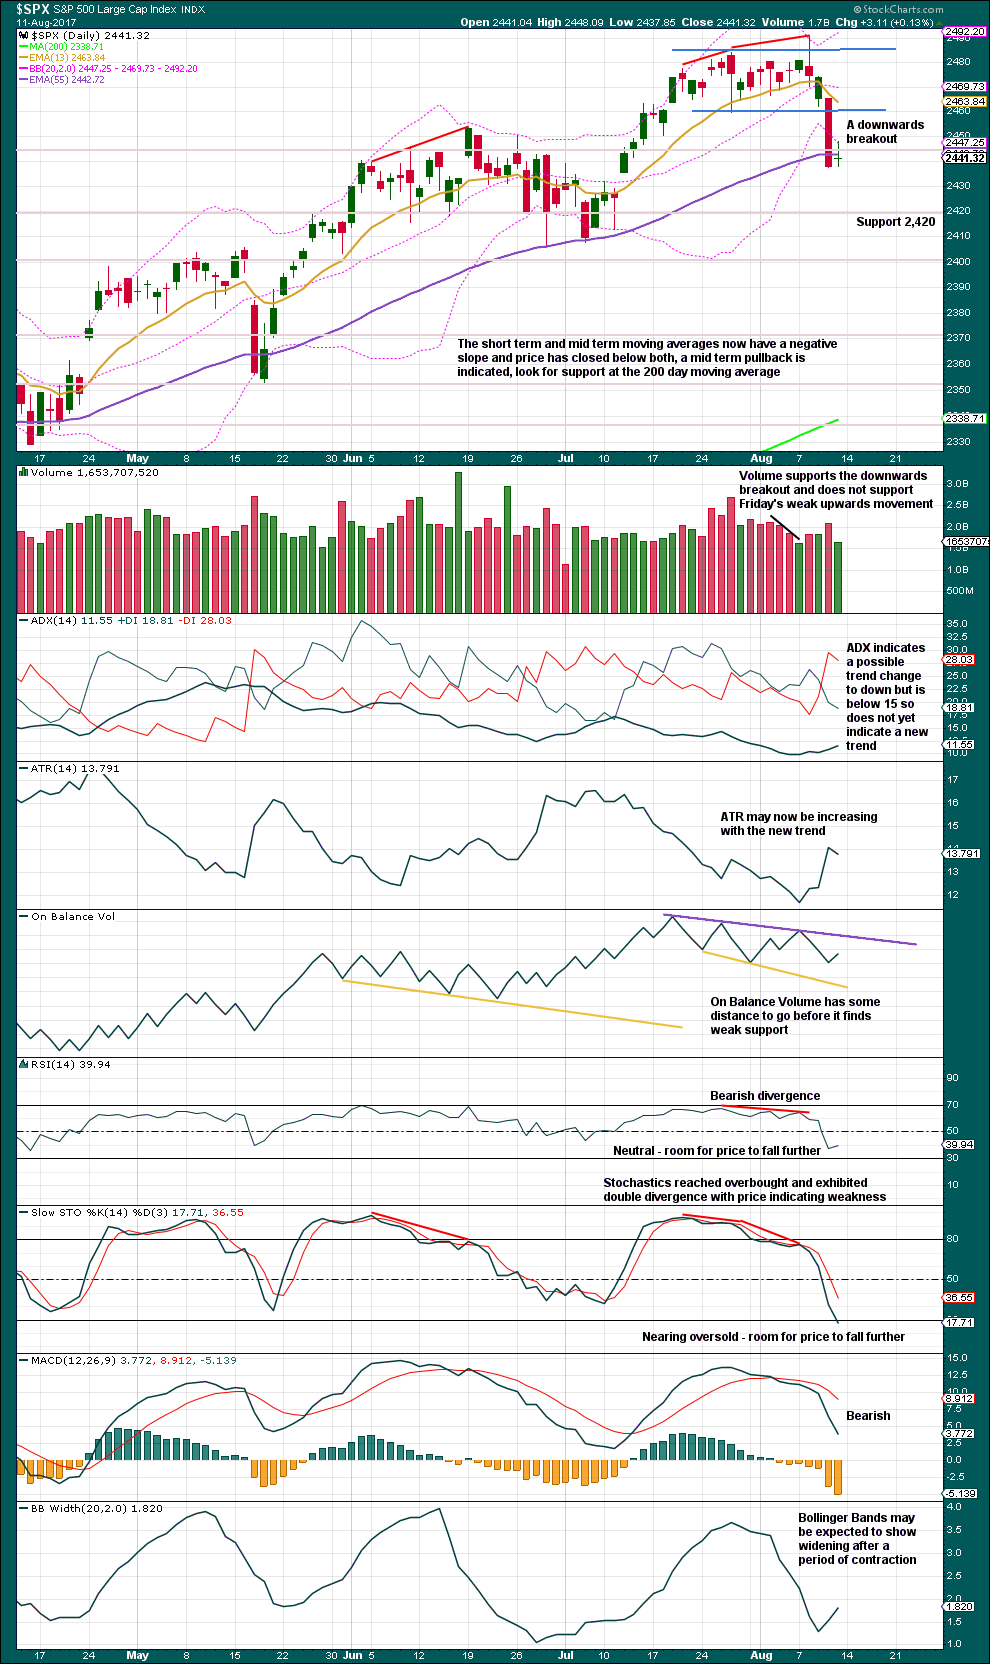
The short term volume profile is bearish. Look now for resistance about 2,460.
There is room for price to fall further. RSI and Stochastics are not yet oversold. On Balance Volume is not yet at support.
This chart is on balance fairly bearish and offers good support to the Elliott wave count.
VOLATILITY – INVERTED VIX CHART
Click chart to enlarge. Chart courtesy of StockCharts.com.
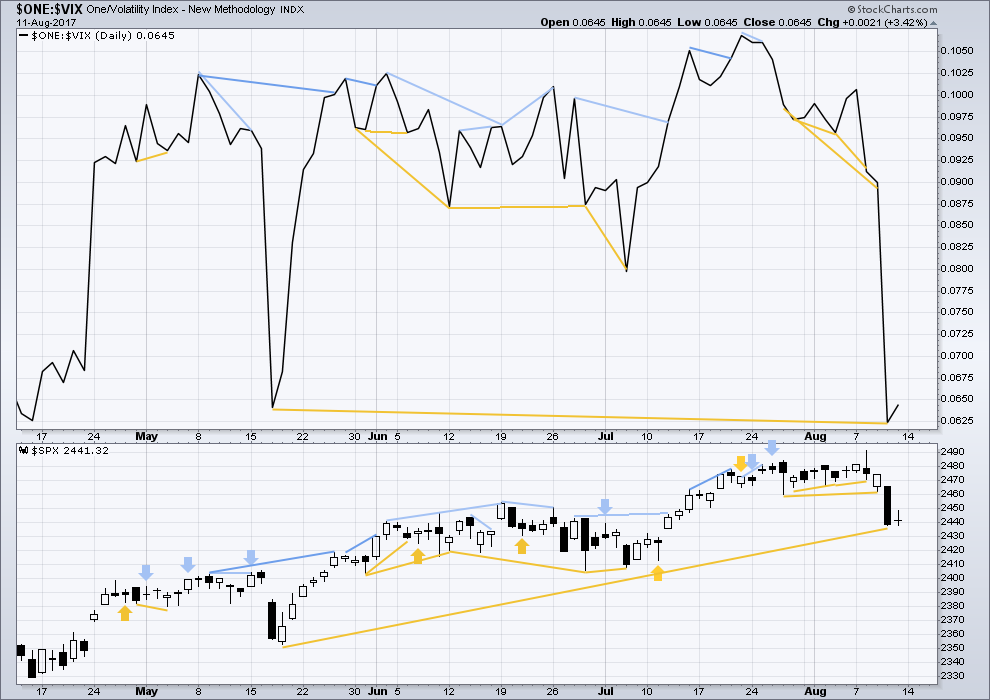
Normally, volatility should decline as price moves higher and increase as price moves lower. This means that normally inverted VIX should move in the same direction as price.
There is longer term divergence between price and inverted VIX, shown in gold lines. However, mid and long term divergence has proven to be reasonably unreliable, so it will be given no weight in this analysis.
BREADTH – AD LINE
Click chart to enlarge. Chart courtesy of StockCharts.com.
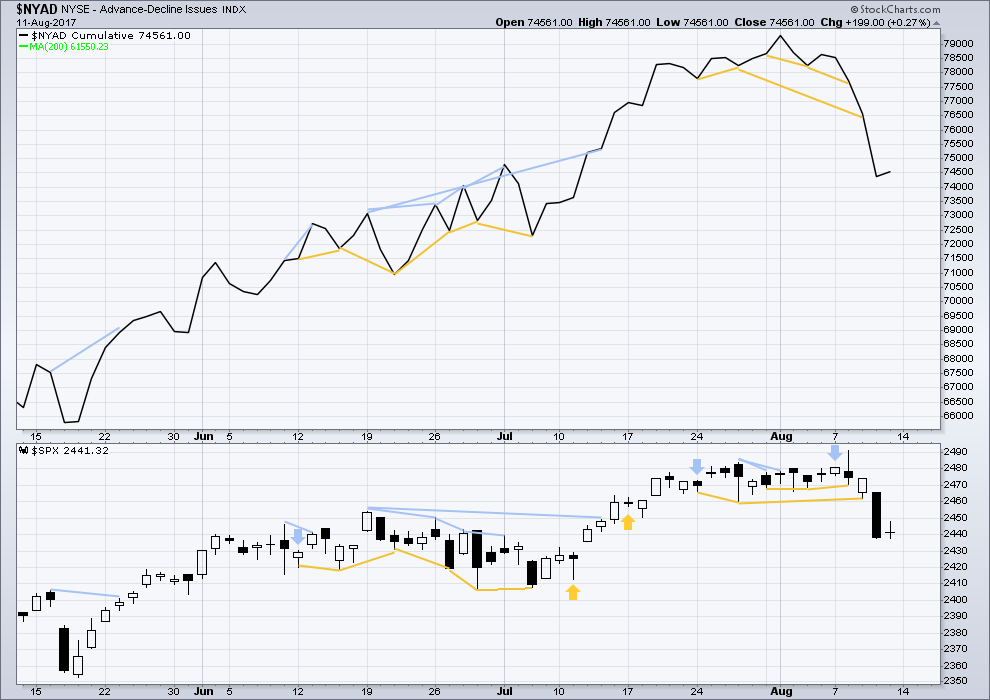
With the last all time high for price, the AD line also made a new all time high. Up to the last high for price there was support from rising market breadth.
There is normally 4-6 months divergence between price and market breadth prior to a full fledged bear market. This has been so for all major bear markets within the last 90 odd years. With no divergence yet at this point, any decline in price should be expected to be a pullback within an ongoing bull market and not necessarily the start of a bear market.
There is no new divergence between price and market breadth today.
DOW THEORY
The S&P500, DJIA, DJT and Nasdaq have all made new all time highs within the last month.
Modified Dow Theory (adding in technology as a barometer of our modern economy) sees all indices confirming the ongoing bull market.
The following lows need to be exceeded for Dow Theory to confirm the end of the bull market and a change to a bear market:
DJIA: 17,883.56.
DJT: 7,029.41.
S&P500: 2,083.79.
Nasdaq: 5,034.41.
Charts showing each prior major swing low used for Dow Theory are here.
Published @ 11:45 p.m. EST on 12th August, 2017.
Verne–appreciate you answering my UVXY question earlier today and always look forward to reading your volatility comments.
Most welcome Davey…. 🙂
Hourly chart updated:
It’s possible minor 2 could be over. Or it could continue higher as a double zigzag, or it could continue sideways as a double combination.
I am slightly concerned at the small overshoot by the last hourly candlestick of the base channel. If minor 2 is over, price shouldn’t be doing that.
Let’s see how this ends. If the base channel is properly breached or strongly overshot I may relabel minor 2 as incomplete.
What does look clear so far on this hourly chart, is minor 1 down looks very strongly like a five, and now so far minor 2 up looks strongly like a three.
Five down, three up. If that’s correct then there’s been a trend change.
Volatility is hinting at more upward movement tomorrow. I am adding a tiny quota of 246 calls expiring Friday just for fun!
Wow! I left a pile of cash from my vol trades on the table today. Not that I am complaining but positions popped another 25%….Yikes! 🙂
Chris Vermeulen does some interesting analysis on VIX spikes. He missed the most recent one by two days but he was close and he is predicting a two more in August and September. Here is his take if anyone is interested…
http://www.safehaven.com/article/44662/dot-com-do-over
The banksters have managed to intimidate short sellers the last many months of this BTFD frenzy of a market. People like Soros who would normally make trades in the hundreds of millions are no longer on the scene. This is abundantly obvious from the pathetic volume evident for quite some time now. I wonder what it would take to bring back some of the “heavy hitters”?
(Yep! They making those round numbers in DJI very “sticky”….)
Volume has been declining for years. The bull market will end, and I think the very light volume suggests that when the final high is in the fall will be swift and brutal. Because there will be very little to hold it up.
If volume has been so light, there aren’t a lot of buyers. So the few buyers along the way up will be little hindrance to selling pressure.
But not yet.
There could also be some round number psychology at play with these DJI levels -22,000.00 for the index and 220.00 for the Diamonds….a close below them could cause the dam to give way so to speak….
Boy are they trying to keep the bulls interested into the close.
What next – a big fat red candle???! Hyuk! 🙂
I am content to wait for Mr. Market to close this morning’s gap…no need to get cute…
(But I must admit I’ve got some awfully itchy trigger fingers!!!)
Hold up Verne…. watch the base channel. This hourly candlestick may close above it.
Minor 2 may yet move a bit higher… it may not be over quite yet. It does look a bit quick too.
Keeping the ammo dry! 🙂
While the SPX cash index turned at the midpoint between 50% and 61.8%, the SPX futures turned at the same time, because the prices differ a bit, at almost exactly 61.8%.
I see a minuette iv of the minute c up. In which case a minuette v should follow, which could just tag the actual .618 retrace of minor 1 around 246.91 (SPY), or blow through and finish today/tomorrow up around the .764 at 247.68. Anyone count this impulse minute c differently? Within the minuette iv I see an abcd of a rectangle/triangle, with e forming…
triangle wave e is complete. Time to pop the minute v cork to the upside is my best guess.
VIX seems to have put in a low this morning at 12.24. Continuing divergence with market move higher would be noteworthy…
No, I’m betting this is wave A. There is no clear wave 3 for it to be a C. Also timewise we are only 38% of wave 1 so far.
Functionally there’s not too much difference in the very short term. If it’s minute a then minute b should be close at hand for a decent size drop and probably a gap fill. Similar if it’s minute c and then minute 1 of a minor 3 should be close at hand for the same before the minute 2 kicks in (which you’ll be calling wave C…until it doesn’t exceed the highs here!). As for the 38% time factor, I rather thought that corrective moves tended to be shorter (38-62%) of the time taken by impulses, putting this right in the reasonable zone for a complete minor 2? I’d be interested to hear Lara’s take on that.
They can be shorter… they can be longer in duration. Corrections.
It depends on the structure. Combinations and triangles are time consuming, zigzags are quick.
A C is supposed to be an impulse, and if hourly count #1 is correct and this is a c, I count a minuette i, ii, iii (the high so far today), and current executing iv. Anyone see it differently? My caution re: short position is increasing. I’m suspicious of another leg up Real Soon Now, for minuette v…
I can’t make decide if this is just the finish of wave A or minor 2 or whether the whole of minor 2 is nearly finished ?
Current popular theory is this is minute wave c of minor 2. minute wave a was the early high from yesterday, and minute wave b was the late afternoon low from yesterday. That’s how Lara’s #1 hourly chart characterized it. That’s how I’m trading it. Whether minor 2 is done is a subject of much current market debate!! (I’m betting yes.) G’luck!!
I’m sitting on the fence on this right now.
Are they sneaking out the back door?
Bid on option contracts suggest a stealthy exit could be underway…. 🙂
Short time. Fall mountain!!! And fill gap…. I’ll stop out and try again higher if market pushes to new highs here yet again. Everything seems to be proceeding as Lara has foreseen in hourly chart #1, may it continue!
I would be extremely surprised if that gap is filled during the regular session as that would be way too easy. Can you imagine the pandemonium that would ensue if traders saw that happening under the circumstances???!!
I think they are going to drag this on into the close and frankly overnight it could go either way. Another monster jack of futures, or the third wave we are all hoping for, but which never seems to arrive! 🙂
Predictably, this move up coming on relatively low volume. It should be an awesome short side set-up when the corrective move is done….come on 2470…let’s get this over with…! 😀
Selling last 1/4 of VXX puts. Time to start scaling into short positions. I am going to be sneaky and do it via 1 point wide bullish put spreads to get paid to get positioned. Hopefully we get enough more upward movement to close short leg of spread at break-even or better. Interesting times ahead….
A lot of short trades are probably sporting stops at 2470 or slightly above. I think the market makers are determined to run them all. I will be looking for a sharp move past that pivot and a quick reversal…
Selling another 1/4 of VXX puts….
Shorted KSS at today’s high of 39.21
It apparently has a very short memory and keeps thinking is should be a 40.00 dollar stock. Any time it sniffs the 40.00 point area is an opportunity to do some early Xmas shopping…. 🙂
The market looks like it is setting up for a blow off move up into the close today with VIX making a new low below 11.11. If that happens it is going to be uber bearish. Traders taking that bait and going long overnight my have a nasty surprise in store by way of the futures market…
If we mirror DAX, and we have been of late, we should head up to at least the 2470 former strong support area before we get a reversal. If we break through that pivot, I think we will head back to 2490.00 or thereabouts…
The key to 5X and 10X vol trades is catching the final spike higher after the first B band penetration. For VIX it was 17.28 right at the open on Friday. I use a contingency order to get filled on that final spike before price reverses and it is a really very predictable “bread and butter” trade. The window to get filled literally lasts for seconds so it has to be an open order with a good idea of where the option is likely to trade at the peak of the spike. You know the trade has been executed perfectly when you get filled on the move up, and the position immediately goes into the green. This is one of the only trades I have discovered that allows you to exploit an option trader’s best weapon- volatility, and beat market makers every single time. Not too many ways to accomplish that in this crazy market. 🙂
That’s wonderful, thank you so much for sharing with the membership!
Most welcome! It is an easy trade and I hope members take a stab at it sometime. There are not many trades that offer high probability rewards that I have found but that is sure one of them as I have occasionally pointed out. Trading even once contract to get the “feel” of the trade is worth giving it a try.
Before you know it, you will be throwing around a few hundred contracts like nobody’s business…its that easy! 🙂 🙂 🙂
Short vol trades exploded as predicted by upper B band move. Selling half of position for 5X pop. Holding remaining half to see where move up ends. Hedged short position with sale of SPX 240/245 bull put spread expiring next week. I thought we would get one more wave down but that ain’t happening.
2470 should prove a brick wall to further upward forays….
So where and when do we think minor 2 is ending? For what it’s worth, RUT has reached the bottom of a channel that stretches back to December. Either we see sustained upward movement, or look out below… I will be looking at volume on /VX and /ES for an indication of direction.
“Minor wave 2 may be any corrective structure except a triangle. Targets for it to end would be the 0.382 and 0.618 Fibonacci ratios, with the 0.618 Fibonacci ratio favoured.
Minor wave 1 lasted two days. Minor wave 2 may last about two to five days to have good proportion to minor wave 1, so that the wave count has the right look.”
I have both fibo retrace (.38 to .62) and a bunch of symmetric projections that point to the area (in SPY, sorry) between 246.20 and 247.60 as the likely turn zone. It’s just penetrated into that zone now. And there’s that giant gap below waiting to be filled, sooner or, probably, sooner!
Verne and other UVXY traders.
Ignore short term peaks and valleys, where do you see UVXY when SP 500 reaches primary 4 target about 2320?
lWe cannot in my view, entirely dismiss the possibility of new all time highs. The move down frankly looks like a three to me. Looking at other indices is also helpful and as Andrew pointed out, not only is RUT at the bottom of a well-defined channel, NDX traced out five waves off its lows. VIX in particular, is sending a strong signal that the market’s immediate direction is up. I have never seen that upper B band penetration fail to predict an imminent end to a decline. Having said that, the bearish signs in this market are numerous and undeniable, including the recent outside weekly candle. We may simply get a very deep second wave correction, OR, all the indices could be aligining in an across the board huge possible ending diagonal. I thought we already had a rising wedge throw-over and break back below the upper wedge boundary but VIX was clearly indicating strong upward movement this week. If VIX makes new lows, an interim top is not in, or this could be a higher degree second wave with some very serious downside dead ahead.
UVXY should easily clear 50 by the end of P4.
#1 with a bullet!
I am back from summer travels and vacationing. It is nice to see the top of Primary 3. Now I plan to get in on the action during the next counter-trend rally. Lara’s guidance and analysis has been right on.
Have a great remainder of the weekend.
Welcome back Rod!
Welcome back Rodney 🙂
I see you found a little bear cubby to let loose for us…
Ain’t he jus’ the cutest lil’ thang??! 😀