
It looks like price has broken upwards out of a symmetrical triangle.
Some trading advice on how to use gaps is offered today to members.
Summary: Members with long positions may pull stops up to the lower edge of today’s gap at 2,374.15. A small pullback may unfold here or shortly. It may be relatively brief and shallow, but that may offer another entry point to join the upwards trend.
A new low below 2,344.51 would indicate the breakout was false. The target would then be at 2,313.
New updates to this analysis are in bold.
Last monthly and weekly charts are here. Last historic analysis video is here.
MAIN ELLIOTT WAVE COUNT
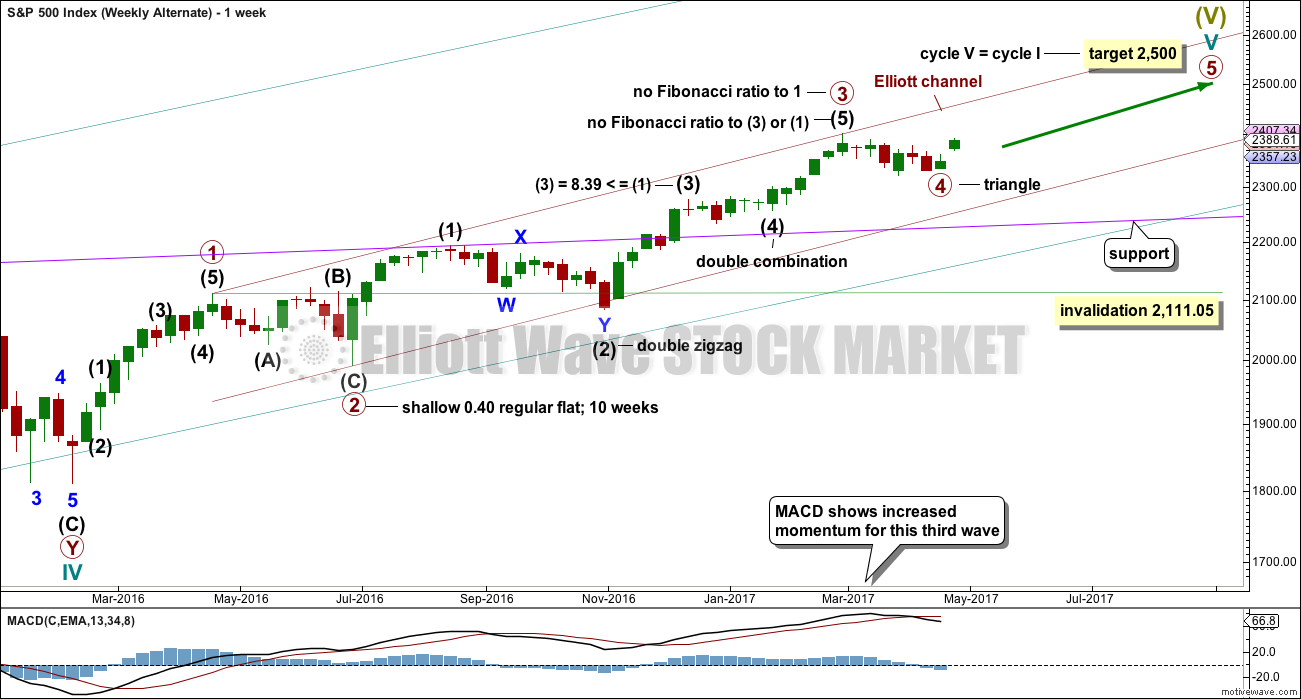
WEEKLY CHART
Click chart to enlarge.
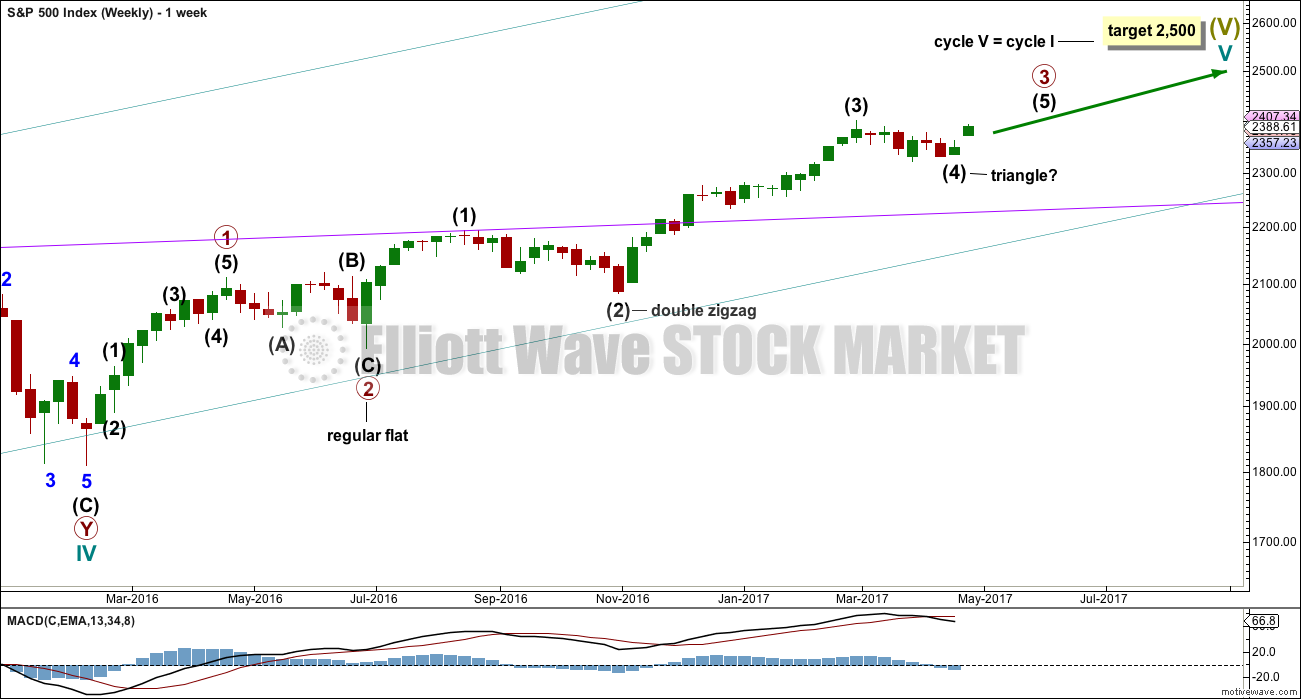
This is now the new main wave count. It has a better overall look on the weekly chart and on the monthly chart also.
This wave count sees the middle of primary wave 3 a stretched out extension, which is the most typical scenario for this market.
Primary wave 3 may be incomplete. A target is now calculated for it on the daily chart.
There is alternation within primary wave 3 impulse, between the double zigzag of intermediate wave (2) and the possible triangle of intermediate wave (4).
When primary wave 3 is a complete impulse, then a large correction would be expected for primary wave 4. This may be shallow.
Thereafter, primary wave 5 may be expected to be relatively short, ending about the final target at 2,500.
DAILY CHART
Click chart to enlarge.
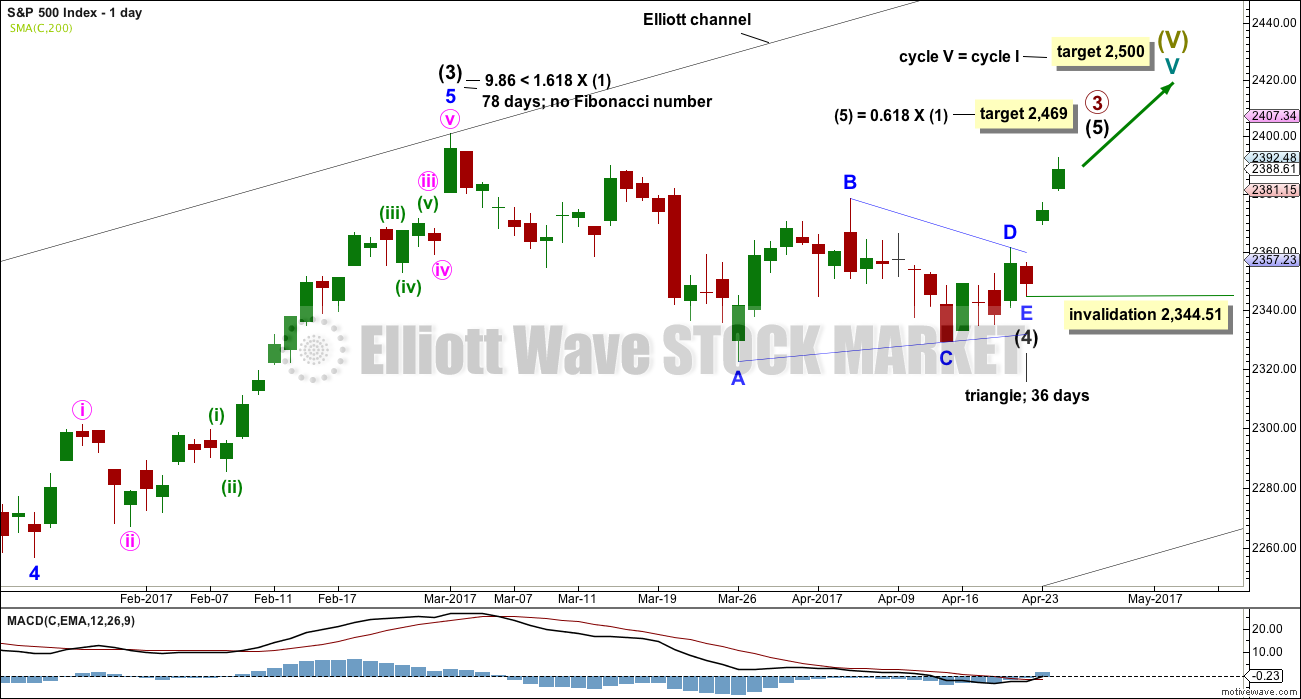
Primary wave (4) may be a complete regular contracting triangle. It may have come to a surprisingly swift end with a very brief E wave.
There is already a Fibonacci ratio between intermediate waves (3) and (1). This makes it a little less likely that intermediate wave (5) will exhibit a Fibonacci ratio to either of intermediate waves (1) or (3); the S&P often exhibits a Fibonacci ratio between two of its three actionary waves but does not between all three.
Within intermediate wave (5), no second wave correction may move beyond the start of its first wave below 2,344.51.
HOURLY CHART
Click chart to enlarge.
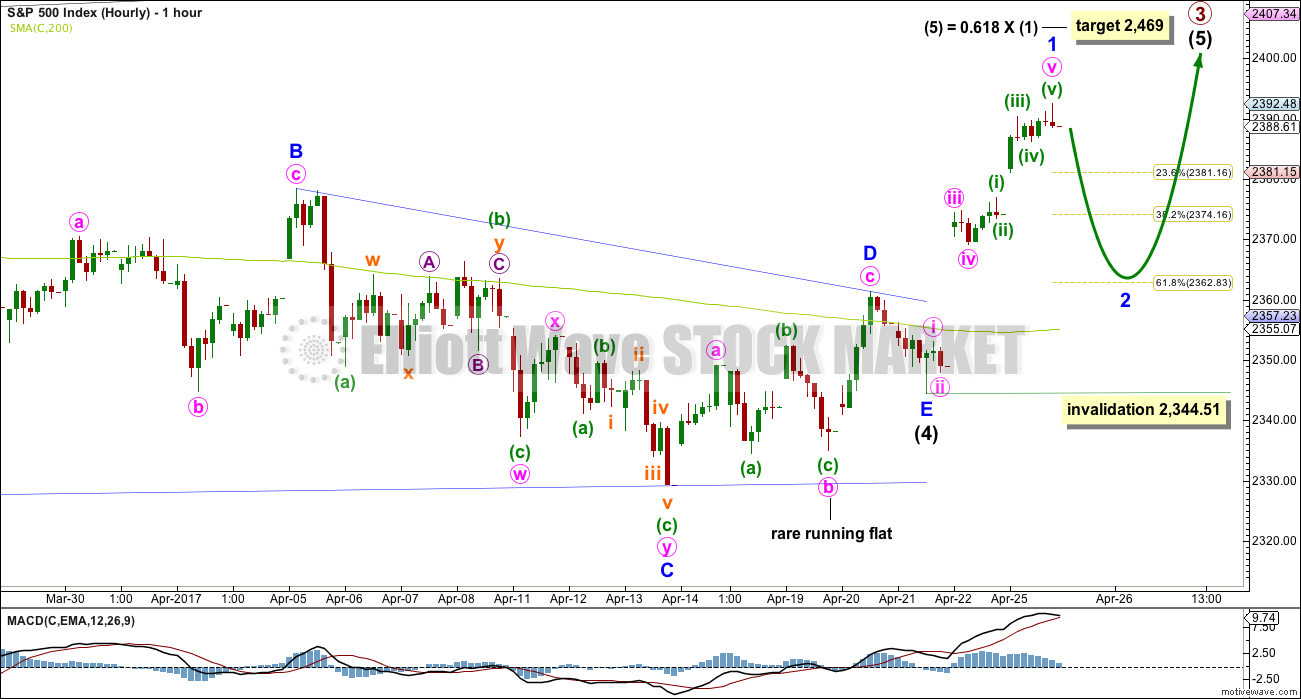
The triangle may have come to a surprisingly quick end. Triangles normally take their time, so this quick end does slightly reduce the probability of this first wave count. The rare running flat within minor wave D also slightly reduces the probability. For these reasons an alternate is provided below.
If the triangle is over, then the next wave up has begun. A five up may be complete. A three down should follow.
Although minor wave 2 is indicated to end about the 0.618 Fibonacci ratio, be warned that in the early stages of a new trend for this market the initial second wave corrections are often surprisingly shallow and brief. If some correction unfolds over the next day or two, then it should be used as an opportunity to join the upwards trend, even if it results in only a shallow correction.
Minor wave 2 may not move beyond the start of minor wave 1 below 2,344.51.
If price does make a new low below 2,344.51, then the alternate below shall be used.
ALTERNATE DAILY CHART
Click chart to enlarge.
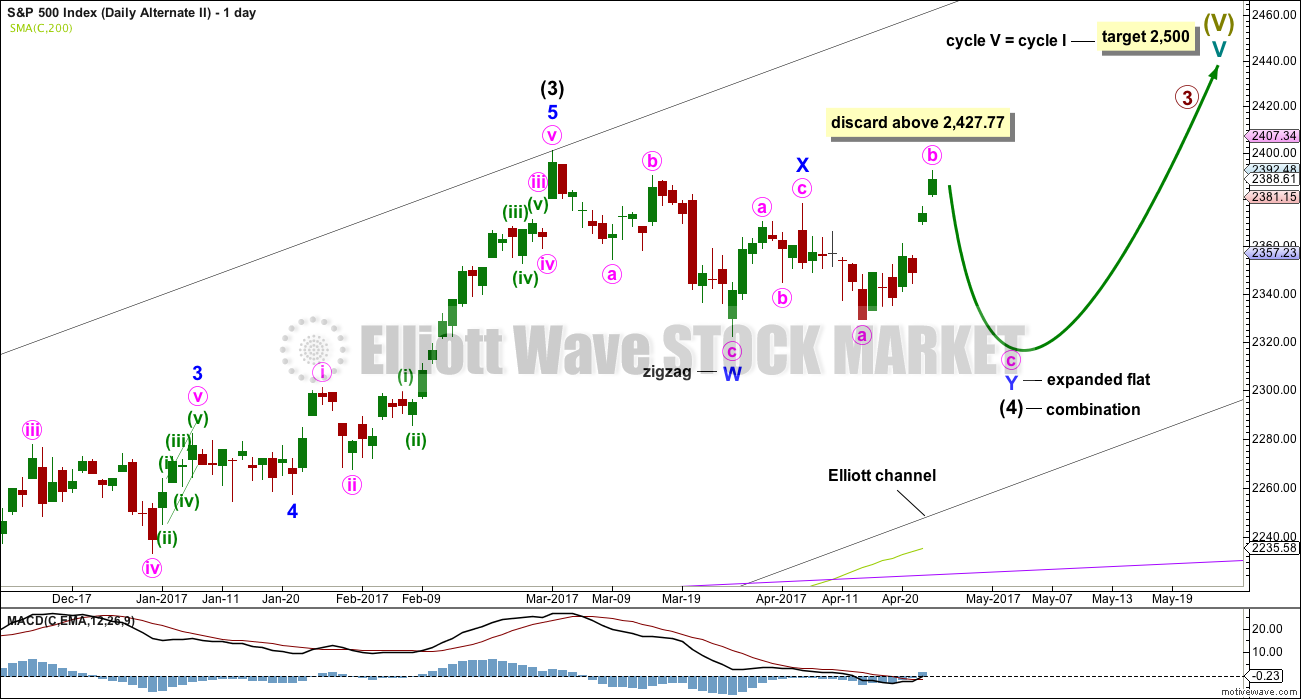
What if intermediate wave (4) was not a complete triangle but is still unfolding as a double combination?
Double combinations are very common structures. This would still provide perfect alternation in structure with the double zigzag of intermediate wave (2). Although double zigzags and double combinations are both labelled W-X-Y, they are very different structures and belong to different groups of corrections.
The purpose of combinations is the same as triangles, to take up time an move price sideways. Intermediate wave (2) lasted 58 days. So far intermediate wave (4) has lasted 38 days. If it continues for another two or three weeks, it would still have excellent proportion with intermediate wave (2).
Although this wave count actually has a better look than the main wave count, it does not have support today from classic technical analysis. For this reason it will be published as an alternate with a lower probability.
ALTERNATE HOURLY CHART
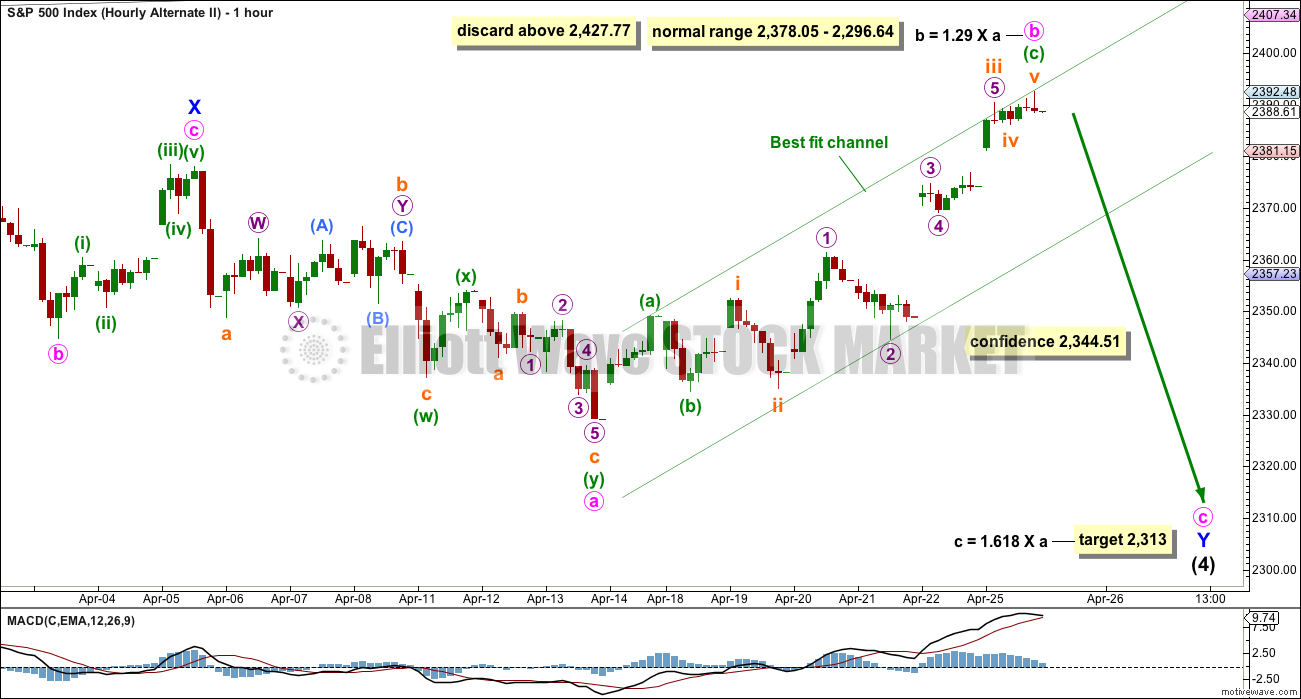
Click chart to enlarge.
The problem of the running flat seen on the main hourly chart is here resolved.
The second structure of the combination may be an expanded flat labelled minor wave Y. There is no rule regarding the maximum length of B waves within flats, but there is an Elliott wave convention that states when the potential B wave reaches twice the length of the A wave the idea of a flat should be discarded based upon a very low probability. That price point would be at 2,427.77.
The most common Fibonacci ratio is used to calculate a target for minute wave c. If minute wave b moves higher, then this target must be moved correspondingly higher.
A best fit channel is used to contain minute wave b. If this channel is breached by downwards movement, it would be indicating that minute wave b is over and minute wave c is then underway.
ALTERNATE WEEKLY CHART
Click chart to enlarge.
It is still possible that the recent correction is one degree higher, that it may be primary wave 4.
Primary wave 4 may be either over as a regular contracting triangle, or it may still continue further sideways as a double combination. Both ideas fit this weekly alternate in exactly the same way as the main wave count above.
This wave count would now expect primary wave 5 has begun to see a final wave up to the final target with no particularly large corrections along the way.
This weekly wave count will no longer be published daily. It will be followed and published again if it diverges with the main wave count.
TECHNICAL ANALYSIS
WEEKLY CHART
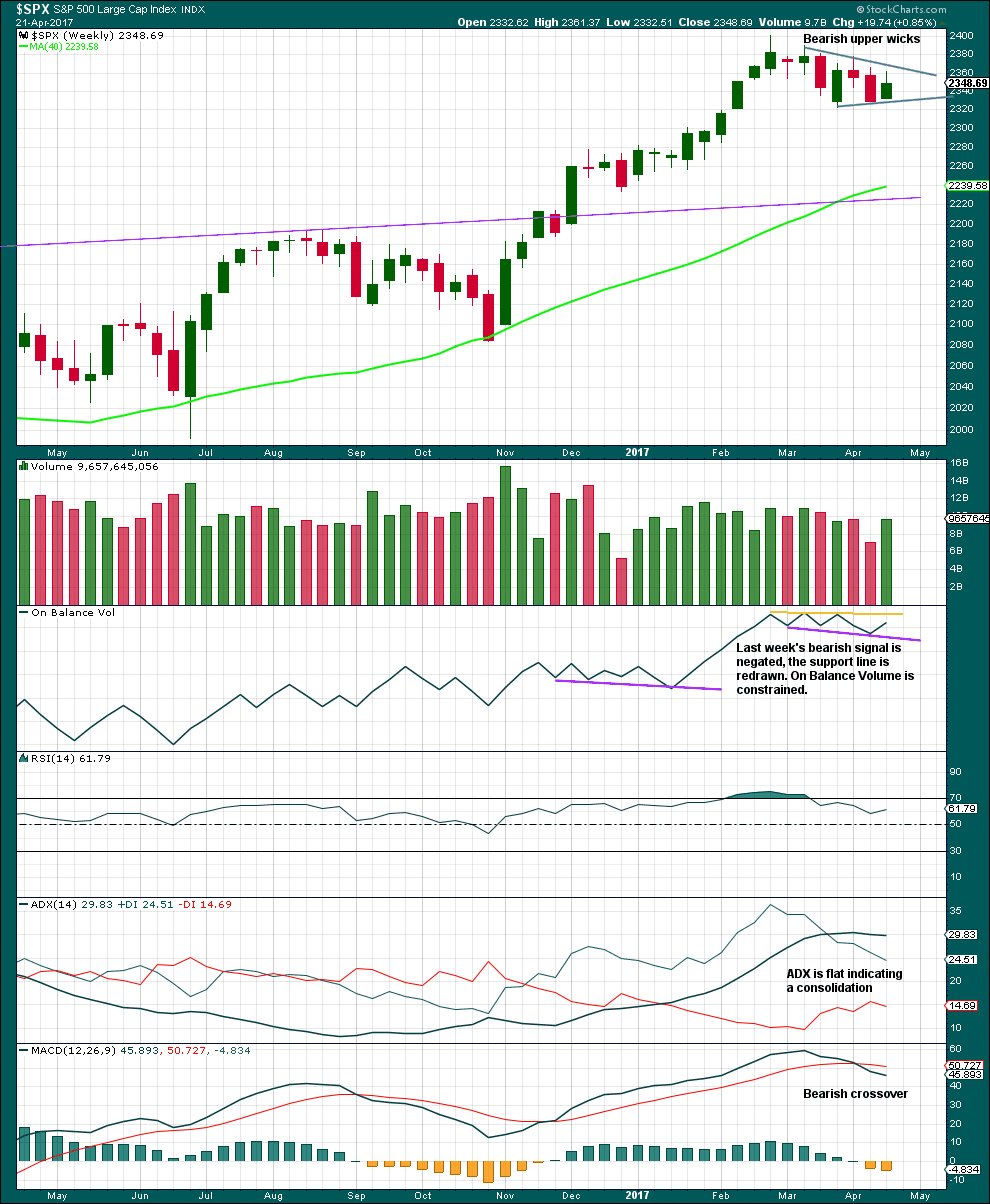
Click chart to enlarge. Chart courtesy of StockCharts.com.
An upwards week has stronger volume, but the bearish wicks of the last two candlesticks indicate more downwards movement.
On Balance Volume is constrained between support and resistance.
ADX indicates a consolidation. This supports the triangle.
RSI is neutral and MACD is bearish.
DAILY CHART
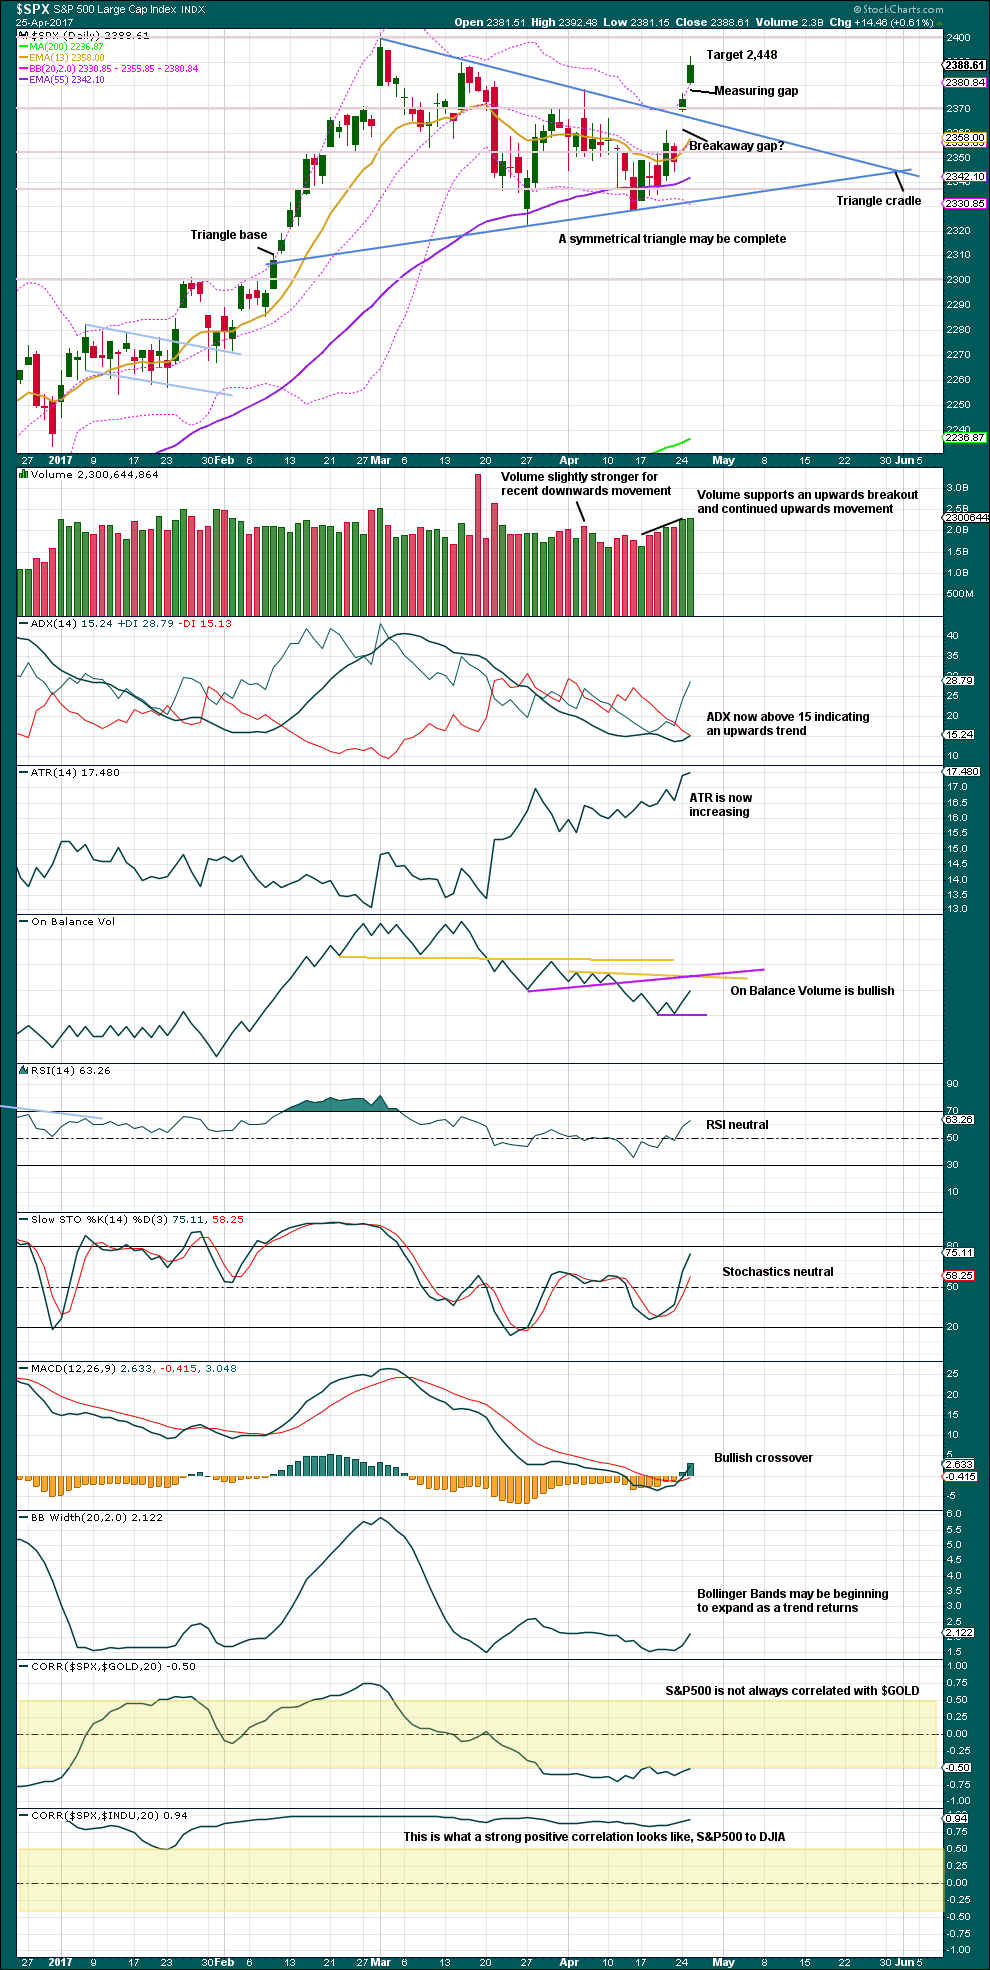
Click chart to enlarge. Chart courtesy of StockCharts.com.
With another upwards day coming with a further increase in volume, it looks more likely today that the breakout is true and the upwards trend has resumed.
This possible breakout looks to have come about 64% of the distance from base to cradle. Highest percentage performance following triangle breakouts come from breakouts generally around 60%-70% of this distance.
Volume, ATR, ADX, On Balance Volume, MACD, and Bollinger Bands are bullish today.
Price has closed above the upper edge of Bollinger Bands. This does not mean that tomorrow price must return to within Bollinger Bands. Price may remain extreme for several days when this market is in a strong trend.
The target is calculated from adding the vertical difference between the initial upper and lower triangle reversal points (78.73 points) to the breakout point, taken at today’s low.
Throwbacks to support after an upwards breakout from a symmetrical triangle occur only 37% of the time, so it would not be wise to expect price to show a deep pullback here.
Use gaps for trailing stops on long positions. Stops may now be set at the lower edge of the measuring gap. If this is a measuring gap and not an exhaustion gap, then it may not be filled for some time.
Always use a stop. Do not invest more than 1-5% of equity on any one trade.
VOLATILITY – INVERTED VIX CHART
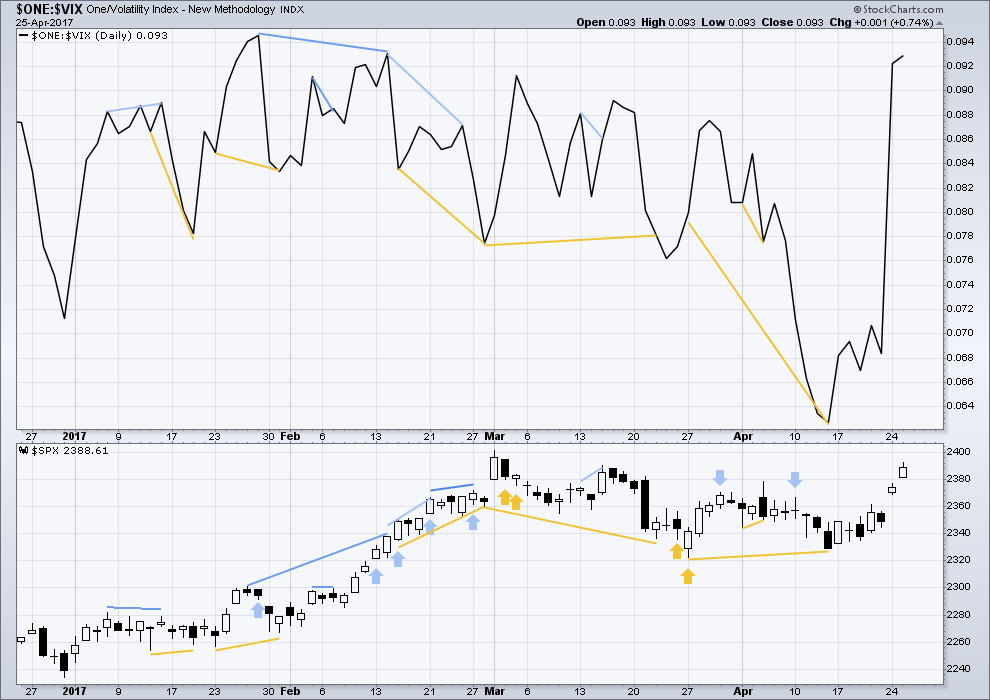
Click chart to enlarge. Chart courtesy of StockCharts.com.
Normally, volatility should decline as price moves higher and increase as price moves lower. This means that normally inverted VIX should move in the same direction as price.
It is noted that there are now six multi day instances of bullish divergence between price and inverted VIX, and all have been followed so far by at least one upwards day if not more. This signal seems to again be working more often than not. It will again be given some weight in analysis.
There is no new divergence today between price and inverted VIX.
BREADTH – AD LINE
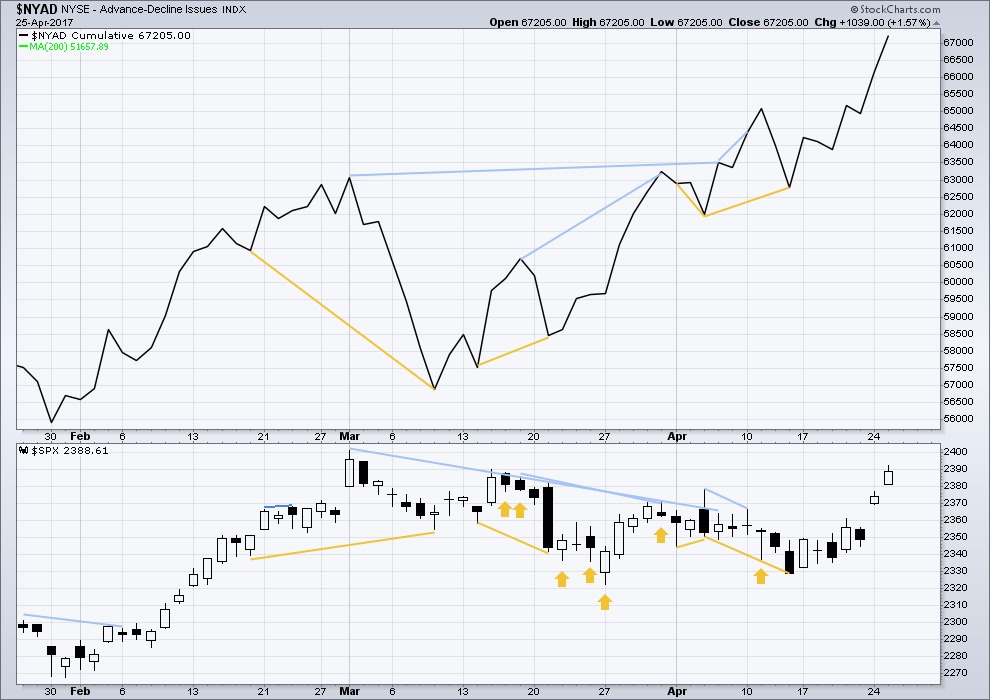
Click chart to enlarge. Chart courtesy of StockCharts.com.
The rise in price has support from a rise in market breadth. Lowry’s measures of market breadth do not at this stage warn of an impending end to this bull market. They show an internally healthy bull market that should continue for at least 4-6 months.
No new divergence is noted today between price and the AD line. There is still longer term bearish divergence, but this has not proven reliable lately, so it will not be considered.
DOW THEORY
The DJIA, DJT, S&P500 and Nasdaq continue to make new all time highs. This confirms a bull market continues.
The following lows need to be exceeded for Dow Theory to confirm the end of the bull market and a change to a bear market:
DJIA: 17,883.56.
DJT: 7,029.41.
S&P500: 2,083.79.
Nasdaq: 5,034.41.
Charts showing each prior major swing low used for Dow Theory are here.
This analysis is published @ 11:11 p.m. EST.
If that gap offers support, as it should if it’s a measuring gap, then minor 2 may end close to 2,378.
If the gap is closed then it’s an exhaustion gap and look for minor 2 to end close to the 0.618 Fibonacci ratio.
truncated intermediate 5 high?
Sure looking toppy. The move out of that triangle was the strangest I have ever seen. It was almost as if the bulls could not wait for it to complete before jumping on the long trade in anticipation. Triangles are penultimate moves and the kind of cavorting above upper BBs we are seeing on so many charts would ordinarily be and invitation to short like there is no tomorrow, but lately price has been enjoying extended stays in that rarefied air….
I’m baffled; breadth and transports are giving warning signs again and then the collapse of Home Capital, US Steel and Seagate are interesting as well.
Baffling times indeed my friend. Trader Bob Kudla says when this market finally collapses it could drop 30% in a week…
I would love the opportunity to buy good companies a fair/attractive valuations again
Me too. I hope it’s not too far away.
I hear ya. The only companies I have been snapping up are the streaming miners. I cannot believe what some of them have been selling for these days. Of course there is so much bearishness in the miners arena these days one has to have a longer term horizon. Considering what is ultimately in the dollar’s future, longer term is fine by me!
hey,, guess what
Nice one Doc 🙂