
Upwards movement was expected.
Summary: Bottom line: a new low below 2,050.37 would confirm an end to a bear market rally and a primary degree third wave down. Before that happens price may move higher all the way up to the all time high at 2,134.72, but not above if the preferred bear wave count is correct.
Trading advice (not intended for more experienced members): Any short positions holding on should be positive within a very few days. Any new shorts entered here should risk no more than 3-5% of equity and must use a stop loss.
Stops (and risk) for new positions must be just above 2,134.72.
Last published monthly charts are here.
New updates to this analysis are in bold.
BEAR ELLIOTT WAVE COUNT
WEEKLY CHART
Click chart to enlarge.
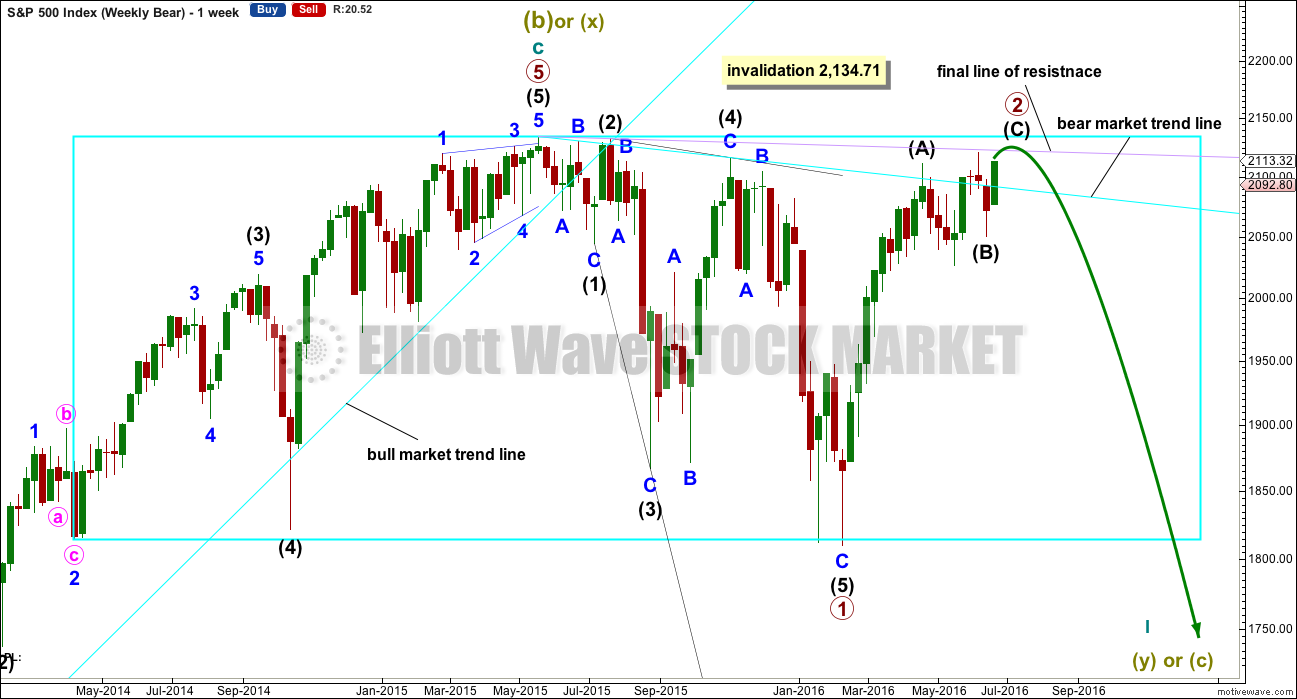
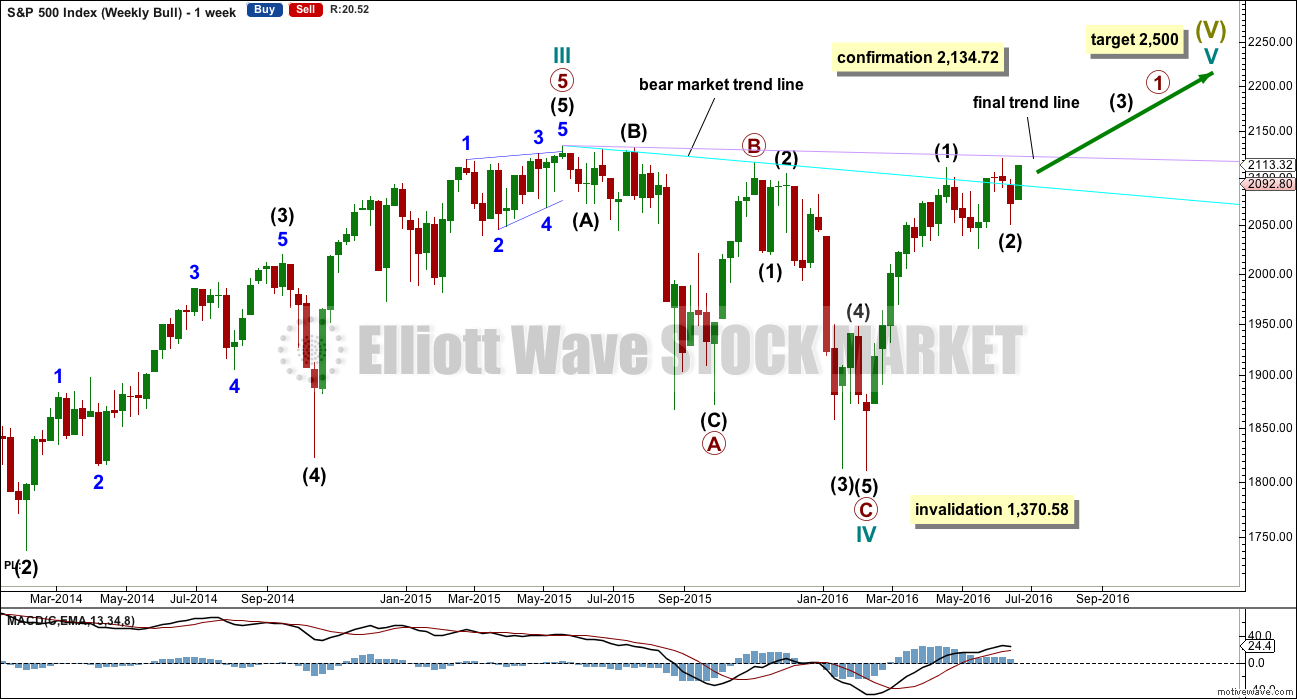
The box is added to the weekly chart. Price has been range bound for months. A breakout will eventually happen. The S&P often forms slow rounding tops, and this looks like what is happening here at a monthly / weekly time frame.
Primary wave 1 is seen as complete as a leading expanding diagonal. Primary wave 2 would be expected to be complete here or very soon indeed.
Leading diagonals are not rare, but they are not very common either. Leading diagonals are more often contracting than expanding. This wave count does not rely on a rare structure, but leading expanding diagonals are not common structures either.
Leading diagonals require sub waves 2 and 4 to be zigzags. Sub waves 1, 3 and 5 are most commonly zigzags but sometimes may appear to be impulses. In this case all subdivisions fit perfectly as zigzags and look like threes on the weekly and daily charts. There are no truncations and no rare structures in this wave count.
The fourth wave must overlap first wave price territory within a diagonal. It may not move beyond the end of the second wave.
Leading diagonals in first wave positions are often followed by very deep second wave corrections. Primary wave 2 would be the most common structure for a second wave, a zigzag, and fits the description of very deep. It may not move beyond the start of primary wave 1 above 2,134.72.
So far it looks like price is finding resistance at the lilac trend line. Price has not managed to break above it.
DAILY CHART
Click chart to enlarge.
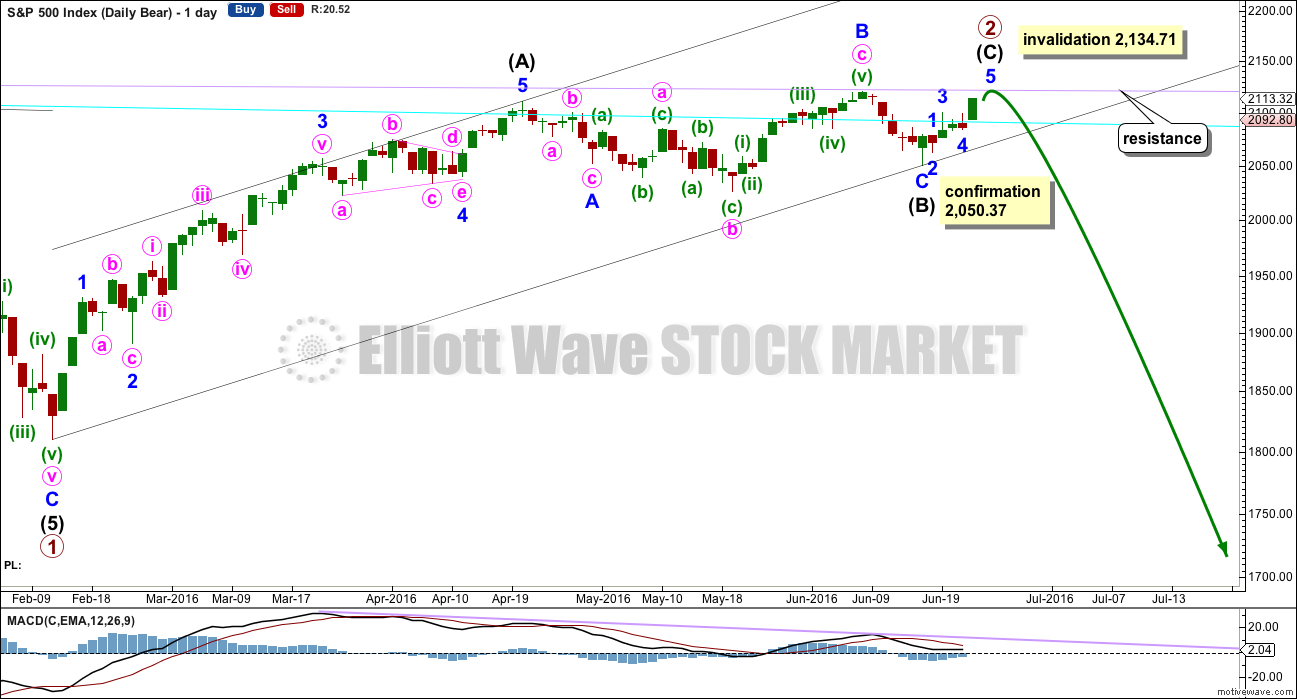
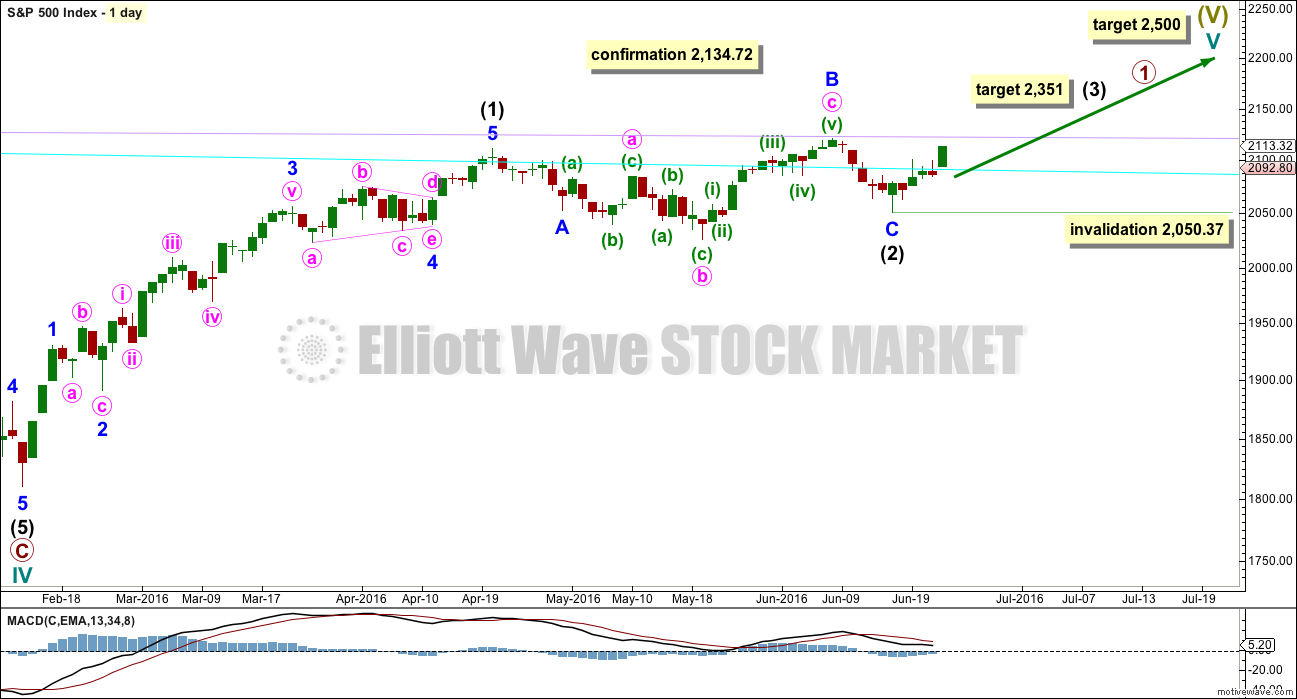
Primary wave 2 is relabelled. Intermediate wave (B) within it may have been more time consuming than previously expected. It subdivides as an expanded flat, minor wave B is a 1.16 correction of minor wave A and there is no Fibonacci ratio between minor waves A and C. Minor wave C ends slightly below the end of minor wave A avoiding a truncation.
If price moves any higher when markets open tomorrow (and price moved higher during after hours trading) then it should stop when the final line of resistance, the lilac trend line is touched.
The most common structure for a second wave correction is a zigzag.
Draw a channel about primary wave 2 using Elliott’s technique for a correction: draw the first trend line from the start of the zigzag, then a parallel copy on the end of intermediate wave (A).
A new low below 2,050.37 now would provide price confirmation of a trend change. At that stage, downwards movement could not be a second wave correction within intermediate wave (C) and so intermediate wave (C) would have to be over.
Primary wave 2 may not move beyond the start of primary wave 1 above 2,134.71.
MAIN HOURLY CHART
Click chart to enlarge.
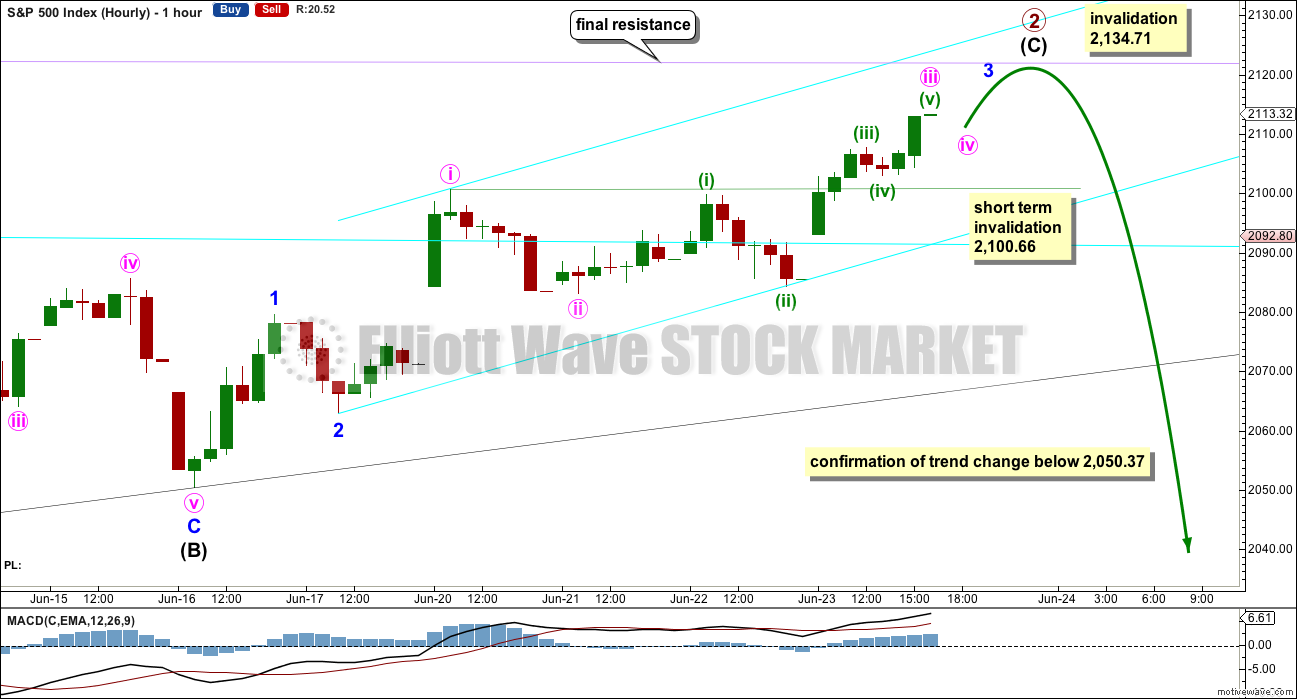
Intermediate wave (C) must subdivide as a five wave structure. It looks like an impulse and not a diagonal.
I have two ways to label this movement today. Both expect it is close to completion. If it continues higher then the lilac trend line would be the best way to tell when upwards movement is over, better than a target.
Minor wave 3 may be extending. Within the extension minute wave iv may not move into minute wave i price territory below 2,100.66. Within the extension minute wave iii is shorter than minute wave i and has no Fibonacci ratio to minute wave i.
Within minute wave iii minuette wave (iii) has no Fibonacci ratio to minuette wave (i). If minuette wave (v) is over there then it is just 0.03 longer than 0.618 the length of minuette wave (i).
A new low at any stage below 2,050.37 would provide confirmation of a trend change.
ALTERNATE HOURLY CHART
Click chart to enlarge.
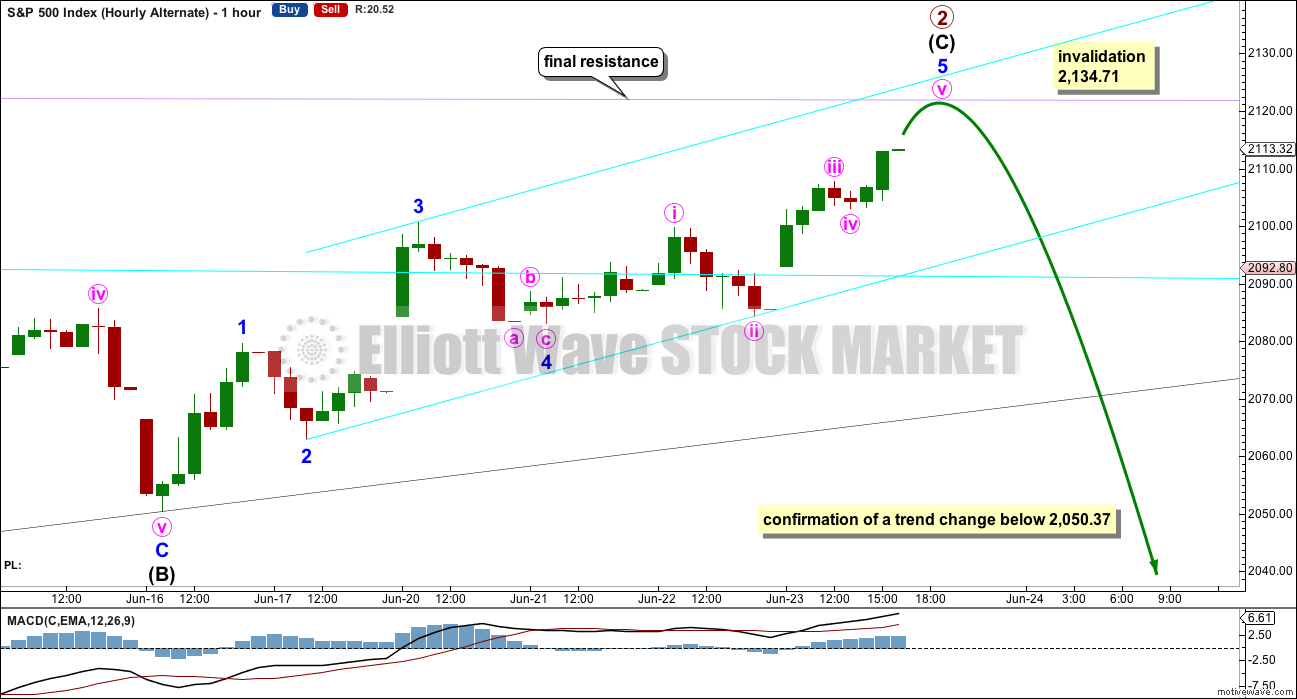
Minor wave 5 may have been extended. Here minor wave 3 is longer than minor wave 1 but there is no Fibonacci ratio between them.
Within minor wave 5 there is no Fibonacci ratio between minute waves i and iii, and minute wave i may be over. If it is then it would be just 0.03 longer than 0.618 the length of minute wave i. If minute wave v continues higher then it should end when price touches the lilac trend line.
The confirmation point is the same on all charts for the same reason. A new low below 2,050.37 could not be a second wave correction within intermediate wave (C) and so at that stage intermediate wave (C) would have to be over.
BULL ELLIOTT WAVE COUNT
WEEKLY CHART
Click chart to enlarge.
Cycle wave IV is seen as a complete flat correction. Within cycle wave IV, primary wave C is still seen as a five wave impulse.
Intermediate wave (3) has a strong three wave look to it on the weekly and daily charts. For the S&P, a large wave like this one at intermediate degree should look like an impulse at higher time frames. The three wave look substantially reduces the probability of this wave count. Subdivisions have been checked on the hourly chart, which will fit.
Cycle wave II was a shallow 0.41 zigzag lasting three months. Cycle wave IV may be a complete shallow 0.19 regular flat correction, exhibiting some alternation with cycle wave II and lasting nine months. Cycle wave IV would be grossly disproportionate to cycle wave II, and would have to move substantially out of a trend channel on the monthly chart, for it to continue further sideways as a double flat, triangle or combination. For this reason, although it is possible, it looks less likely that cycle wave IV would continue further. It should be over at the low as labelled.
At 2,500 cycle wave V would reach equality in length with cycle wave I.
Price has now broken a little above the bear market trend line. This line is drawn from the all time high at 2,134.72 to the swing high labelled primary wave B at 2,116.48 on November 2015. This line is drawn using the approach outlined by Magee in the classic “Technical Analysis of Stock Trends”. To use it correctly we should assume that a bear market remains intact until this line is breached by a close of 3% or more of market value. Now that the line is breached, the price point at which it is breached is calculated about 2,093.58. 3% of market value above this line would be 2,156.38, which would be above the all time high and the confirmation point.
This wave count requires price confirmation with a new all time high above 2,134.72.
While price has not made a new high, while it remains below the final trend line (lilac) and while technical indicators point to weakness in upwards movement, this very bullish wave count comes with a strong caveat. I still do not have confidence in it. It is produced as an alternate, because all possibilities must be considered. Price managed to keep making new highs for years on light and declining volume, so it is possible that this pattern may continue to new all time highs for cycle wave V.
The invalidation point will remain on the weekly chart at 1,370.58. Cycle wave IV may not move into cycle wave I price territory.
This invalidation point allows for the possibility that cycle wave IV may not be complete and may continue sideways for another one to two years as a double flat or double combination. Because both double flats and double combinations are both sideways movements, a new low substantially below the end of primary wave C at 1,810.10 should see this wave count discarded on the basis of a very low probability long before price makes a new low below 1,370.58.
DAILY CHART
Click chart to enlarge.
Intermediate wave (2) may have been a remarkably shallow zigzag which is complete. Intermediate wave (3) upwards may have begun and would reach equality in length with intermediate wave (1) at 2,351. If this wave count is confirmed by a new all time high then it would be the only wave count and more upwards movement would be expected for a third wave.
The shallow correction of intermediate wave (2) reduces the probability of this wave count. Normally within a bull market the first second wave correction is very deep.
Within intermediate wave (3) no second wave correction may move beyond the start of its first wave below 2,050.37.
TECHNICAL ANALYSIS
WEEKLY CHART
Click chart to enlarge. Chart courtesy of StockCharts.com.
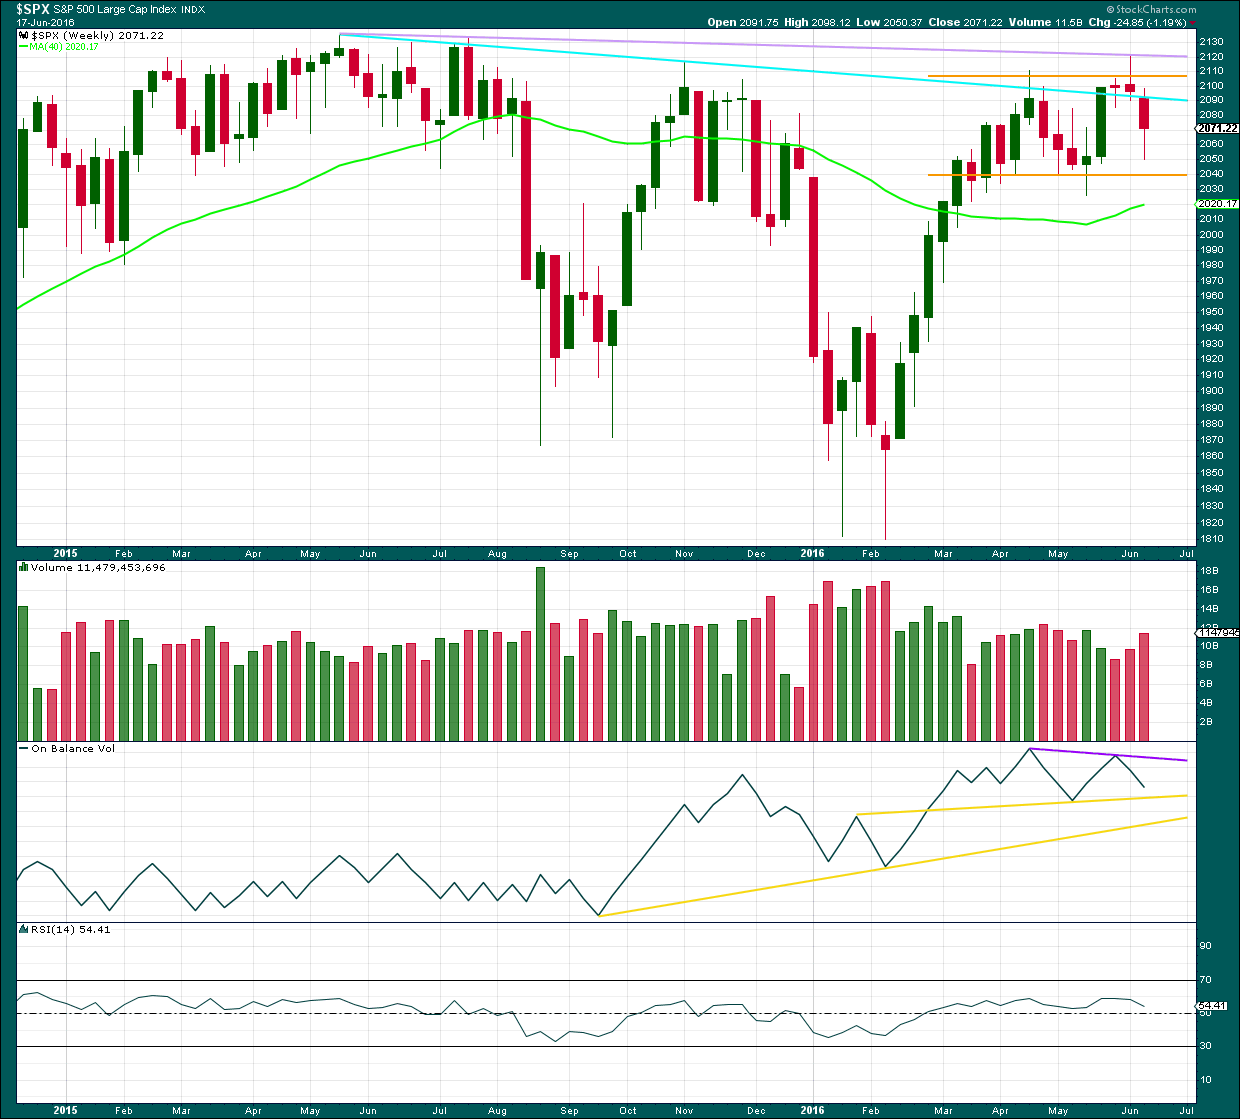
The reversal implication of the shooting star candlestick pattern for last week is now confirmed by a strong red weekly candlestick which gapped down. This week’s candlestick pattern may be considered to have completed an Evening Doji Star pattern, albeit with two doji at the high.
Along the way down, price may find some support about 2,040.
Upwards movement made an important new high last week but could not manage to break above the final lilac line of resistance. That line remains intact and is now strengthened.
Volume has increased for a downwards week, but as this includes an options expiry date it should not be considered as definitive. Volume for the two downwards weeks prior also showed some increase, although volume was light. It looks like so far the market may be falling of its own weight; selling pressure is light. If selling pressure increases, then look out for a strong increase in downwards momentum.
On Balance Volume trend lines are redrawn this week: support in yellow and resistance in purple. OBV would allow for a little further downwards movement before it finds support at the first yellow line. This may indicate where a bounce may turn up.
DAILY CHART
Click chart to enlarge. Chart courtesy of StockCharts.com.
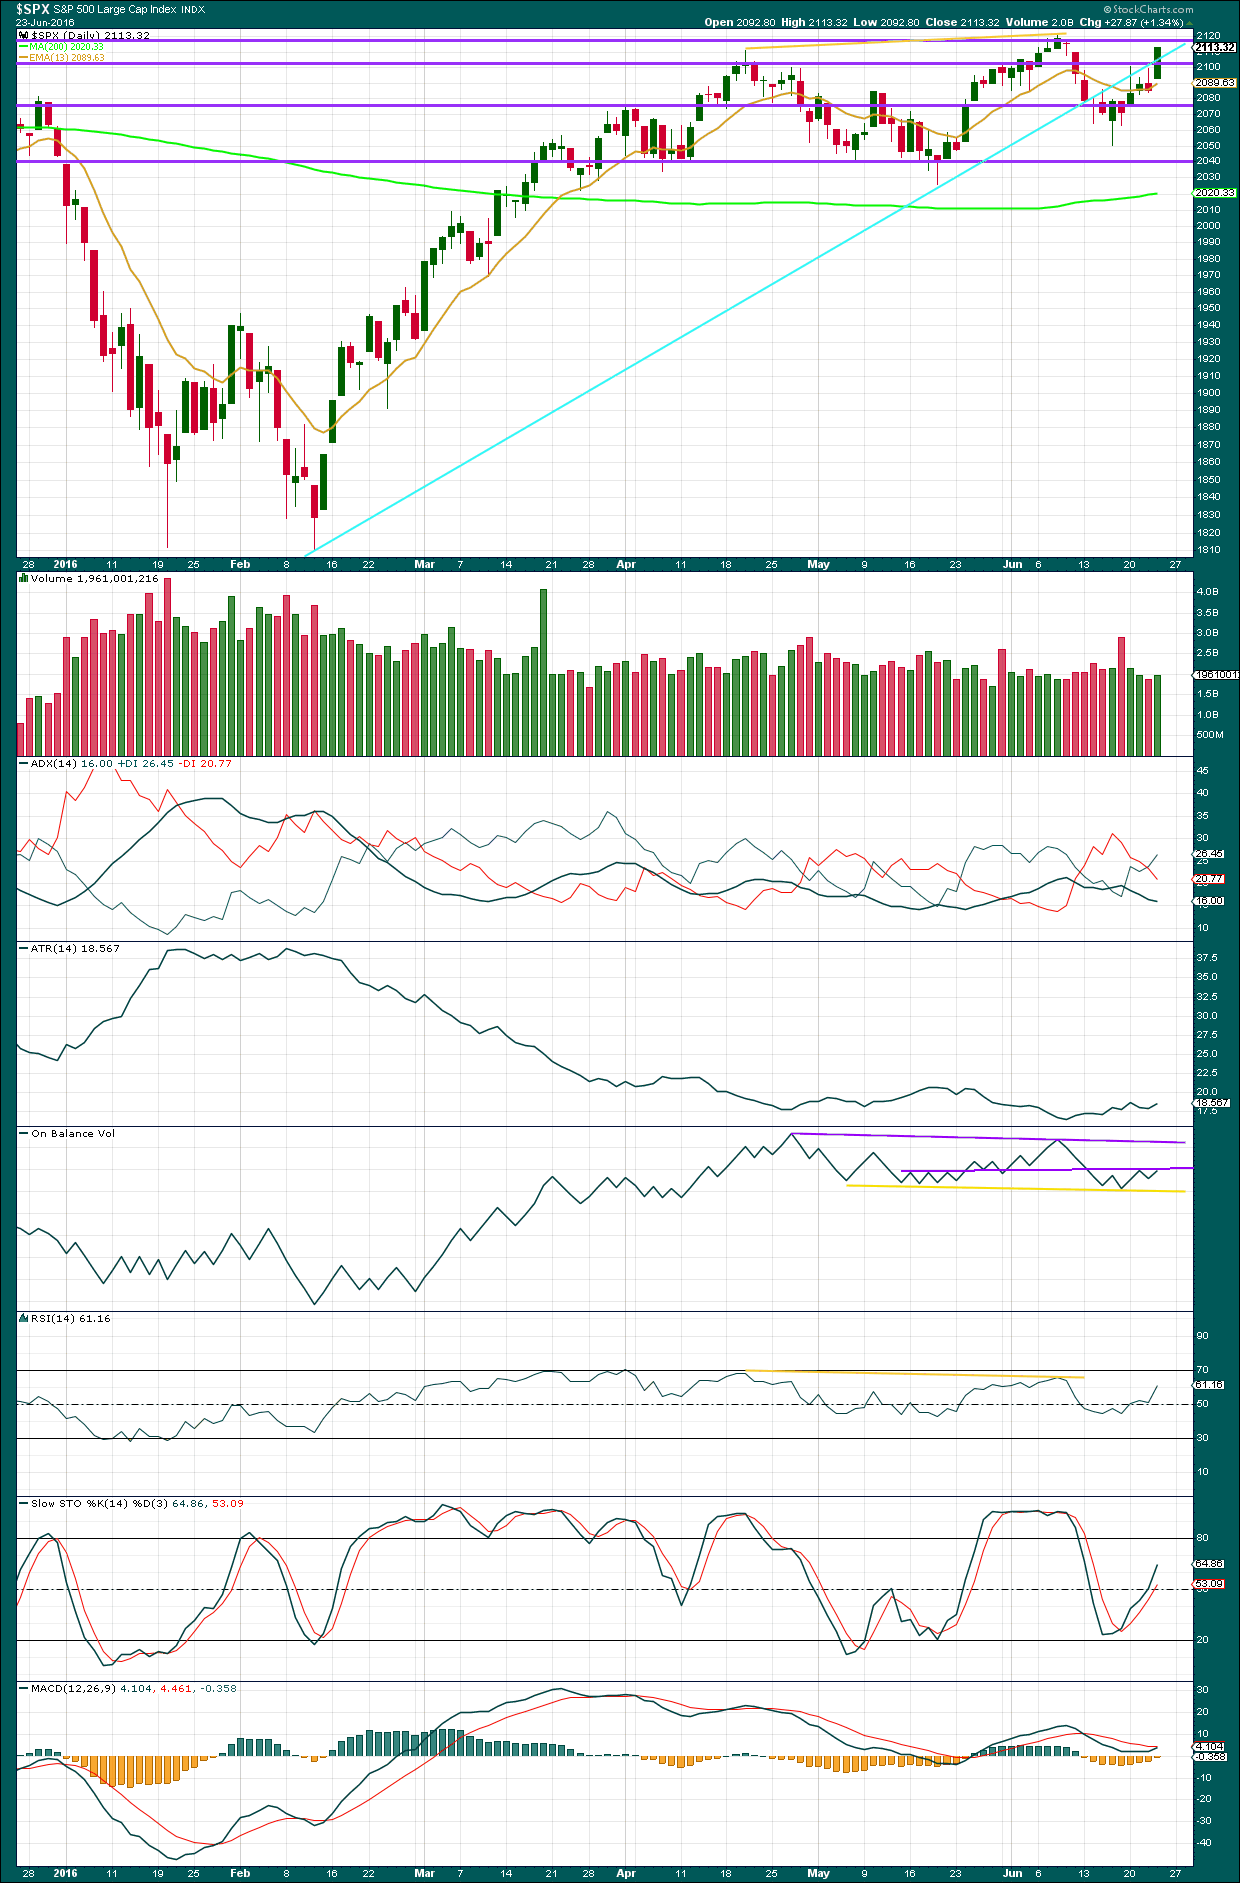
Volume data on StockCharts is different to that given from NYSE, the home of this index. Comments on volume will be based on NYSE volume data when it differs from StockCharts.
A strong upwards day comes with relatively light volume, only slightly higher than the last upwards day and lighter than the day before that. Overall as price is moving higher volume is declining. There is not enough support for the rise in price for it to be sustainable. It should be expected therefore to see price find resistance at the next horizontal line about 2,120. The next line of resistance above that would be a final line if resistance from the all time high at 2,134.
ADX is declining indicating the market is not trending. Today it indicates a possible trend change from down to up with the +DX line crossing over the -DX line.
ATR today may be slightly increasing, but one day does not give enough confidence. Overall it is flat.
On Balance Volume today has come up to touch resistance at the first purple line. A move down from here tomorrow would reinforce the strength of that line and give a bearish signal. A break above this line would give a bullish signal.
RSI is not overbought, there is room for price to rise further. It exhibits no divergence to indicate weakness.
Stochastics is not overbought, there is room for price to rise further. It too exhibits no divergence yet with price to indicate weakness.
VOLATILITY – INVERTED VIX MONTHLY CHART
Click chart to enlarge. Chart courtesy of StockCharts.com.
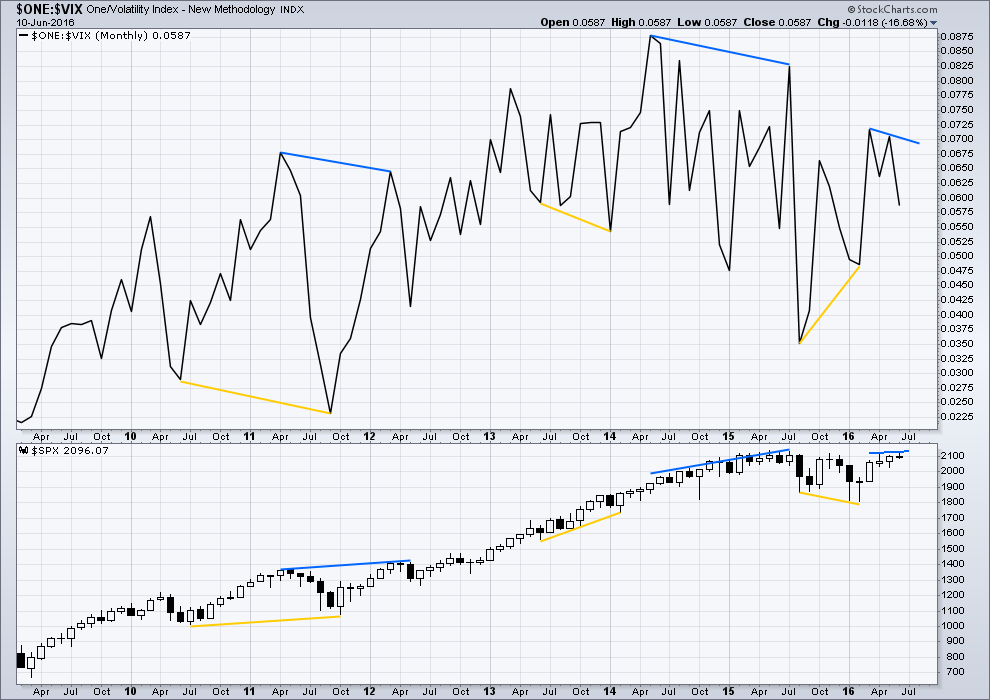
Several instances of large divergence between price and VIX (inverted) are noted here. Blue is bearish divergence and yellow is bullish divergence (rather than red and green, for our colour blind members).
Volatility declines as inverted VIX rises, which is normal for a bull market. Volatility increases as inverted VIX declines, which is normal for a bear market. Each time there is strong multi month divergence between price and VIX, it was followed by a strong movement from price: bearish divergence was followed by a fall in price and bullish divergence was followed by a rise in price.
There is still current multi month divergence between price and VIX: from the high in April 2016 price has made new highs in the last few days but VIX has failed so far to follow with new highs. This regular bearish divergence still indicates weakness in price.
VOLATILITY – INVERTED VIX DAILY CHART
Click chart to enlarge. Chart courtesy of StockCharts.com.
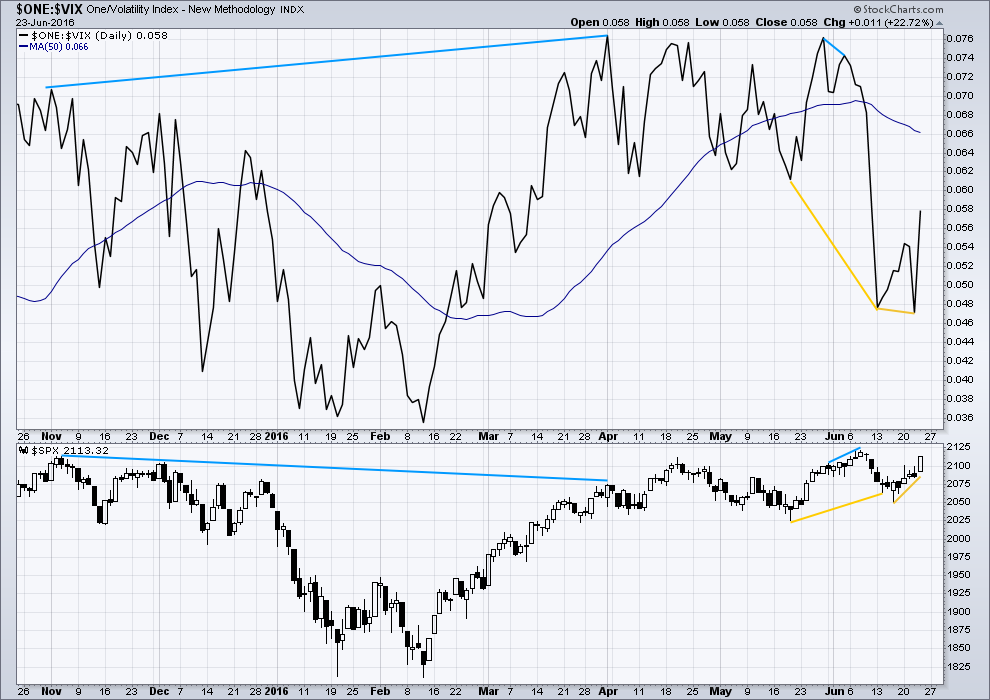
There is now only one instance of hidden bearish divergence noted on this daily chart of price and VIX (blue lines). VIX makes higher highs as price makes lower highs. The decline in volatility is not matched by a corresponding rise in price. Price is weak.
VIX (inverted) has run away strongly from price. Volatility sharply increased beyond the prior point of 19th May (yellow lines) while price fell.
A divergence 101 interpretation of this is bullish. Volatility is stronger than it was on 19th of May, but this has not translated into a corresponding new low for price. Price is weak. Some upwards reaction would be a reasonable expectation about here to resolve this divergence. At this stage, it looks like that interpretation was correct as it has been followed by some upwards movement from price.
Price fell after the short term bearish divergence noted here (short blue lines). Now, after short term bullish divergence (yellow lines), price is rising.
The last two yellow lines indicate hidden bullish divergence now between price and VIX. Inverted VIX moved lower; volatility increased as price moved lower. This divergence is strong. It is just possible that it may now be resolved by a strong upwards day, but it may also require a little more upwards movement for another day or two before it is resolved.
While I would not give much weight to divergence between price and many oscillators, such as Stochastics, I will give weight to divergence between price and VIX. Analysis of the monthly chart for the last year and a half shows it to be fairly reliable.
BREADTH – ADVANCE DECLINE LINE
Click chart to enlarge. Chart courtesy of StockCharts.com.
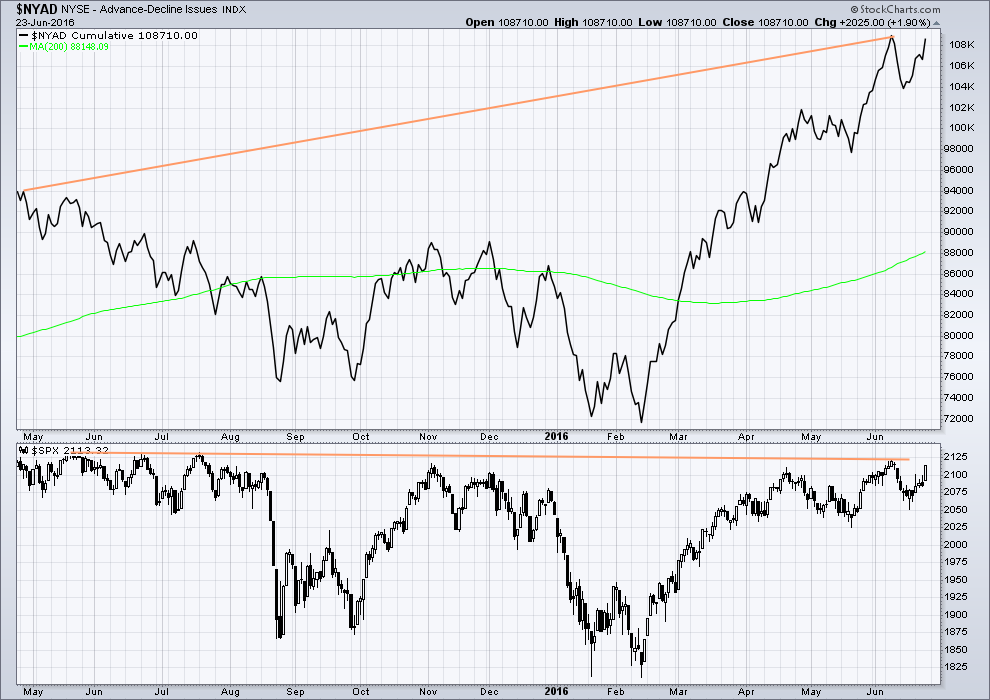
With the AD line increasing, this indicates the number of advancing stocks exceeds the number of declining stocks. This indicates that there is breadth to prior upwards movement.
Taking a look at the bigger picture back to and including the all time high on May 2015, the AD line is making substantial new highs but price so far has not. While market breadth is increasing beyond the point it was at in May 2015, this has not translated (yet) into a corresponding rise in price. Price is weak. This is hidden bearish divergence.
DOW THEORY
The last major lows within the bull market are noted below. Both the industrials and transportation indicies have closed below these price points on a daily closing basis; original Dow Theory has confirmed a bear market. By adding in the S&P500 and Nasdaq a modified Dow Theory has not confirmed a new bear market.
Within the new bear market, major highs are noted. For original Dow Theory to confirm the end of the current bear market and the start of a new bull market, the transportation index needs to confirm. It has not done so yet.
Major lows within the prior bull market:
DJIA: 15,855.12 (15th October, 2014) – closed below on 25th August, 2015.
DJT: 7,700.49 (12th October, 2014) – closed below on 24th August, 2015.
S&P500: 1,821.61 (15th October, 2014) – has not closed below this point yet.
Nasdaq: 4,117.84 (15th October, 2014) – has not closed below this point yet.
Major highs within the new bear market:
DJIA: 17,977.85 (4th November, 2015) – closed above on 18th April, 2016.
DJT: 8,358.20 (20th November, 2015) – has not closed above this point yet.
S&P500: 2,116.48 (3rd Nobember, 2015) – has now closed above this point on 8th June, 2016.
Nasdaq: 5,176.77 (2nd December, 2015) – has not closed above this point yet.
It is a reasonable conclusion that the indices are currently in a bear market. The trend remains the same until proven otherwise. Dow Theory is one of the oldest and simplest of all technical analysis methods. It is often accused of being late because it requires huge price movements to confirm a change from bull to bear. In this instance, it is interesting that so many analysts remain bullish while Dow Theory has confirmed a bear market. It is my personal opinion that Dow Theory should not be accused of being late as it seems to be ignored when it does not give the conclusion so many analysts want to see.
This analysis is published @ 11:36 p.m. EST.
What do you all make of the VIX daily candlestick? I am not sure I have ever seen anything quite like it.
Curious. It looks like an inverted shooting star. If the correlation between the January 13 VIX price action and the VIX candle we saw this past Wednesday holds, despite penetration of the upper BB, this decline is just getting underway…
The bearish case is starting to garner more attention. EWI now has a count with our old P2 top as their intermediate two of P1. Not quite as bearish though….the end may be closer than they think! Apparently they still favor the count allowing for new ATH which has us now in minuette three of minute C of a minor two down correction. It seems very strong momentum to me for minuette degree wave down. I guess we will know soon enough!
Today was the highest volume since last August 24, 2016; volatility nowhere near those levels. It appears we are just getting started…!
Right on.
I found chart from Kimble interesting;
“2007 pattern being repeated right now? Another “Push Away???””
http://blog.kimblechartingsolutions.com/2016/06/2007-pattern-being-repeated-right-now-another-push-away/?utm_source=Kimble+Charting+Solutions&utm_campaign=3071ab8cd2-Kimble_Blog_Posts_RSS5_1_2015&utm_medium=email&utm_term=0_b4b2358e39-3071ab8cd2-98987357&goal=0_b4b2358e39-3071ab8cd2-98987357
Neat looking chart. Thanks David.
Is anyone playing NUGT? I missed the initial ramp in the morning as was in a meeting and for the rest of the day it was stuck between 114-116. I want short it as early as next week.
It will get interesting as fed and central banks plan the strategy over the weekend. Too much at stake to allow it all to go down this easily. A bounce to 2,080ish might just bring the faithful into the markets fully invested.
Lara has gold in big 3rd wave up….i’d be a nervous wreck shorting NUGT
Some junior gold miners I bought have gone up 20% in a day, and I think they have a long way to run…
Okay, over and out from me. I have to drive into Whakatane and buy a power cable.
Have a happy weekend everybody! Analysis will be published later today / early tomorrow (NZ time, not normal time, us hobbits are livin’ in the future down here!)
Thanks Lara as always 🙂
You have a safe drive… and thanks for your input before you head out.
Just in case you don’t know, there are a lot of people here that are happy you’re a part of our daily grind 🙂
Is that pronounced Wha-ka-tan-ee?
Sounds Japanese!
Verne the VenUsian…. 🙂
Pronounced Fa Ka Ta Nae
Where my family and Koro resides 🙂 (my family patriarch)
I’m concerned that VIX has declined (inverted – means volatility has increased substantially) from where it was back in February.
There could be some hidden bullish divergence in VIX between Feb price lows and today.
This may be resolved by a watching-paint-dry grind up for a second wave correction
chart – long yellow lines show the divergence I”m seeing
Very short term, I can see a five down complete. With the fall off the cliff the start, minute i.
For the new daily count I’m going to label this minor 1 down complete. So minor 2 up now to unfold. I think I’ll take some profits here, a rip down like that should be expecting a bounce for a correction to follow. Pending classic TA first though of course, which I can’t do yet as StockCharts data isn’t finalised.
Now my conundrum this morning is do I go with my new daily wave count which sees P2 over at the last high, or the one that up until yesterday saw it over earlier?
It makes a difference to the wave count by a huge amount!
Much thinking to do…. and battery running low.
So here’s targets for you: for P3
For both ideas intermediate (C) is going to be a lot shorter than intermediate (A).
Volume and momentum aren’t going to be of much help here.
I think I’ll have to run each side by side…. and when they diverge price will tell us which one is correct.
If using futures data then only this one can work. But I’m not using futures data am I. I’m using cash data from the exchange. I’ll be having a think about whether or not that should matter…. while I drive into Whakatane and buy a power cable for my laptop.
VIX index blue line, 2 hour SPX chart
If it is any help Lara, this would be the kind of price action we would expect coming off a P2 top.
This is the one I want P3 and have been waiting for. But the market doesn’t care what I want.
Have a Great Weekend All!
how many weeks do you envision to 1st and 2nd target?
The bears ended the day by slapping the bulls one more time.
breaking the channel to the upside on 5min chart
head fake, coming right back down
Flagging into a BB squeeze, looks like we’re going up.
Now down.
Anyone want to share their thoughts on the wave count?
Ah, I see Lara is here 🙂
I think we should all stand (where ever you are) and give Lara a round of applause for being a steely eyed missile woman. Some of the most courageous and detailed EW analysis anywhere.
Looking forward to Margin Call Monday!
AAAAAHHHHHHHH!!
You got it with a dance!
Thanks Rodney
One enthusiastic standing ovation delivered for the steely-eyed missile woman of EW!
Lets not get too giddy… need to break below both 2025 and 2000 and accelerate lower when 2000 is broken.
Or this is all for NOT! For a while anyway.
I am pissed off that this is Russell rebalancing day… It’s distorting the sell off. Acting as a cushion… IMO.
Were you long the market?
*blushing*
Why, thank you very much 🙂 So nice to have happy members. I wish every day could be as profitable
It is – provided we learn from our mistakes! 🙂
Indeed Verne! That is my most important rule. Learn From Mistakes.
Does anyone have any volume data?
Volume will be distorted due to the Russell Rebalancing.
Really would be nice to take out 2025.91 today… Let’s do the dance!
Will it help? If so, I’ll start dancing.
Gary…Rodney, Peter…i have a question/favor….can you look at the RUT and share a little what you see….? further down or most likely a rebound early next? you can also email me at jules_bassale@yahoo.com if thats too long to post here. I appreciate that
Jules – I’m undecided whether this is a 5 down ending the pattern from the high yesterday…..or if iii is starting down yet as to Gary’s chart. Personally I’m not in anything right now and will wait over the weekend. Too much risk of a gap either way for Monday morning. No matter the wave count a corrective wave 2 at some point will take place and that will be a great entry short.
All the indices look very weak to me. But that is just my eyes. I know we have watched 2050 and 2025 for a long time. I’d like 2025 to fall today. But the market doesn’t care what I would like. So I think all the indices will basically mirror one another. Dow Transports and Nasdaq seem to be leading the way again.
Finally, I must defer to to Lara.
Thanks guys! i owe you both a beer if you ever come out to Portland, OR! I was debating whether enter some bearish flys today…but I htink I will follow your advice and wait for Lara count too….waiting for the rip off rally might be a better entry….
that word again: WAIT
Rodney might take you up on that,, he lives in Nowhere, Or.
You got it. For a beer I can travel a long distance. Also, for a bear I can travel (wait) a long distance. I hope the latter wait is over!
sounds good Rodney!! You got it….
I just joined this site a few days ago and I ABSOLUTELY LOVE IT!!!! the only caveat….i mostly trade /tf and RUT but I think the waves look pretty similar….i guess
from Wisconsin….will bring some good Austrian beer
Love Wisconsin!
Me too, grew up near Chippewa falls….speaking of good beer.
This would be my take on Russell Jules..
k….i will wait then for a better entry…. 🙂
If anyone is interested on my fly strategy…u can email me too….its always cool to have other folks idea too….i have been using for 3 years and they work pretty awesome…
it is all options though
HAHA
sent email address, always interested in new ideas
It is important and significant to continued down waves that we break 2038 or so. From there we look to9 break 2025. If these happen, I would have more confidence we are going to a first target in the high 1900’s.
It would be nice to see both in this last 45 minutes today.
EW Thoughts
I really think we are in the process of convergence of social mood and asset prices. I have observed for a very long time that social mood seemed to be deep into a level of pessimism and price was staying at or near levels of optimism. The social mood near these all time highs should have been much more jubilant than what we were seeing around the world. Brexit just the most recent example. Now, like the snap back of stretched rubber band the price is synchronizing with mood. The effect of Central Bank intervention all this time merely produced this elastic gap between price and mood. Just my thoughts
Next week is QTR end so banksters can pull one of those wild ass rally to book the profits on qtrly reports. I locked profits on my short positions and if the drop continues, will pick few on the way down, not leaving profits over the weekend on the table.
has to be the 5 down, too far down for a “b” corrective. Be interesting if it a 1-2 1-2 forming downwards now….
My sentiments as well.
wait a minute, 1.25 x “a” would project a target down for “b” of 2041.75
For my eyes it is not a problem with price. Wave (b) is allowed to be up to 2 times (a) in price. But it is way to long in duration. That does not disqualify a flat, but it is not looking right. If we can break 2036 or even 2025, it helps answer this question.
It’s still within limits of an expanded flat (b) imo but is looking odd now as pointed out by Rodney. UVXY not hanging around either atm.
That said, it’s all nicely within a channel atm – would like to see it drop out of the lower channel.
you mean the channel for the SPX right? not the UVXY? cause I was just going to take the money saved for Grandma’s operation and put it all in….
Yep S&P – from todays intra day high to low (what might be a (b) wave) fits nicely into a channel – I’m waiting to see which side of it we go out of.
You might want to wait trendline confirmation or for (b) > 2 times (a) before risking all Grandma’s lolly 🙂
channel showing 2034 as a stop, when this little tiny 4th corrective up, pattern down finishes
Grandma had a good long life, hoping she won’t mind.
If we are currently in a (b) wave down, it is getting rather long in duration relative to (a) and the wave it is correcting. It is not looking quite right to me. But my eyes are not the best and today is an unusual day.
If we were to close right here (2046) the weekly and daily candles would look quite bearish especially the long upper wick on the weekly.
My thoughts at the moment….
Thank you, Gary. I am with you on this count FWIW.
Yep – that’s looking favourite to me atm.
Expect minuette w(iii) to extend..
Update: minuette wave (iii) extending
Today is the largest / longest daily candle since the rally / correction began in February. Many think that indicates the previous pattern is ended. We also broke the confirmation / confidence target of 2050.37.
If this is the 3rd wave of some larger pattern, there will be rip roaring 2nd wave corrections. That is the nature of bear markets and of increased volatility. It is a tough call.
Maybe small position so you don’t make any ‘missing the party’ mistakes, then scale in on a bounce? Still plenty of wave to ride imho.
Thank you and it makes sense. I am thinking of taking profits on half of my short position today. I like Gary’s chart above and am waiting till the end of the day or another 2nd wave correction starting.
Didn’t realise you were already short – my comment was based on you being on the sidelines (I thought I read you sold your short a few days back – must have misunderstood / missed you getting back in)
No you did not misunderstand. I did close out my short positions last week. But I reopened today for an $0.08 per share difference (potential profit missed). But I did not open nearly as large a position. I forgot to post the new position here.
In the end today, I did not lighten up at all. I kept this full position for next week. Whatever wave we are in, it is only a first of some sort.
Thanks Lara for keeping me on the right side of the trade. $14.5k not bad…..
Thanks for sharing 🙂
Nice!
Nice!! Thanks for sharing
Love it when I help others make money. Hate it when you lose… but then… manage risk.
SPX has basically flat lined since the 1st 6 min of trading today.
If this doesn’t change soon… I am going out for the rest of the day!
EDIT: All the BULLS say BTFD! Typical!
Looks like SPX is trying head back up north…
I am not interest in hanging around to view that.
It’s a move in the other direction that will keep me around.
Olga – how did you get the MACD in histogram form?
It’s just the OSMA showing – untick the signal boxes on the MACD and it just shows what you can see on my chart – does that make sense?
There are 3 tick boxes on the title bar of the MACD indicator – untick the 2 signal ones.
Ok, thought maybe you discovered how to do histograms for other indicators…..thanks though.
I don’t know anyone picked PCLN short yesterday. I chickened out and instead picked e-minis. PCLN is down over $145 from yesterday’s close
Like you I was close but did not pull the trigger – I can’t complain too much though 🙂
Anyone have an updated count on the move down?
looking on a 10min chart – appears bounce up from this morning is an “a” up, then in a “b” down now…..but see if the low of the day holds or not, if it takes the low out and keeps going, then in 5 down. To what degree would be the next question. If the low holds then there will be a rip roaring “c” up yet.
I think we’re probably finishing up (b) of (ii) (wave (i) ended at todays low earlier).
(ii) might be over already but it was quite shallow – 2080 or 2088 would be my target if we go higher.
EDIT: Peter beat me to it but we’re on the same page 😉 Low taken out but there is RSI div so I think it could be an expanded flat (until (b) gets longer than 2x(a) – at which point (ii) is very likely over)
If (b) can exceed the low, do I recollect properly that it may be up to 2 times the length of (a)? If that it so, my calculations put that mark around 2036. ie it could no longer be a (b) wave of a flat. Is this correct?
Yep correct Rodney.
I draw trendlines around the possible (b) to also help determine if price is going higher
careful all – a quick snap back up of 40+ points could happen at anytime, whether today or on Monday morning gap up…the commercial traders know where everyone’s positions (and stops) are.
I do hope so! 🙂 🙂
Peter,
Locked my profits and now waiting to pounce again on any ramp up.
S&P dropped to 2050.71 — just 34 cents above Lara’s “confirmation of a trend change” on the bear daily and hourly charts.
There is some dispute on what the low for SPX was this morning. See Posts Below… some systems have lows below 2050.
I have the low you have… others have much lower.
Oh OK, interesting — I also use TD Ameritrade, so that makes sense. Just checked http://www.investing.com and their low for the day is 2038.6.
I am hoping that SPX breaks 2050 again so we eliminate all this confusion.
We are very close right now 2050.38
EDIT: and there you go… 2050.15
SPX now 2046.43
Excellent. That is good to see.
All of Lara’s Bear Counts now confirmed.
I would also like to see 2025 penetrated today as well. Then 2000 probably Monday. But I will take today… ES hit 1999 and the circuit brake was triggered for 1/2 hour or so… maybe longer, I forgot.
Without that breaker ES was about to freefall!
Isn’t it strange that they don’t have a ‘breaker’ to the upside…..
On ES or Emini’s… overnight its a 5% move in price down or up… if I read it correctly. I was really tired when I was searching for a reason why ES was frozen at 1999.
Warning to BULLS!
If the Dollar continues at this level and gets even stronger into the close of the month… Multi-National Co. Earnings are going to take a BIG HIT for the June QTR End and they were already going to be weak!
Just 4 more trading days!
Agree, on the 30min DX chart you can easily see a 4th wave correction now, then 5th up is coming (c down has to finish yet)
This next wave down should produce much more motivated MMs. I suggest taking some profits when we take out this morning’s lows. I am calling it an early day. Have a great and glorious weekend all!
Go Brits!!! 🙂
Looks like the big move down into the close on deck…will be rolling a few positions at its conclusion, as well as taking some skin out of the game so to speak…and that is the real skinny! 🙂
SPX at 2052.82 … lets break below 2050 to end any distortion of SPX low this morning!
Also there is a big Russell Index rebalancing today at the close… I think distorted this decline so far today. Market Makers accumulate or short shares during the day to accommodate the rebalance process at the close.
The Market is Stuck again! COME ON… Break below 2050!
Made a fun speculative trade on UVXY 13 strike calls expiring today in anticipation that short sellers are going to scurry from that 13.92 pivot before the close. Picked ’em up at an attractive 0.50 per contract! 😀
Now .90? — Wow
Yep! I love these quick doubles! It’s like money lying in the corner! 🙂
UVXY really should exceed this morning’s high on the next wave down….we’ll see…
I want to point something out.
Philip’s cycle date of 6/23 was right on the money!
http://elliottwavestockmarket.com/2016/06/23/sp-500-elliott-wave-technical-analysis-22nd-june-2016/#comment-55801
QV…there are some very critical things in play…the daily squiggles and wiggles are nice to know…however, the BIG money is made when you ride the trend…that is why I posted the Jesse Livermore quotes…
currently 50 points higher than when i went to bed last night
It might me wise to delay judgment at least ’till your next bedtime….or better yet, trade what you see! As I said previously, let me know how it works out for ya…. 🙂
People that got in on the Feb low are sitting on a nice nest egg and are probably sitting on stop orders. A plunge deep enough to start tripping stops would get this party started.
Yep… 57 points for me.
I am just wondering given the Brexit and likely others that will walk out from EURO, if I had long positions with reasonable profits from Feb lows, why would I risk that heading into summer months. I suspect more selling as we approach Q2 end next week. Funds are trying to mark their books for Q2 ending next week.
Happily took the other side of the Unicorn short sellers’ parry… 🙂
News that Italy wants to break away from EURO. The chain reaction has started and can not be controlled
Italy wants to separate from Europe campaign launches next week.
Some are calling it Lehman 2.0
Let the dominoes fall…!!! There are earth tremors in Brussels….Arrogant Schmucks! 🙂
Vern,
German banks are very risky now as many will fail. This is not going to be easy and US FED will have their head handed over to them on platter if they jump in this. Draghi is probably looking to resign before he can be blamed for all this..
“Risky” hardly does justice to their true condition. A more appropriate word is insolvent. I was apoplectic that German courts let that renegade Draghi continue to debase the Euro, primarily at German taxpayer’s expense.
Few folks know about the trail of financial detritus in Draghi’s wake before bringing his wrecking ball to the ECB….”Whatever it takes Draghi”…yeah right! He well might flee like a rat from the sinking ship….
DB is down the drain for sure…
The French are more unhappy with the EU than the UK was. Really this could be a big unwinding.
So what happens to all the money that was given the Greece and others…gone up in smoke ..
I got a message from another trader who said Greenspan was on CNBC calling this a global disaster…
at the moment the US markets are shrugging it off. Up 50 points from the point futures were halted last night
Can you believe what is going on in Calais??!! We have some friends from U of I in Tolouse we wanted to go visit but thought it wise to give France a wide berth for the time being. Sad to see a beautiful part of that country decimated both culturally and otherwise…! 🙁
Just as someone on this forum confidently asserted that the market would OPEN in the green, no doubt there are quite a few today quite confident that it’s going to CLOSE in the green…! 😀
Look for the 13.92 UVXY gap and a dose of cold hard reality for the dreamers, or possibly smokers of exotic substances… 🙂
I actually got real bids on the bearish side of my remaining UVXY bull spread( 8 strike puts) expiring to day and was able to unload ’em! Can you believe it?
What does it tell you about the level of bullishness in this market in that they not only failed to cover at 13.92 after a 100 point SPX plunge, they doubled down on their short positions!! Oh, don’t worry, that folly will be soon enough corrected. This market has LONG way to fall…..
Of course they are going to continue doing everything they can to intervene in the market and manipulate prices. These near-term gyrations are meaningless. They are powerless to stop a primary degree trend so don’t fail to see the forest because of the trees!
Traders continue to happily short UVXY, confident that the banks are going to save them… 🙂
BTFD crowd is in heaven. Probably will fill half the gap or so before turning down again.
Plunge protection team working overtime.
Yep! They are all still convinced new ATH on the way…amazing is it not??!!
I guess it is going to take DJIA down a few thousand point to awaken their sense of real risk. The banksters have got the BTFD lemmings well trained it appears! 🙂
We are following the futures script exactly….
Straight up off the open
Well, we took out the 2050 confirmation of trend change price. Lets see if we cannot get below the 2025 price.
No… the Market Markers stopped it at 2054.96…
SPX should have traded to 2044ish in the 1st 5 min… based on where the ES prices were. They delayed open of certain stocks to halt the decline above 2050 for now.
Major manipulation! %&#@ THEM!
%&#@ this…. The Market is Fixed!
This is Pure Fing BS!
??? I got 2038 as the low in the SPX.
I have SPX 2054.96…. TD Ameritrade has proven accurate in the past. But you never know.
What do you all have as a Low?… Everyone please post the low you all show.
On IB platform it shows 2048.08 as a low for today
2038.60 on investing.com
2054.96 on TC2000
Okay… So do we have conformation of a penetration of 2050 or not?
I don’t know how to answer that at this point… I guess it depends on what Lara shows.
Hopefully, we just go back under during the day to end the confusion.
MMs are trying to rip off UVXY longs…wait ’em out…. 🙂
Ditto, I bought some from weak hands again..
Check out the UVXY option prices – wow.
Options traders see where this is going.
Good Morning all…
If was a fun night, now let’s finally get that elusive P3!
Target 1595 & then 1271
1st few min we should get to SPX 2040ish as the individual stocks open.
I don’t believe all the S&P 500 stocks are fully open yet.
Futures may not be properly indicating true downside potential.
Traders long the market, particularly leveraged ones were justifiably jubilant during the rocket ride up yesterday. If they did not take profits intra-day they are going to be as equally jaundiced this morning. Most traders do not have after hours trading privileges and some less experienced ones do not understand that stops do not protect you in a run-away market that gaps down below your stops. Brokerages are already announcing that they may not honor stops and it is not that they do not want to but that they simply cannot – there are no bids at the stop price!
A lot of traders are going to have to unwind their positions at the market bids when it opens, accelerating the downward slide. For traders on the wrong side of the market this can be an unmitigated disaster. Already trillions have been shaved off global equity evaluations and it is going to get a lot worse.
Remember to take profits early and often. Have a great trading day everyone! Lock and Load! 🙂
If I am correct, this move (from last nights high to today’s open) would only be considered minute wave 1 down correct? This is only the start of minor wave 3…correct?
Should I sell UVXY now and wait for wave 2 up to finish and then reload it?
That’s a decision you must make on your own. I don’t trade UVXY and I don’t know if my count is correct.
QV, You are correct I believe about the beginning of Primary 3. However, I am not sure what degree Lara will label this first impulsive wave. I makes sense to me that at least Minor 1 and minute 1 will show on the daily charts.
Also, her wave count last evening moved the end of Primary 2. Again, I do not know if she will stay with that or move it back to where it has been for several weeks now.
Vern and all,
The premarket figures I see for UVXY show the current bid under 14.25. Are you still thinking this is a great gift? I need to reload my shorts as I was waiting for 2115 or so. What would be your strategy to get short now? Today? Monday? After a 2nd wave correction? But the gift at the open? etc
Of course I would love to hear from all members.
same question from me. I don’t know if I should lock profit from UVXY now.
Also – waiting to find out who won the unicorn opening price contest? 🙂
Do you want to know why we’re still in intermediate 1 wave down? I have a very close friend who manages money for clients, not a ton, but maybe about $500m AUM (US). We went to college together and have kept in close contact with each other over the years. Anyhow, he is buying this dip. I am sure that he’s not alone. This mentality probably won’t be broken until we are somewhere in the middle of Intermediate wave 3.
I found our conversation very interesting this morning and how he and I are on polar opposite spectrum of this market currently.
The great risk here is if the Fed steps in one day and announces they’ve begun QE5….still a bear on the market but the jump upside for that day would be tremendous, squeezing the shorts of course.
Agree but they run the risk of losing all credibility and trust as none of their past money drops have worked. Given the elections FED will be very careful on how much they impose themselves on the markets. This is nothing more than a desperate attempt by the blindsided bulls to manage the risk exposure but this one will fail.
Congratulations to all those who caught the big drop down. Joyful beyond description for the UK people voting for freedom v. government control! What a great day!!!!
Here’s the deal with UVXY.
There are some Unicorn short sellers who did not learn their lesson back in August.
They bought the very bullish predictions of new ATH and again massively sold short the beast, expecting they would never have to cover as we went on to ATH and a reverse split would allow them to get off scot free, as they have in the past.
It made a remarkable series of new 52 week lows in the glaring absence of new ATH. That was hubris run amuck!
They are probably going to stubbornly refuse to cover, STILL anticipating that new ATH are ahead.
We will therefore likely see another striking divergence with VIX issuing a capitulation spike and UVXY not initially confirming.
If the initial impulse down completes rapidly as has been the case of late, I would not be at all surprised to see these folk hold on through a second wave correction. We will know based on just how high the Unicorn spikes.
Even if they do hold on through the first impulse down, hear me now and believe me later… they WILL cover…big time!
Their pain, can be your gain! Lock and Load!!! 🙂
Vern,
Here are my thoughts going forward, I am looking to lock the profits on e-minis over the coming days. As appropriate and if opportunity presents, I will load up on some UVXY while banksters try to get their buddies out with minimal pain.
Expecting US markets to be atleast down over 6% as DAX is down over 7 and FTSE over 4%.
First post so please be patient! Looking for advice…….
I have some july 29 FAZ 37.5 calls…… would you take profits on the initial plunge with all the premium built in, or relax and risk the ups and downs and hope the PTB lets the market fall further?
I will make the decision myself, but really would like the board to share their thoughts….Thanks to Lara and all of you!!
Despite the carnage in markets overnight. Bullishness remains entrenched and not too surprising for a GSC top. It would seem that even some seasoned analysts are completely unaware of what is about to unfold. One I read is urging traders to “avoid panic selling”, and opining that the Brexit “correction” could provide bargains…!
Banksters desperately defending second critical pivot at 2000. They halted trading at that level so they could ramp up the pumping machines. We may see a bit of a re-tracement this Black Friday but come Monday there will be blood…
Crikey! What a day!
I had to travel down country for a family memorial tomorrow. Just arrived very late and tired, only 66% battery power left and my laptop power cable at home 🙁
Must go get one in the morning. Cesar is prepared. He has a laptop AND a cable. Good man.
Glad to hear some are happy. My first shorts were whipsawed out, but I jumped back in. I haven’t checked my trading station all day so I don’t know how well that’s done.
Back later folks after some necessary sleep.
Enjoy that much-deserved rest Lara!
A nice positive position 🙂 Happy days.
Now for some sleep. Cheers Verne! Hope your profits are very good today.
Oh Yeah!! Thank you kindly great leader!! I stuck with the count! It was not easy; was shaken, but not stirred! 🙂
Incredibly, pre-market bid for UVXY only 15.17
If it opens at that level it would be an unbelievable “gimme.”
Of course, both CAC and DAX showed futures up over 1% all evening which I found remarkably strange…how’d dey do dat??!!
Vern,
It might give someone a lucky break as central banks and FED try to portrait a brave and nothing big to worry about scenario.
Yep… well a bit of shock here I must say. Stayed up all night. Bookies were 5 to 1 leave at 10pm.
Power to the people.
Lara on such a moment us day is it not worthy of an update ?
I have been travelling all day and only just arrived at my destination very late. I haven’t been able to look at the market today.
The powers that be do not want to lose 2000 on S&P futures…
Time for bed… Looks like all Futures Trading Halted!
Anyone know how long the Halt is for?
ES just reopened at 2009.25
Final Vote Results:
52% Leave
48% Stay
Actually looks like S&P futures back
yes they are back
Nikkei down 7.89%
Ouch 🙂
Dear Lara,
I’m RICH!!!
Thanks to you, (and some extra candle stick analysis) I hung in there, and added a few hundred more contracts today!
Thank you for the work you do!
‘Thank you for the work you do!’ – Ditto – Lara is the best (no suprise for those of us that have been around here for a while) 🙂
Glad yer RICH!! btw 🙂
How sweet it is! 🙂
Glad to hear you stuck it to the banksters!
A lot of folk threw in the towel today… 🙂
Dang, way to go!
Nice to have a huge payday… 🙂
Also thanks to Lara btw – always learning from her – and the smart folks on this board.
you are guys are extremely knowledge…learning a lot. I have one question: whats the target for wave 3?
Congrats Lisa and to all who profit from this move! Also I want to add my ‘ditto’ –Thanks (from a new member) to Lara for her excellent analysis. 🙂
Well i’m not quit my job rich, but I did wipe out a couple years of losses.
Congratulations!
“Bottom line: a new low below 2,050.37 would confirm an end to a bear market rally and a primary degree third wave down.”
Well I would say that ES currently at 2003 would indicate that SPX 2,050.37 will be taken out on the open and so will SPX 2025!
By the way many world markets and world market futures are down 7%+++
Lara, anyone, what is the target for 3 down….ire all about 1994? How about 4 up…5 down?
There Goes ES 2000
ES now at 1999
ES is FROZEN at 1999 for more that a few min
DOW YM Down 731
Circuit breakers???
Wow – cracked through 2000 pivot, this is getting wild!
No doubt this is a big one…
Yea but FROZEN at 1999 for more than 5 min. – ANyone have a different price?
Anyone have an active ES Price??????????
Anyone… mine is still frozen at 1999???
Maybe pulled the plug – circuit breakers???
Maybe… I didn’t know they had that on Emini’s
YEP circuit breakers… 5% on Price Overnight.
Anyone know how long the circuit breakers are for????
Yep I’m still seeing frozen at 1999
bloomberg just noted that some brokerage houses will not honour stop orders into today/tomorrow…. talk about acceleration
so how do we play this drop now? in the coming week(s)…what can we expect
by the way,, is there a limit down for futures?
“The shallow correction of intermediate wave (2) reduces the probability of this wave count. Normally within a bull market the first second wave correction is very deep.”
How do you know intermediate wave (2) is complete?
S&p futures down 100. If that holds…..wow….dollar soaring as is gold…..odd. Seeing the 2 go up in tandem…..seeking safety at all costs……..things may change a bit by morning.
True. At the time that chart was prepared the market was up after hours over 2,120.55. Which would have invalidated a second wave correction within minor C for the bull daily chart, and so minor C should have been over.
I do need to spend some time tomorrow morning to see how intermediate (2) could continue lower. As it could.
looks like we might have a down day!!
Futures down about 70 on the sp…..is it final for the leave vote?
news outlets are calling it,, UK to LEAVE
First… oh yeah AND the UK voted LEAVE 🙂
Very proud Brit atm 🙂
congrats Olga, on being first and most of all for UK leaving,, and it is ok to use all caps for this moment..
Wouldn’t usually – but very special occasion for me 🙂 🙂
Nice Olga (thumb up),?
Ha that was supposed to be a !! not ?
Much better performance today than Euro 2016 🙂
Congrats! And enjoy your well deserved vacation to Ibiza…
Untz, Untz, Untz…
Cheers ari 🙂 (I agree on the Euro 2016)
Congrats Olga! UK freedom! And great trading too 🙂
As our token Brit, Olga, congrats on a great result and a vote that may well lead to a further movement for freedom across Europe and the US.
You are right to be proud and we are proud of you Brits for blazing a trail!