
Another small range day moved price lower, which the main Elliott wave count expected, but today classic technical analysis strongly suggests the price direction for tomorrow and so a new hourly chart is published today.
Summary: VIX today strongly suggests higher prices tomorrow (and maybe for a few days yet) with strong bullish divergence which should be taken seriously. A new hourly wave count expects more upwards movement tomorrow to continue to find resistance about the black trend line, but to not move above 2,120.55.
Trading advice (not intended for more experienced members): Any short positions which are positive may take profits now. Higher prices present another opportunity to join the trend.
Looking at the bigger picture, any short positions entered here should be profitable next week and may still offer a very good risk / reward set up. However, any members entering short here must understand there is a risk the position may be underwater for several days before becoming profitable. With that in mind, it is essential to manage risk: no more than 5% of equity should be risked if entering short here.
Stops (and risk) for new positions must be just above 2,120.55.
Last published monthly charts are here.
New updates to this analysis are in bold.
BEAR ELLIOTT WAVE COUNT
WEEKLY CHART
Click chart to enlarge.
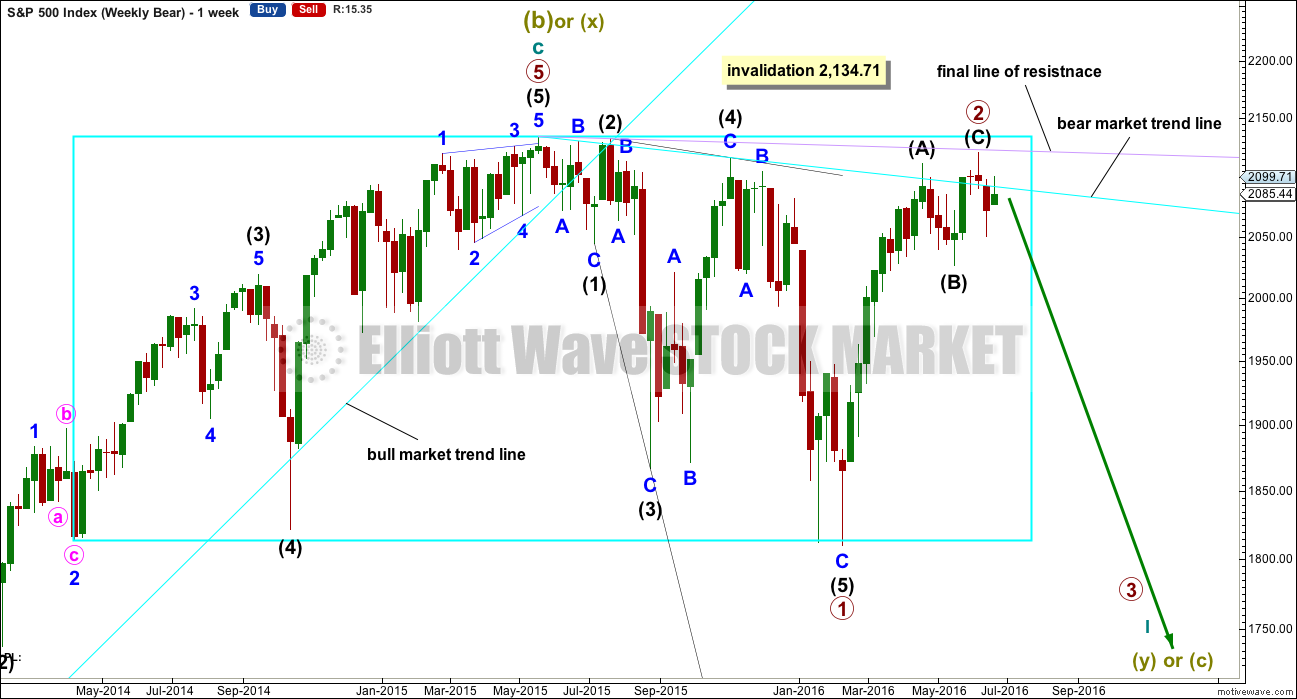
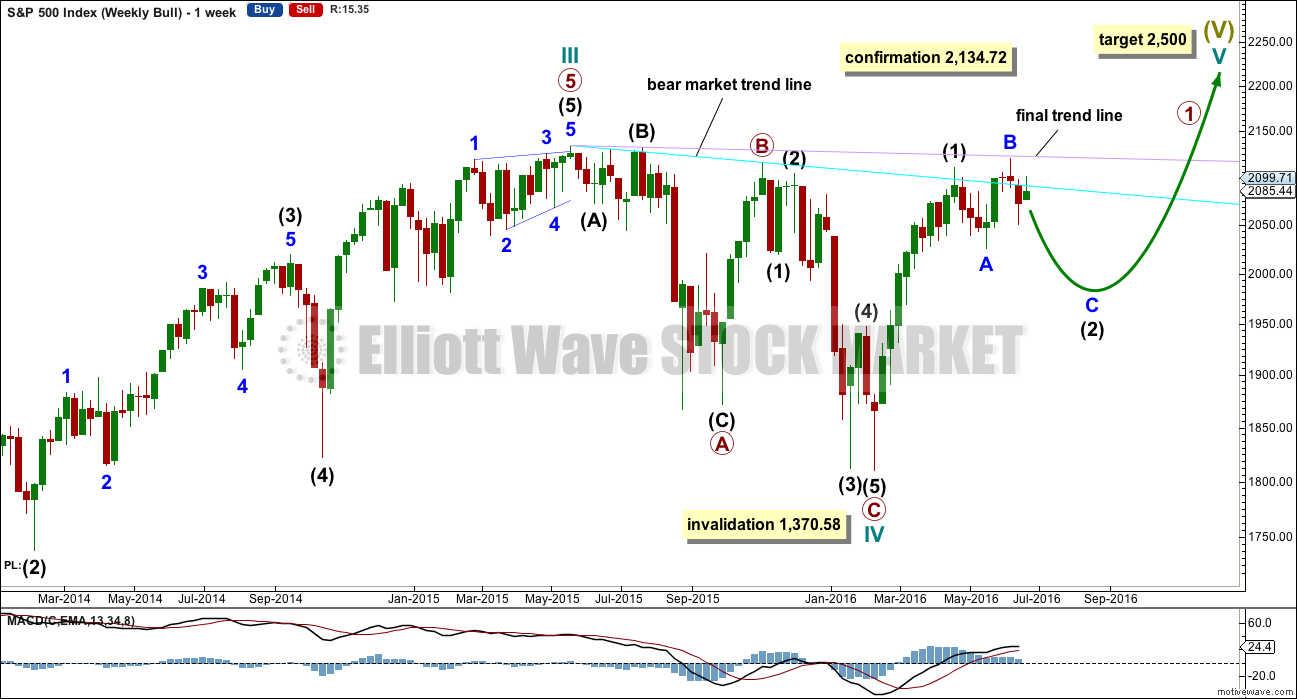
The box is added to the weekly chart. Price has been range bound for months. A breakout will eventually happen. The S&P often forms slow rounding tops, and this looks like what is happening here at a monthly / weekly time frame.
Primary wave 1 is seen as complete as a leading expanding diagonal. Primary wave 2 would be expected to be complete here or very soon indeed.
Leading diagonals are not rare, but they are not very common either. Leading diagonals are more often contracting than expanding. This wave count does not rely on a rare structure, but leading expanding diagonals are not common structures either.
Leading diagonals require sub waves 2 and 4 to be zigzags. Sub waves 1, 3 and 5 are most commonly zigzags but sometimes may appear to be impulses. In this case all subdivisions fit perfectly as zigzags and look like threes on the weekly and daily charts. There are no truncations and no rare structures in this wave count.
The fourth wave must overlap first wave price territory within a diagonal. It may not move beyond the end of the second wave.
Leading diagonals in first wave positions are often followed by very deep second wave corrections. Primary wave 2 would be the most common structure for a second wave, a zigzag, and fits the description of very deep. It may not move beyond the start of primary wave 1 above 2,134.72.
So far it looks like price is finding resistance at the lilac trend line. Price has not managed to break above it.
DAILY CHART
Click chart to enlarge.
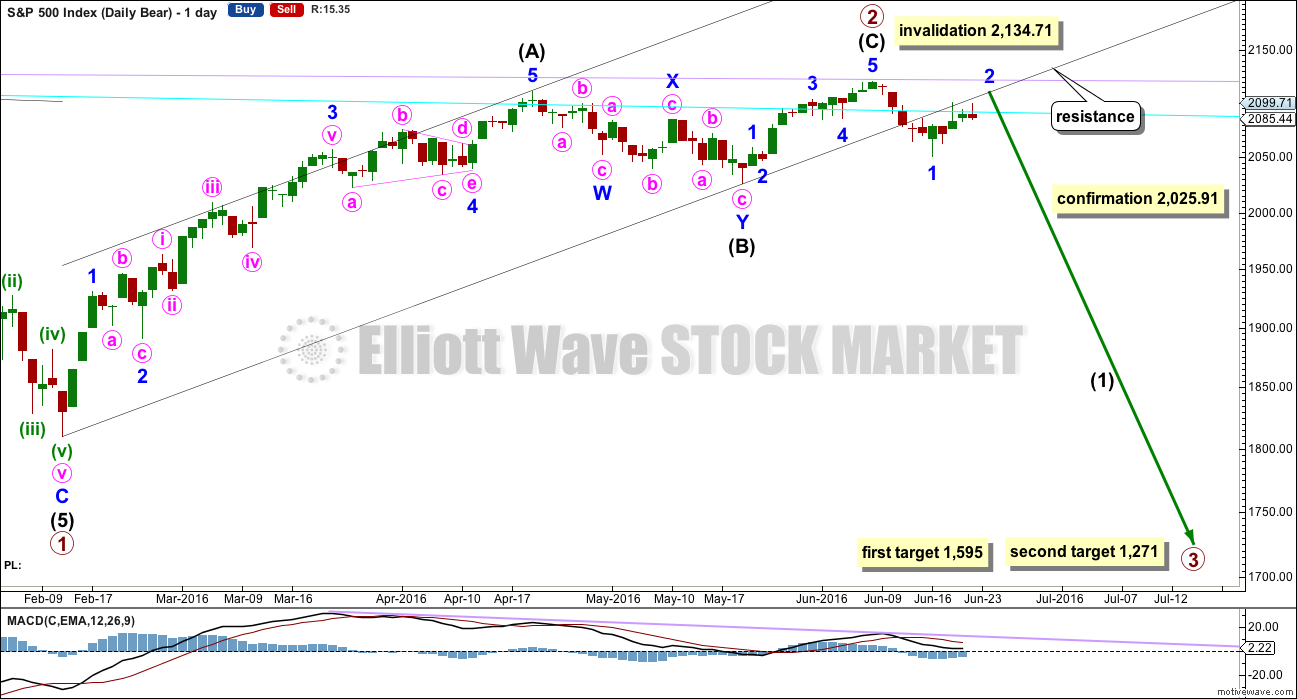
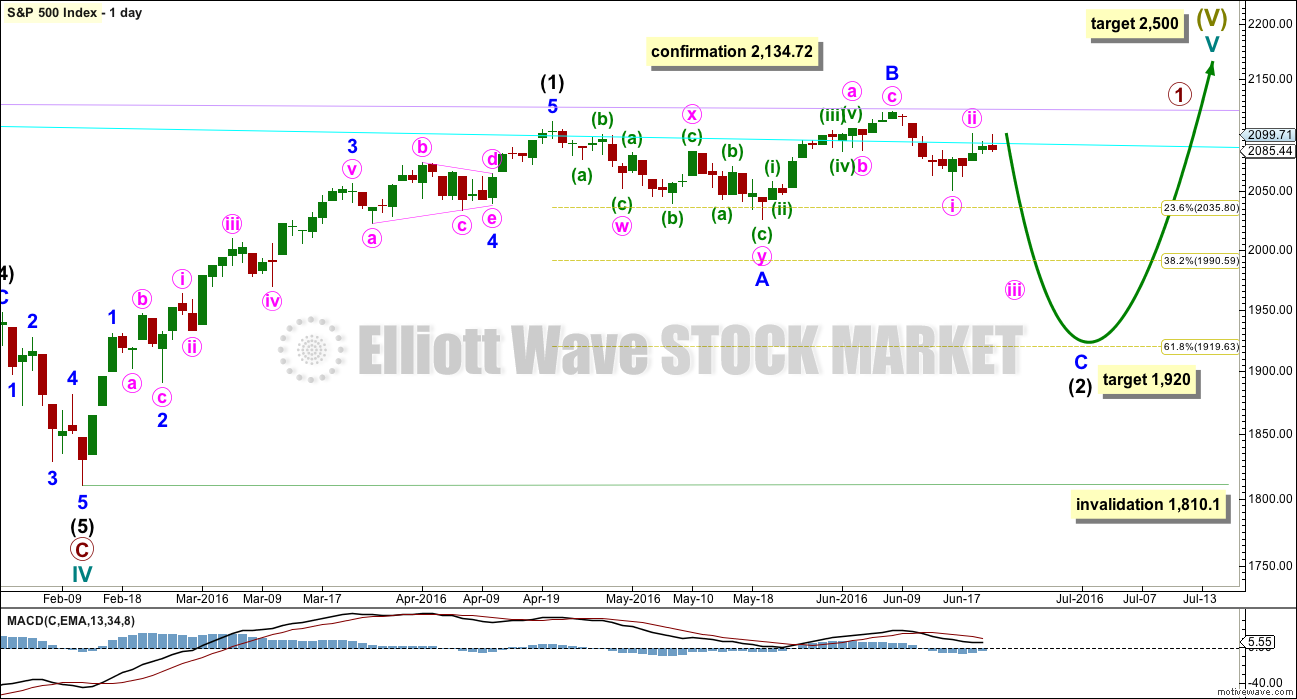
Primary wave 2 would be a 0.96 correction of primary wave 1. Second wave corrections following first wave leading diagonals are commonly very deep, so this fits the most common pattern if primary wave 1 was a leading diagonal.
The most common structure for a second wave correction is a zigzag.
There is no Fibonacci ratio between intermediate waves (A) and (C).
Draw a channel about primary wave 2 using Elliott’s technique for a correction: draw the first trend line from the start of the zigzag, then a parallel copy on the end of intermediate wave (A).
Intermediate wave (C) is a complete impulse and primary wave 2 is a complete zigzag. With two full daily candlesticks below the wide black channel and not touching the lower edge, there is some confidence that primary wave 2 is over.
At this stage, it looks like minor wave 1 ended at the low for last week and minor wave 2 may yet continue higher and would very likely continue to find resistance about the lower edge of the black channel. If it takes long enough and gets high enough, it should find final resistance at the lilac trend line which stopped primary wave 2.
So far minor wave 2 may have lasted four days. If it ends tomorrow, it may total a Fibonacci five days. The next number in the sequence is eight which would see minor wave 2 continue now for another four days in total.
Intermediate wave (C) lasted a Fibonacci thirteen days. Intermediate wave (B) lasted a Fibonacci twenty-one days and intermediate wave (A) lasted forty seven days (not a Fibonacci number). Primary wave 2 would have lasted eighty one days (also not a Fibonacci number). If primary wave 3 exhibits a Fibonacci duration, then a reasonable estimate would be a Fibonacci 144 days.
A new low below 2,025.91 would provide final price confirmation of a trend change. At that stage, downwards movement could not be a second wave correction within intermediate wave (C) and so intermediate wave (C) would have to be over.
The targets calculated are provisional only. They come with the caveat that price may yet move higher which means the targets would move correspondingly higher. They also come with the caveat that at this very early stage a target for primary wave 3 may only be calculated at primary degree. When intermediate waves (1) through to (4) within primary wave 3 are complete, then the targets may change as they can be calculated at more than one wave degree. Primary wave 3 may not exhibit a Fibonacci ratio to primary wave 1.
The first target at 1,595 is where primary wave 3 would reach 1.618 the length of primary wave 1. This target would most likely not be low enough because primary wave 2 is very deep at 0.96 the length of primary wave 1. Primary wave 3 must move below the end of primary wave 1, and it must move far enough below to allow subsequent room for primary wave 4 to unfold and remain below primary wave 1 price territory. Normally, there is a gap between first wave and fourth wave price territory, particularly in a bear market.
The next target may be more likely. At 1,271 primary wave 3 would reach 2.618 the length of primary wave 1.
If primary wave 3 does not exhibit a Fibonacci ratio to primary wave 1, then neither of these targets would be correct.
Well before these targets, it should be obvious if the next wave down is a primary degree third wave. It should exhibit increasing ATR, strong momentum, and a steep slope. However, please note that although it may begin very strongly it does not have to. It may also be that intermediate wave (1) maintains an ATR about 20 – 30 and has some deep time consuming corrections within it. That was how the last primary degree third wave began within the last bear market, so it may happen again.
MAIN HOURLY CHART
Click chart to enlarge.
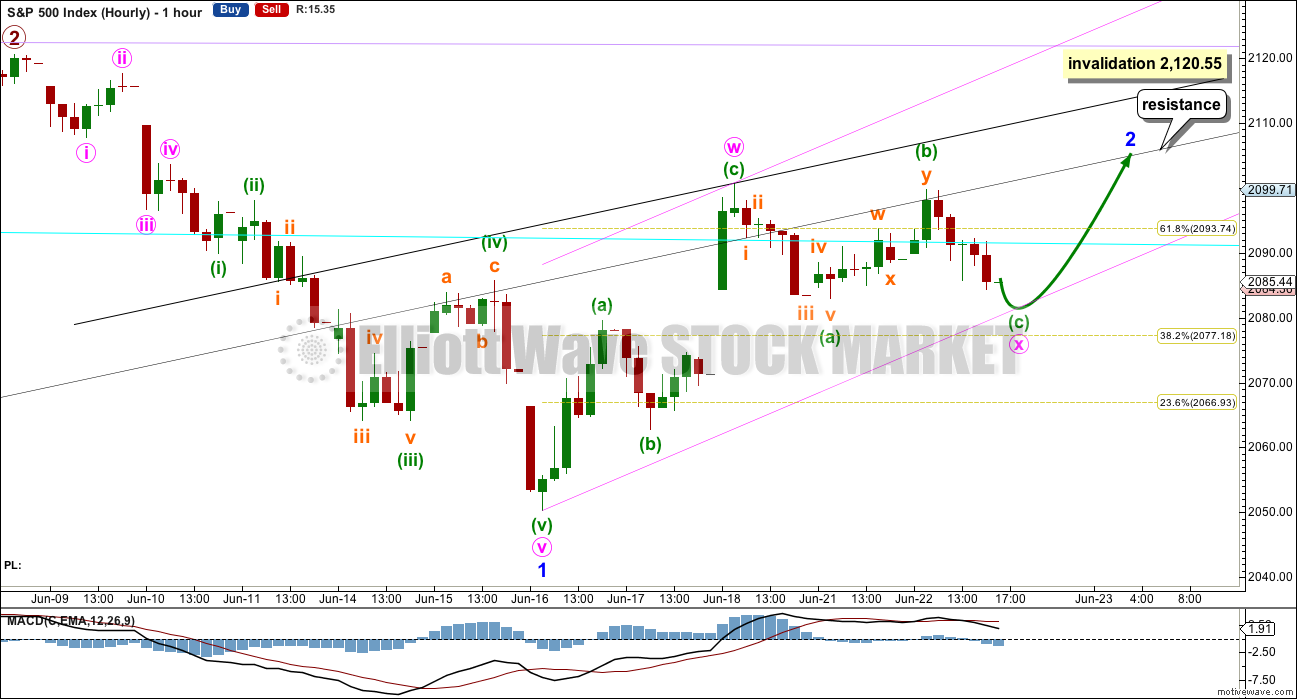
This wave count is new. Yesterday’s alternate is discarded as it expects essentially the same movement as this new wave count. This idea has better proportions and better Fibonacci ratios.
Minor wave 2 may be continuing higher as a double zigzag. The first zigzag in the double is complete labelled minute wave w. The double looks like it is joined by an incomplete three in the opposite direction labelled minute wave x. Minute wave x may move slightly lower if it is a flat correction, or it may move sideways if it is a triangle. Both structures are equally as possible for minute wave x.
If minute wave x continues lower or sideways, then redraw the best fit channel about minor wave 2. Draw the first trend line from the start of minor wave 2 to the end of minute wave x, then place a parallel copy on the end of minute wave w. After some more upwards movement, then a subsequent breach of the lower edge of this channel by clear downwards movement (not sideways) would be an indicator of a possible trend change.
Minute wave y as the second zigzag in the double should deepen the correction, that would be its purpose. It may be expected to find resistance at the black trend line which is copied over from the daily chart. A parallel copy is placed higher up to show where minute wave w found resistance. If the first black line is breached, then look for upwards movement to end if price touches the second higher black line.
This wave count expects minor wave 2 to be reasonably in proportion to minor wave 1 in terms of duration. That would give the wave count the right look at the daily chart level. It expects minor wave 2 to be very deep. Second wave corrections often are very deep.
Minor wave 2 may not move beyond the start of minor wave 1 above 2,120.55.
ALTERNATE HOURLY CHART
Click chart to enlarge.
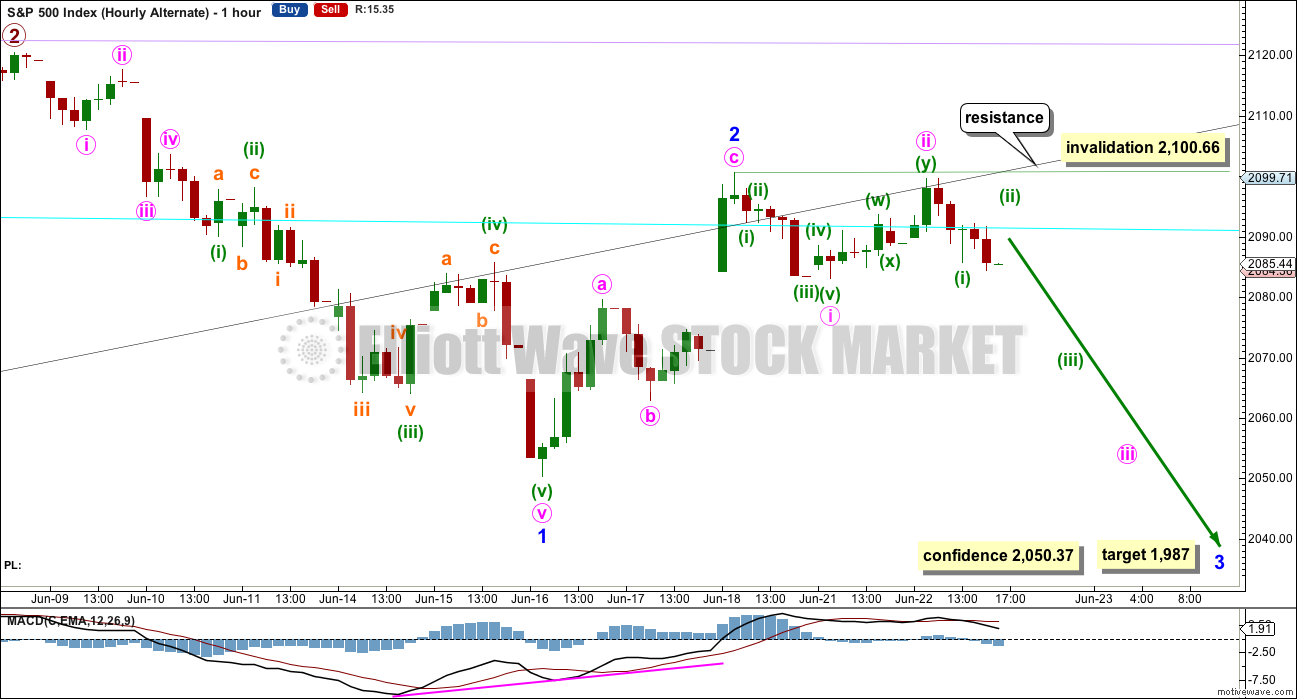
Tis was the main hourly wave count Yesterday and today VIX relegates it to an alternate.
Minor wave 2 may have been over as a quick deep zigzag lasting only a Fibonacci two days. This is still possible while price remains below 2,100.66 but today looks highly unlikely given strong bullish divergence from VIX.
At 1,987 minor wave 3 would reach 1.618 the length of minor wave 1.
This wave count expects to see an increase in downwards momentum over the next few days as a third wave unfolds at three degrees.
Within minor wave 3, minute wave ii may not move beyond the start of minute wave i above 2,100.66.
BULL ELLIOTT WAVE COUNT
WEEKLY CHART
Click chart to enlarge.
Cycle wave IV is seen as a complete flat correction. Within cycle wave IV, primary wave C is still seen as a five wave impulse.
Intermediate wave (3) has a strong three wave look to it on the weekly and daily charts. For the S&P, a large wave like this one at intermediate degree should look like an impulse at higher time frames. The three wave look substantially reduces the probability of this wave count. Subdivisions have been checked on the hourly chart, which will fit.
Cycle wave II was a shallow 0.41 zigzag lasting three months. Cycle wave IV may be a complete shallow 0.19 regular flat correction, exhibiting some alternation with cycle wave II and lasting nine months. Cycle wave IV would be grossly disproportionate to cycle wave II, and would have to move substantially out of a trend channel on the monthly chart, for it to continue further sideways as a double flat, triangle or combination. For this reason, although it is possible, it looks less likely that cycle wave IV would continue further. It should be over at the low as labelled.
At 2,500 cycle wave V would reach equality in length with cycle wave I.
Price has now broken a little above the bear market trend line. This line is drawn from the all time high at 2,134.72 to the swing high labelled primary wave B at 2,116.48 on November 2015. This line is drawn using the approach outlined by Magee in the classic “Technical Analysis of Stock Trends”. To use it correctly we should assume that a bear market remains intact until this line is breached by a close of 3% or more of market value. Now that the line is breached, the price point at which it is breached is calculated about 2,093.58. 3% of market value above this line would be 2,156.38, which would be above the all time high and the confirmation point.
This wave count requires price confirmation with a new all time high above 2,134.72.
While price has not made a new high, while it remains below the final trend line (lilac) and while technical indicators point to weakness in upwards movement, this very bullish wave count comes with a strong caveat. I still do not have confidence in it. It is produced as an alternate, because all possibilities must be considered. Price managed to keep making new highs for years on light and declining volume, so it is possible that this pattern may continue to new all time highs for cycle wave V.
The invalidation point will remain on the weekly chart at 1,370.58. Cycle wave IV may not move into cycle wave I price territory.
This invalidation point allows for the possibility that cycle wave IV may not be complete and may continue sideways for another one to two years as a double flat or double combination. Because both double flats and double combinations are both sideways movements, a new low substantially below the end of primary wave C at 1,810.10 should see this wave count discarded on the basis of a very low probability long before price makes a new low below 1,370.58.
DAILY CHART
Click chart to enlarge.
Intermediate wave (2) may still be an incomplete flat correction. Minor wave A will subdivide as a three, a double zigzag, and minor wave B may be seen as a single zigzag.
The most likely point for intermediate wave (2) to end would be the 0.618 Fibonacci ratio at 1,920.
Intermediate wave (2) may not move beyond the start of intermediate wave (1) below 1,810.10.
While it is possible that intermediate wave (2) may be a complete double zigzag at the low labelled minor wave A, this would be a very shallow and rather quick second wave correction. The first reasonable second wave correction within a new bull market should be expected to be deeper and more time consuming for this bull wave count, so intermediate wave (2) is expected to continue.
TECHNICAL ANALYSIS
WEEKLY CHART
Click chart to enlarge. Chart courtesy of StockCharts.com.
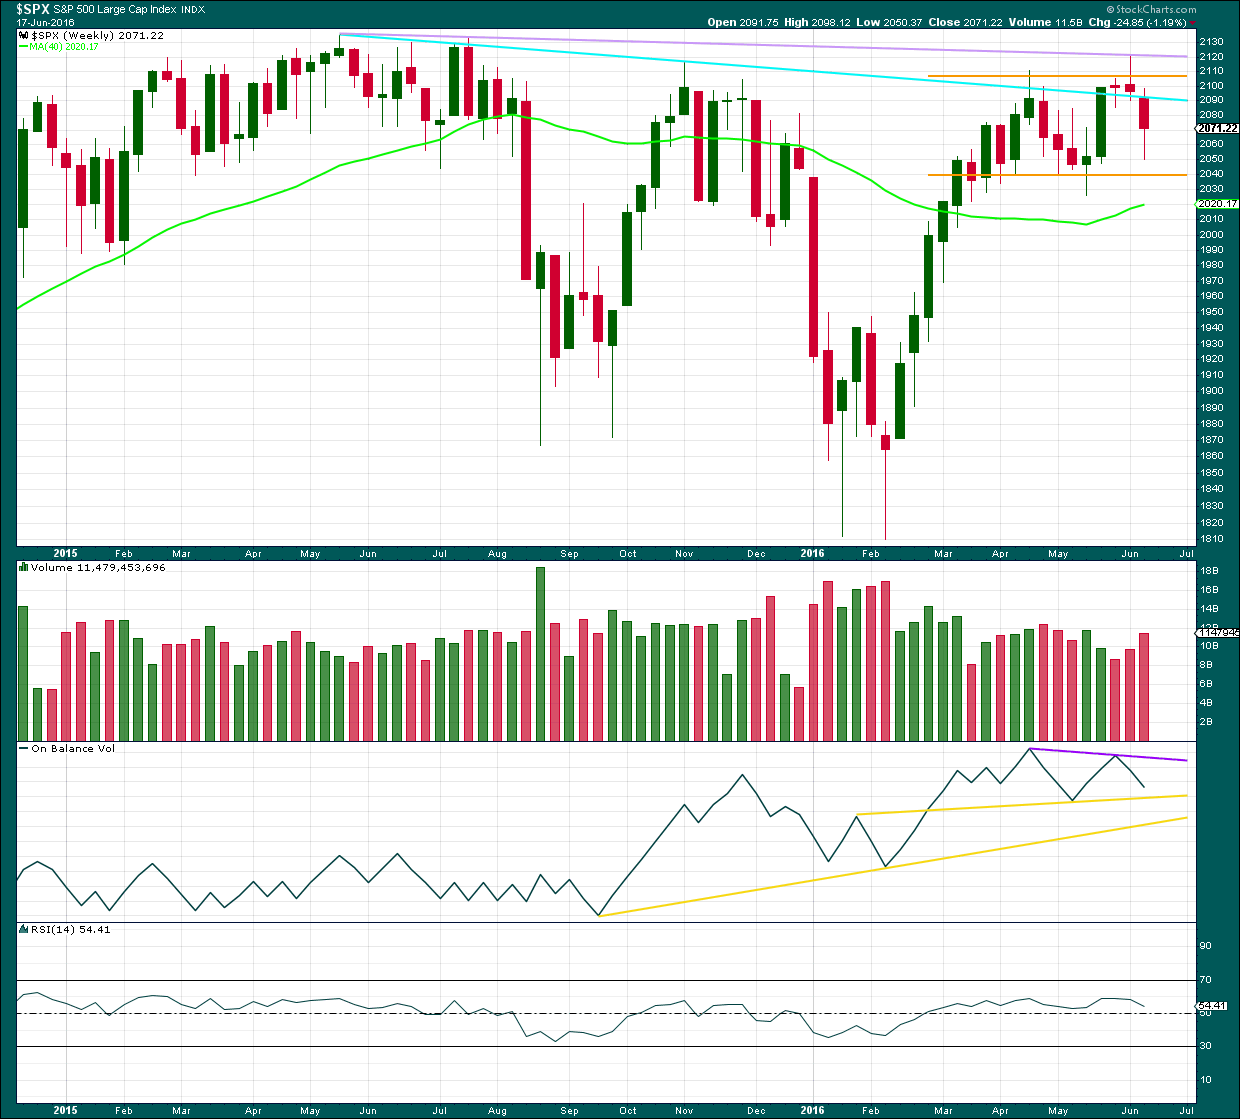
The reversal implication of the shooting star candlestick pattern for last week is now confirmed by a strong red weekly candlestick which gapped down. This week’s candlestick pattern may be considered to have completed an Evening Doji Star pattern, albeit with two doji at the high.
Along the way down, price may find some support about 2,040.
Upwards movement made an important new high last week but could not manage to break above the final lilac line of resistance. That line remains intact and is now strengthened.
Volume has increased for a downwards week, but as this includes an options expiry date it should not be considered as definitive. Volume for the two downwards weeks prior also showed some increase, although volume was light. It looks like so far the market may be falling of its own weight; selling pressure is light. If selling pressure increases, then look out for a strong increase in downwards momentum.
On Balance Volume trend lines are redrawn this week: support in yellow and resistance in purple. OBV would allow for a little further downwards movement before it finds support at the first yellow line. This may indicate where a bounce may turn up.
DAILY CHART
Click chart to enlarge. Chart courtesy of StockCharts.com.
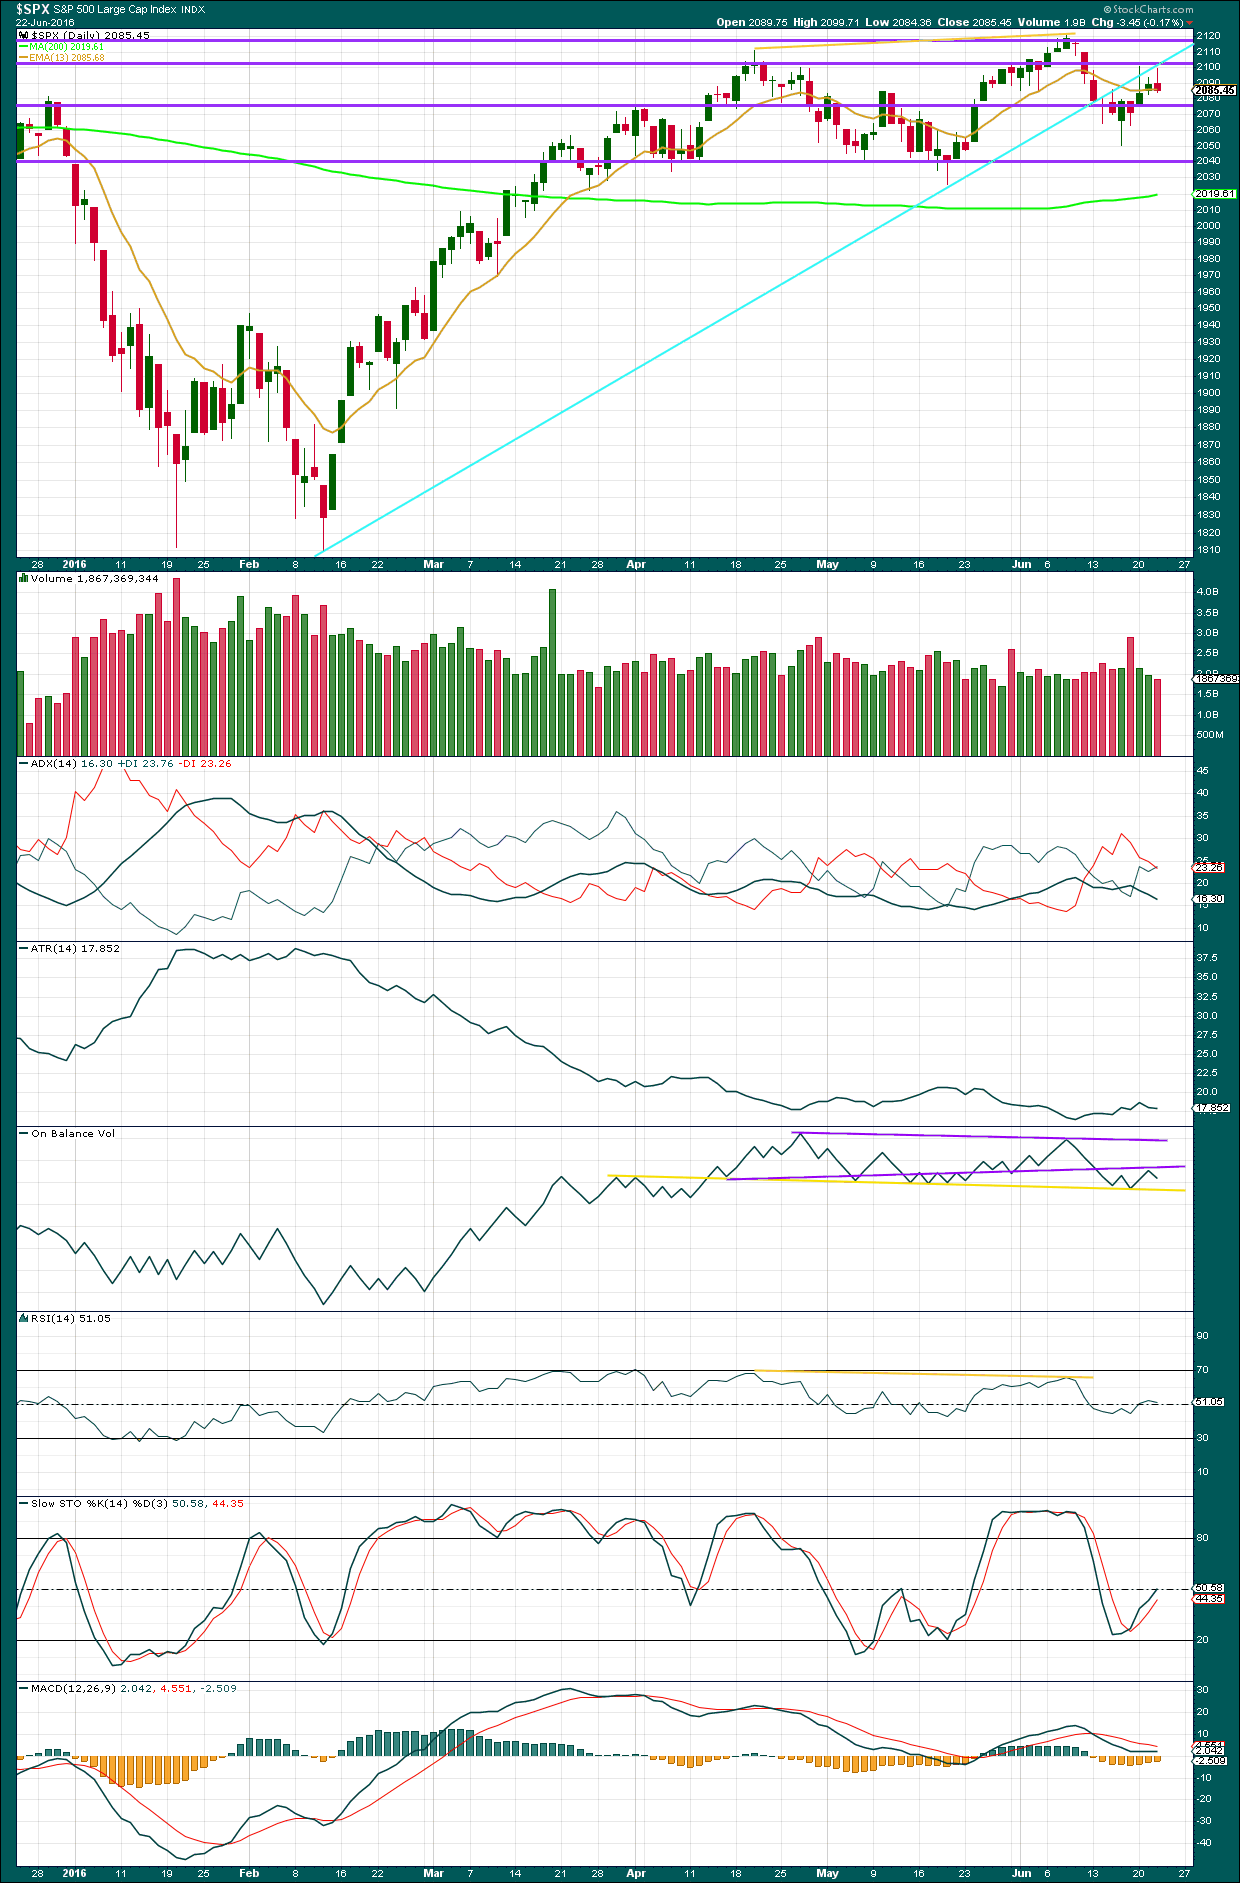
Volume data on StockCharts is different to that given from NYSE, the home of this index. Comments on volume will be based on NYSE volume data when it differs from StockCharts.
A small red candlestick with lighter volume is bullish short term. The fall in price today was not supported by volume, so it is suspicious (although the market can fall of its own weight). The long upper wick of today’s small red candlestick is bearish.
Price has essentially been range bound since about 18th March, 2016, finding support at the horizontal line about 2,040 and resistance about 2,115. It is downwards days of 29th of April and 31st of May during this range bound movement which have strongest volume (ignoring the options expiry date of 17th of June). This suggests a downwards breakout from this range is more likely than upwards.
On Balance Volume is also range bound. A new purple line is added today. A break above the first purple line would be bullish. A break below the yellow line would be bearish.
ADX today is declining indicating the market is not trending; it is consolidating. The -DX and +DX lines today have come together. A cross over would indicate a possible trend change, although these directional indicators do tend to fluctuate about each other during consolidations.
ATR is today overall flat to declining, in agreement with ADX that this market is not trending.
RSI is neutral. There is plenty of room for price to rise or fall.
Stochastics is also neutral. If this market is range bound, then a swing trading approach would expect an upwards swing to continue from here to end only when Stochastics reaches overbought and price reaches resistance at the same time.
VOLATILITY – INVERTED VIX MONTHLY CHART
Click chart to enlarge. Chart courtesy of StockCharts.com.
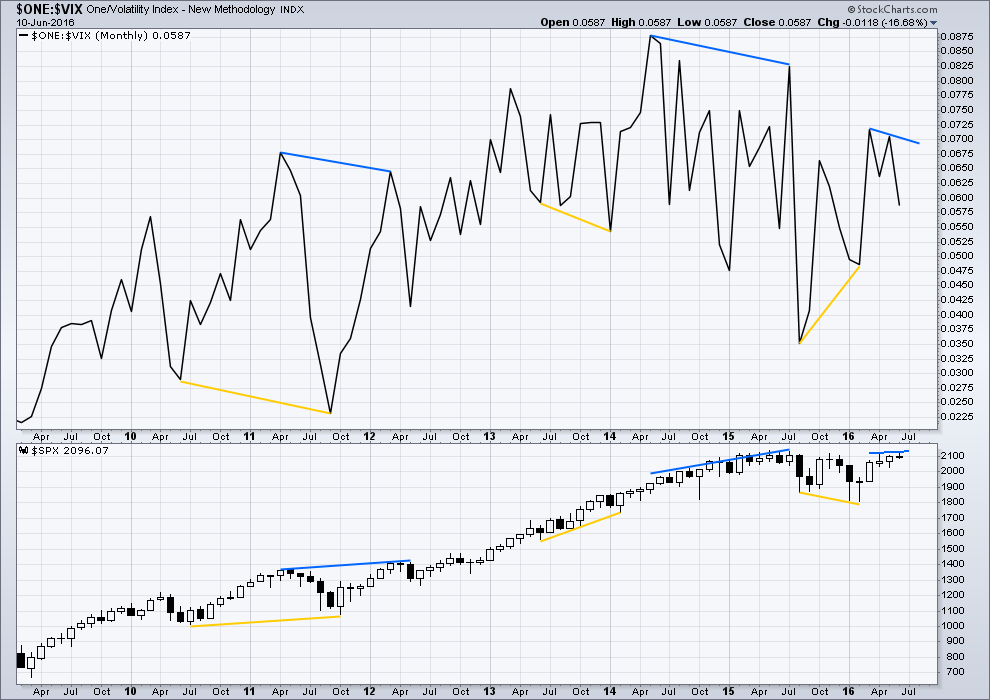
Several instances of large divergence between price and VIX (inverted) are noted here. Blue is bearish divergence and yellow is bullish divergence (rather than red and green, for our colour blind members).
Volatility declines as inverted VIX rises, which is normal for a bull market. Volatility increases as inverted VIX declines, which is normal for a bear market. Each time there is strong multi month divergence between price and VIX, it was followed by a strong movement from price: bearish divergence was followed by a fall in price and bullish divergence was followed by a rise in price.
There is still current multi month divergence between price and VIX: from the high in April 2016 price has made new highs in the last few days but VIX has failed so far to follow with new highs. This regular bearish divergence still indicates weakness in price.
VOLATILITY – INVERTED VIX DAILY CHART
Click chart to enlarge. Chart courtesy of StockCharts.com.
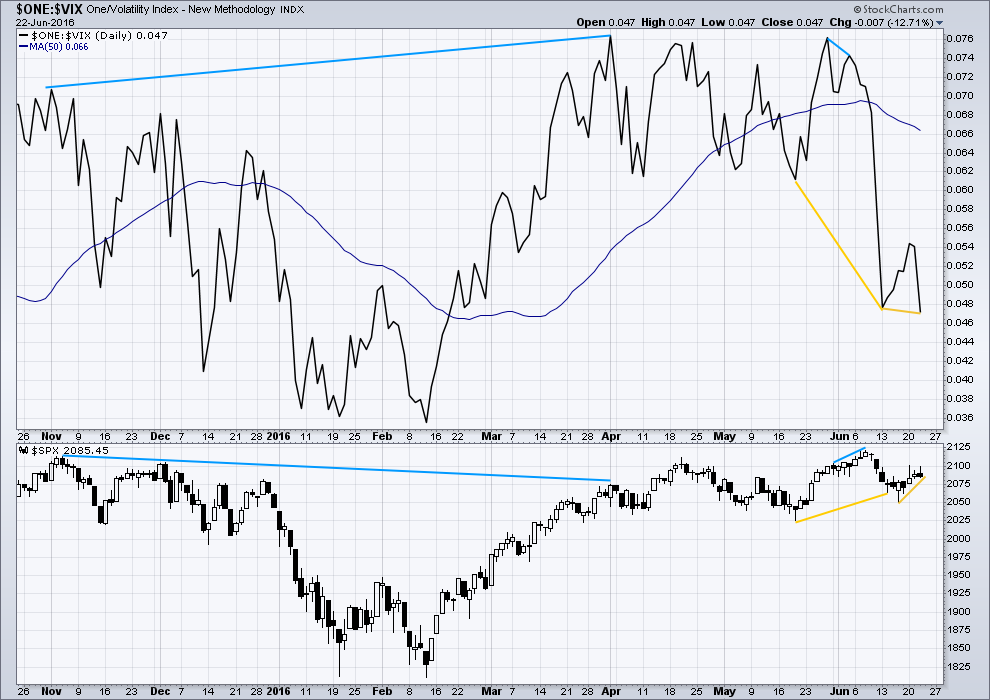
There is now only one instance of hidden bearish divergence noted on this daily chart of price and VIX (blue lines). VIX makes higher highs as price makes lower highs. The decline in volatility is not matched by a corresponding rise in price. Price is weak.
VIX (inverted) has run away strongly from price. Volatility sharply increased beyond the prior point of 19th May (yellow lines) while price fell.
A divergence 101 interpretation of this is bullish. Volatility is stronger than it was on 19th of May, but this has not translated into a corresponding new low for price. Price is weak. Some upwards reaction would be a reasonable expectation about here to resolve this divergence. At this stage, it looks like that interpretation was correct as it has been followed by some upwards movement from price.
Price fell after the short term bearish divergence noted here (short blue lines). Now, after short term bullish divergence (yellow lines), price is rising.
The last two yellow lines indicate hidden bullish divergence now between price and VIX. Inverted VIX today moved lower; volatility increased as price moved lower. However, volatility is now stronger than it was a few days ago yet price has not made a corresponding new low. Price is weak. This divergence is strong and may require more than one day of upwards movement from price to resolve it. It may be resolved after a few days of upwards movement with small range and slow movement.
While I would not give much weight to divergence between price and many oscillators, such as Stochastics, I will give weight to divergence between price and VIX. Analysis of the monthly chart for the last year and a half shows it to be fairly reliable.
BREADTH – ADVANCE DECLINE LINE
Click chart to enlarge. Chart courtesy of StockCharts.com.
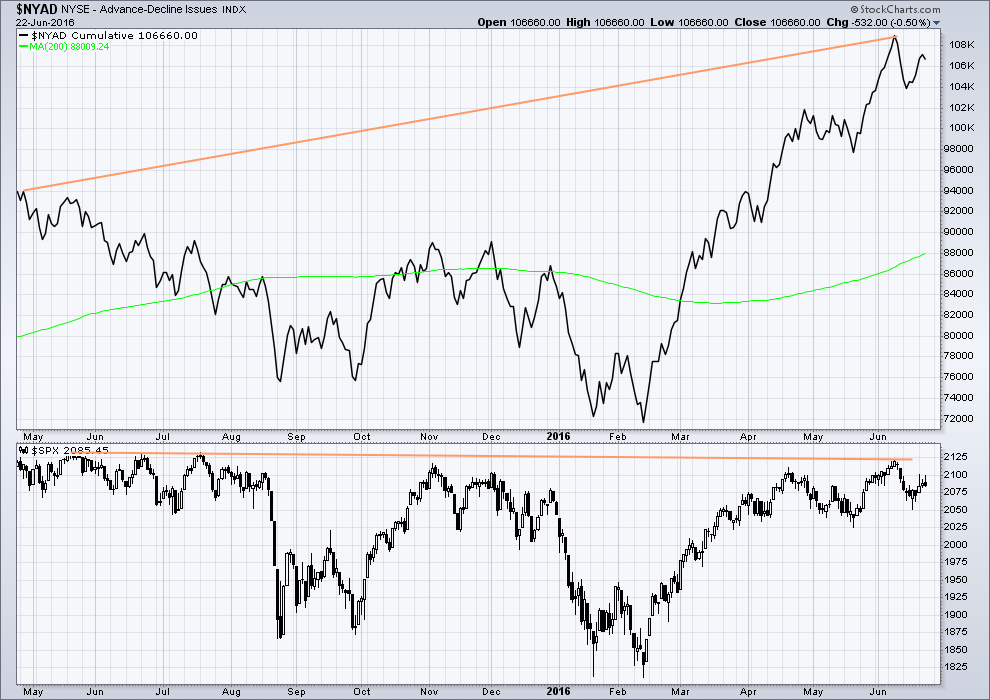
With the AD line increasing, this indicates the number of advancing stocks exceeds the number of declining stocks. This indicates that there is breadth to prior upwards movement.
Taking a look at the bigger picture back to and including the all time high on May 2015, the AD line is making substantial new highs but price so far has not. While market breadth is increasing beyond the point it was at in May 2015, this has not translated (yet) into a corresponding rise in price. Price is weak. This is hidden bearish divergence.
DOW THEORY
The last major lows within the bull market are noted below. Both the industrials and transportation indicies have closed below these price points on a daily closing basis; original Dow Theory has confirmed a bear market. By adding in the S&P500 and Nasdaq a modified Dow Theory has not confirmed a new bear market.
Within the new bear market, major highs are noted. For original Dow Theory to confirm the end of the current bear market and the start of a new bull market, the transportation index needs to confirm. It has not done so yet.
Major lows within the prior bull market:
DJIA: 15,855.12 (15th October, 2014) – closed below on 25th August, 2015.
DJT: 7,700.49 (12th October, 2014) – closed below on 24th August, 2015.
S&P500: 1,821.61 (15th October, 2014) – has not closed below this point yet.
Nasdaq: 4,117.84 (15th October, 2014) – has not closed below this point yet.
Major highs within the new bear market:
DJIA: 17,977.85 (4th November, 2015) – closed above on 18th April, 2016.
DJT: 8,358.20 (20th November, 2015) – has not closed above this point yet.
S&P500: 2,116.48 (3rd Nobember, 2015) – has now closed above this point on 8th June, 2016.
Nasdaq: 5,176.77 (2nd December, 2015) – has not closed above this point yet.
It is a reasonable conclusion that the indices are currently in a bear market. The trend remains the same until proven otherwise. Dow Theory is one of the oldest and simplest of all technical analysis methods. It is often accused of being late because it requires huge price movements to confirm a change from bull to bear. In this instance, it is interesting that so many analysts remain bullish while Dow Theory has confirmed a bear market. It is my personal opinion that Dow Theory should not be accused of being late as it seems to be ignored when it does not give the conclusion so many analysts want to see.
This analysis is published @ 01:32 a.m. EST on 23rd June, 2016.
OMG!!!!!!!
I have just woke up and checked my positions 🙂
I had to walk away from the screens last night as I was up to my nuts in leverage and the red in my account was making me queasy.
Now i see another red, Red candles 🙂
This day, this beautiful, special day has been the single biggest payday in my trading career. Admittedly I pressed it hard, and far harder than the normal risk parameters would allow but if you have conviction…. well ya gotta go for it.
But right now I could have been taking a very unpleasant bath if my counts/ideas were wrong… so that was the risk.
Experience tells me now that a break is due…So I’m going to take some time off to spend with the family and let my head unwind.
Hope everyone got paid and enjoys this historic and epic day!!
GLTA
Yep. It is not often you see six figure swings in your trading account! Jiminy Cricket!! 🙂 🙂 🙂
Price limits on the SnP500
http://www.cmegroup.com/trading/equity-index/faq-sp-500-price-limits.html
US futures markets suspended for 15 minutes due to ‘ circuit breakers’.
How will prices resume….?
This is weird. I do not trade futures but I just peeked at a few of my trading accounts and although the markets are closed, some of those positions have put on a bit of weight already!
What’s up with that?! 🙂
Yep – my positions have also put on a bit of ‘timber’. GBP is going where EW predicted over a year ago (ok maybe a bit faster than I thought it would – but nice impulse 🙂 ).
Olga… Did you do that dance yet?
Oh yes….
30% Down in ONE DAY!
EDIT: What???
It has happened Before! Why can’t it happen again?
so how to play this tomorrow? what can we expect next week? bounce to where? drop to where on SPX?
Ok, this /ES drop is starting to look scary… And USD/JPY now predicting SPX < 1700 on the Weekly.
Can you believe it? They are already trotting out the clowns to lament about how terrible a day it is for Britain and the EU…Boo! Hoo! Hoo!
I am so surprised at the Scots. I am going to have to revisit my thesis: “If it is not Scottish, it’s CRAP!” 🙂
How Typical of them. They should throw all of them out of office!
I bet the Scotts are wishing they left the UK in their last referendum…
then they could have stayed in the EU
🙂
Yep – the next Scottish leaving UK vote should allow a ‘kick out the Scots’ vote to everyone else (imho). 🙂
Clearly there were plenty that voted leave – maybe they should move south?
is Lara redoing her analysis?
She is probably viewing her shorts… I believe she stayed short.
I did indeed 🙂
The waves are too big to chart! 🙂
There were waves but I couldn’t surf today 🙁 I spent the day in the car. But I’m happy that members are happy, and I’m happy to have a positive position today.
Looking forward to her latest analysis! 🙂
#victorylap
Not until the next session has completed. But I will be up early in my morning to give you an updated chart before NY closes next session. My analysis is using data from the NY session only, data comes from COMEX. So far it shows nothing new, so I can’t update it yet. I’m figuring it will gap open down.
Forum Question.
“Where does UVXY open tomorrow?”
Prize for closest guess is a genuine Unicorn horn! 🙂
27
From your mouth to God’s ears my friend. We are in that case talkin’ ’bout some VERY serious numbers! YEOW! 🙂
Dang, kicking myself for buying 1/4 size UVXY position today – chicken!
That said, my bet is uvxy opens at 14.75
Dunno – but my holiday in Ibiza (along with eyeball vodka shots) booked 🙂
untz untz untz…
will you be taking body shots???
🙂
I am looking at what is going to be the second biggest trade of the year. The biggest is going to be when the Unicorn next kisses the sky! 🙂
do you mean you’ll be shorting it when it goes way above the BB’s???
Shorting the unicorn on a spike would be a sweet trade, if the brokers/markets would do it.
Gold up by 7%
I closed my gold short today. Whew!!! 🙂
There is a way to do it right. I will post my entry on the forum.
Like there is no tomorrow. It is, I would have you know my good man, My SIGNATURE trade! 🙂
Agreed – I had no clue what would happen tonight nor needed to.
As stated earlier – In EW I (and a few others) trust 🙂
Kudos to Lara – I have said many times and will say again that in the face of so much strong emotion, to interact with subscribers is an absolute credit to her genius.
Thank you very much Olga. It’s been a hugely stressful day actually, and nothing to do with members or markets. A very long drive….
I’m looking forward to logging in after some sleep and seeing happy members.
I only hope others weren’t whipsawed out by that spike up before the plummet, and didn’t jump right back in.
I say open at 12.92… and def fill the gap from June 17 (13.92).
But that would be over a 30% move up, and that’s a lot.
Who knows what the banksters will do from now until market open tomorrow to salvage the market while we’re sleeping…
VIX is currently up 50%. If this holds, with UVXY double, it is at least 19
OMG!
I bought $12.50 calls with one minute left to market close today for 1.00 (expire July 1) 🙂
I’ll be doing a happy dance if it goes to 19…
That would be a 7 bagger… at least…
Ari,
I am sitting on rather large $9.50 calls for unicorn myself.
The key is when to close it…
To keep until next week, or not to keep?
My calls expire next Friday… But I have a feeling the market fall will carry over to Monday at least. But all the governments and central bankers will try to calm the markets over the wknd…
Let me formally welcome you to the very exclusive ten-bagger society. (TBS)
People sometimes tell me I’m full of it when I talk about those trades. Nice timing! 🙂
UVXY is a very strange beast. In this kind of environment its moves are not arithmetic, they are geometric! You all might be surprised if you have not seen it in action…
So what is your best guess of the open tomorrow for UVXY???
Consider the short interest on UVXY?
I have not checked. I am quite confident a lot of weak hands were violently shaken out today. I too was shaken, but not stirred! 🙂
I am expecting at least a double… 🙂
So I might become part of the TBS club tomorrow…
Looking forward to it…
Vern,
Hope you are right and please keep us posted on UVXY and TVIX. I also shorted emini (700 shares ) into the close so can wait out on those to play.
This is the black swan event not easily contained.
32
Here we go again…. ES at a new low of 2006
A NEW 90 Day LOW!
Does this give new meaning to the expression: “Expect surprises to the donwside!”?
Puts for option traders are going to be prohibitive for those not already positioned.
Holy cow! 2009.25
ES at a new low of 2003
DOW YM down 662
Whaaaat??!! Are you serious??!!
Holy Moley! 675.00!!!
There is a real possibility of circuit breakers being triggered today…
Now this will be a real GAP and GO!
I feel back for all those that got sucked into going long over the last few weeks!
BTW… ES volume appears to be higher all night than during normal trading hours today!
A very stern correction is in order Joe my good friend.
Please refer to the upcoming event as:
GAP AND GONE! 🙂 🙂 🙂
BBC: FTSE down 8%
vs ES 3.93% down
see the Nikkei? Edit: down 8%
BBC officially calling it! Brexit vote is Leave!
Final estimate 52% Leave 48% Stay
Leave is Called… No way Remain can now win!
LEAVE WINS… PROJECTED WINNER!!!!! By BBC News!!!
Congratulations to UK Citizens!
What a great day for the UK! About 800,000 ahead for leave.
I just thought I’d take a look at what is happening. All I can say is “WOW!” If it keeps going this way the DJIA will open down a thousand points.
If you have to ask if it is a third wave, it is not.
I don’t have to ask.
Word! 🙂
Bam!
Nigel Farage thinks Leave will now win… giving a speech
Claiming Independence Day…. UK now has it’s own 4th of July.
Congratulations to UK Citizens!
Wow… 30 Year UST Bond Yielding 2.352% UP 4 & 9/32nds
Japan Equities down 3%+ across the board
ES at a new low of 2023.25
This is this is truly third wave machismo – I am looking for double round number demolition.
Nobody will be asking: “Are we there yet?”
It’s been a long time coming, and what an irony to show up immediately after some of the most brutal bankster bullying I have seen in quite some time…what goes around… 🙂
Yes! Payback time!
Looking for Asian to pick up some downwards momentum.
Birmingham results about to be announced 700K+ votes cast!
This may close the deal!
Leave now ahead by 500k!
There is a whole lotta turding and forting going on in Brussels…. 🙂 🙂 🙂
How appropriate. DJIA futures down by 500! 🙂
Currencies are going nuts!
I bought a straddle on the VIX a week prior. That should prove effective 🙂
For the first time ever I’m sorry that I’m not trading futures. What a ride!
Its starting to look like Britain will have its own 4th of July. Congratulations, Britans! The modern day battle for freedom has just begun, and you are firing the first shot!
It’s nearly 4am and I’m still up watching this! I’m going to be so tired at work tomorrow but this is so much fun 🙂
OMG–you’re going to work with no sleep tomorrow? Glad I live in a 5 hour later timezone.
Looking for UVXY BBs to explode tomorrow. I think we will have at least a few days of trading before we blow out the top.
Held my nose and bought a 1/4 size UVXY position at the close.
Too small (in retrospect) but good to have a foot in the door. 🙂
Today was a very difficult trading day for me personally.
I saw that huge unusual VIX candle on Wednesday and suspected something big was up. I nonetheless planned on hedging my big UVXY long position with a one point spread which I could cash in on the bounce I was expecting and add to my long position. Well, in a moment of inattention due to failure to look at the buy/sell window, I doubled my long position instead of hedging it. Yep! I know some of you have been there.
Well, I was not at all too comfortable with that situation but I though I could defend it if I had to, and boy did I have to! I defended the position with a series of bearish put spreads as the market rocketed higher and kept cashing in the puts as they kept going deep in the money. While the damage from the explosive upside move was pretty well contained, I had to decide if I wanted to take a loss on my long position, or stick with my conviction and take assignment of the shares. It was very tough, but I decided to call the banksters.
bluff.
I do not recommend it unless you can live to fight another day if you are wrong. 🙂
Oh my! A third of a third down in futures. SPX 2050 is toast!
ES now at 2044 a new low for the night.
ES almost at a 6 Day Low of 2040.75
ES now at 2025 a new low for the night. new 6 day low
Here we go again…
ES now at 2031
ES almost at a 34 Day Low of 2022
ES almost at a 90 Day Low of 2012.25
ES now at 2028
DOW YM Down 560
hoping “leave” wins….but many LARGE districts have yet to report yet.
Don’t want to jinx it, but I think leave might get it. Almost all the main remain regions have declared their vote and leave still well ahead.
If leave wins, it will be the first time in a *very* long time I am proud to be British.
I’m already very proud that alot more people than I imagined have not bought the propaganda peddled to them. It is easy for us guys that follow markets / events every day to see through the rubbish – takes a bit more effort for your average joe.
Imo today was good for democracy irrespective the result. The tide is turning – I don’t think this will end here.
The markets agree with your assessment. I think this thing is over. I too am proud to be a B.V.Islander today! 🙂
And quite rightly so Mr Carty 🙂
what are your taxes there? (B.V.I.)
I am not there currently, but corporate taxes are zero.
Employees pay 8% into a retirement fund (4% contributed by employer) real estate taxes are miniscule (350.00 US on a 2 million dollar residence), there is 5.00 departure tax by ferry, and a 15.00 dollar departure tax by air, If you are not a resident (“belonger”) buying real estate will cost you 10% transfer fee. There are no sales taxes of any kind on the island. There are various and sundry “stamp duty” charges for certain imports and other transactions I am not very familiar with.
0% 😉
EDIT – I stand corrected Verne – 0.001% lol 🙂
As you know I lived there for a while – great place imo
Which island do you live on?
cheering all the way for a leave, but the BBC index on the wall chart shows some very large districts to come in yet.
I hope all the apparatchiks in the EU cabal can see the hand writing on the wall. Knowing them, they are going to try and savage the UK to try and make and example of them. There may have to be new leadership chosen. They will also become even more heavy-handed with the remaining members. I heard one arrogant EU lawyer bleating about how the referendum “should not have been allowed”! Let’s hope this is the first of many dominoes to fall in this despicable and abusive construct.
BBC Live
http://www.bbc.com/news/uk-36559505
In a massive display of bearish brawn, the bears drove SPX futures down to the exact pivot of 2050. While anything could transpire overnight, that is a level worth watching. If that first move down was just wave one in a developing impulse, folks long the market are in serious trouble…
Leave could pull this off.
If that happens, then the waterfall open. Yea. 🙂
Remain has clawed into the lead at 50.7% and with it the ES has recovered…
wait, now Leave has edged up and the ES is down.
Good god this is like a horserace with the hugest odds.
The end result is likely to be very, very close.
Leave is ahead again!
England, with by far the biggest population of the UK nations, is solidly Brexit.
Other than London of course.
Was it the bears’ strategy to let the banksters shoot their wad during the regular session then ambush ’em in the futures market?! They burned a lot of capital today for certain and they don’t look to be about to take being slammed to the pavement by the bears overnight lying down, so to speak. I have to say, the bears are indeed flexing some very grizzly muscle!
When was the last time you saw futures in DJIA down 300 points?
It could be a long night…!
They had better not let it get down 500 points or there won’t be much to do tomorrow now will there?!
On second thought, I could probably think of a thing or two…hundred ! 🙂
The money the London banks must be spending in ES futures trading must be mind boggling!
respectfully, this is all computers reacting to online key word algo searches.. tomorrow we will be lamenting how we were down to 2050 on the ES yet happened to gap up to ATH on news REMAIN won the vote. and we will chalk it up to an expanded flat correction or something crazy like that. There is too much sophistication in the algos that won’t allow the market to go and stay down longer than a few weeks.
And what exactly are you smoking?! 😀
🙂 🙂 🙂
Anybody watching futures?
I hate to say it (no I don’t! 🙂 ) but I knew that was where the other shoe would drop.
And here I was, sweating bullets over those 5,000.00 UVXY shares I was going to get assigned on Saturday!
Whoever generated that fat VIX candle on Wednesday looks about to takes the banksters to the woodshed sans their shorts (pun intended!)
S&P down over 43 points now…
i still think we open green…..
You are most welcome to trade that plan!
Let me know how it works out…. 🙂
If Leave eeks out a win – it could be the summer blockbuster we’ve been waiting for.
ES almost at a 6 Day Low of 2040.75
ES made a low of 2049.50 after the high of 2119.50 just before the results started to come in.
WOW what a swing! A Swing of 70 points!
Down 40 plus handles at the moment
230 comments today! That has to be a record…
I see from the BBC – Leave is ahead slightly!
Great to see results breakdown, England is very strong Leave.
Wow – exciting!
I think we should start our own EW volatility index based on the number of daily Lara blog comments 🙂 Could be predictive 😉
Definitely! 🙂
It is sometimes fascinating to speculate about what goes on in markets behind the scenes.
We retail investors and traders are after all only very small fish in a very large pond.
On Wednesday the SPX posted a monster VIX candle.
This was no ordinary VIX capitulation candle at the end of a protracted downtrend, with the classic long upper wick and 20- 50% close below the intra-day high.
Some entity, or entities, placed gigantic short side bets in the market to generate that big fat green cucumber. You just don’t see them that often. As I posted yesterday, the last one like it was on January 13 of this year.
Make no mistake about it; despite all the blather about the proximate cause of the Brexit vote being accounting for the massive run-up today, or even the speculation about short covering, what we saw today was singular.
Namely, a spectacular display of bankster brinksmanship, intended to absolutely crush that short position, executed on Wednesday. EW theory does not believe that news drives markets, sentiment does.
Some entity, or entities, was perhaps convinced that the Brexit vote would be a bust for the Bremainers, and put their money where there instincts were. The banksters were determined to squelch such audacity; yes, even ahead of the outcome. Retail investors cannot afford to be that loosey goosey with their cash. And that is just one very small person’s perspective on the dramatic events today.
Who will win that throw-down??!
The jury is still out.
We do however, have some glimmers of the potential perils of counting your Brexit chickens before they are hatched! Cheerio!
All the London Banks have been looking for office space in Frankfort 🙂
ES just made a new low of 2084 after the high of 2119.50
ES now a low of 2080
ES now a low of 2049.50
ym DOWN 330
WOW!
Amazing to see the futures dive like that!
Wow, truly amazing to witness this happening. A revolution!
Possibly a THIRD WAVE?!! 🙂 🙂 🙂
EU Referendum Results (auto update)
http://www.bbc.com/news/politics/eu_referendum/results
Is everyone bullish or still bearish now?
I’m still on the fence
I’ve entered another short about an hour ago. Stop just above ATH.
8:03:01 pm Kim Fox
FTSE 100 Index Futures Extend Loss to 2%
This will all reverse by the open. If I were in futures I’d be taking profits here.
As Yogi said, it is very difficult to make predictions, especially about the future!
We trade what we see… 🙂
You all should watch the BBC news network they are doing a fantastic job covering the vote… They are comparing what the vote was expected to do for each voting area vs the actual results as it comes in.
Just great! Then keep your ES screen up as they announce the results. Its fun. More fun than I had watching the markets the last few weeks.
S&P futures now down 8 points on bloomberg
ES made a high of 2119.50 rights before the results and a Low of 2088 after one big leave result.
Now at 2096
Another 61% Leave and 39% stay result just in.
All the pre-vote blather about how the “Bremain” vote was in the lead and would win the day had me thinking about the classic line from “Porgy and Bess” – “It ain’t necessarily so!”
What do you expect from professional liars?
Futures down 3% would be – ” (I feel) All right…uh huh!” 🙂
There is talk of up to 70% leave in some areas but results not confirmed yet!
Sure hope “leave” wins for the freedom of the people
The Spin Doctors are already complaining that the EU was cast as a scapegoat!
Sounds to me the UK pol elite starting to panic… Leave vote is doing much better than expected and maybe that Leave can pull it out and win.
“Leave vote much stronger than expected!”
I’ll be bustin some crazy super happy dancing moves if leave wins. Kevin’s UVXY break dance sounds good to me – will knock out a few ‘windmills’ and ‘headspins’ lol 🙂
wow,, video?
LOL
Olga,
Same here holding a tight but if leave wins, it warrants a dance or two after drinks :0)
Wow – futures just dropped sharply. Still waaay too early for my UVXY break dance.
Only 5/382 results in so a long way to go yet.
But with those 5, Leave leads 50.5% vs Remain 49.5%
Its going to be like that all night. Much closer than the world was lead to believe…
Yea but… I am watching BBC and saying where Remain should have been strong is very close and/or leave outright won. These are from reported results.
now those are some tasty lookin red footlongs
Is it going down or up? Im confused
Apgar,, red footlongs are red candlesticks on the chart,, down.
I mean what is the general consensus at this time with everyone, bullish or bearish?
The gbp tanked big on the Sunderland vote results with a high brexit vote! Things are looking volatile!
There is also talk of 10 million plus postal votes and they estimate the majority to be brexit.
UVXY turned around rather quickly (atm) 🙂
GBP:USD just dropped from 1.50 to 1.44!
I like trading volatility but this is too much for me!
Suprise result just announced for Sunderland 69% out. Leave currently in the lead.
Olga,
Bloomberg just flashed the same news and if this trend continues, markets will have a real problem on their hands tomorrow. Stuart will be glad to have made those trades 🙂
how you likin Sunderland ? nice place?
Na – terrible place. But very nice people (as are most people for North East).
Used to play there with my band back in the day. Had some good laughs there 🙂
This moment in history pertaining to Brexit reminds me of the story of Baron Nathan Mayer Rothschild and Waterloo, sure most of you know it. But for the younger here: Rothschild first did the opposite, selling shares, when he learned the British won the battle. The stock market was abound that “Rothschild was selling” leading everyone to believe the battle of Waterloo was lost. Shares tanked, then Rothschild stepped in and bought and bought and bought. Wellington’s messengers arrived shortly thereafter announcing the battle was won and the markets skyrocketed. Rothschild made a fortune in a few hours. Are the hedge funds of the UK the Rothschild of today? (in reverse) They were permitted by law I understand to conduct exit polling, but not allowed to announce it until later.
Newcastle Vote in:
50.70% Remain
49.30% Leave
They say that remain should have been won with a higher %… in this district. SO it will be a very close vote overall.
ES has broken spike up! High 2119.50 and now at 2107.
ES NOW…2088
Big leave vote just came in and pounded ES
Now Farage Denies Conceding: “We Haven’t Had A Single Bloody Vote Counted”
Turn OUT was 70 to 76%… that high of a turn out was suppose to favor Leave.
Yep I suspected so – propaganda galore.
hit the first target up, closing long e-minis just now. On SPX another target is 2134.55.
Lara – I’m keeping my bear shoes on but to confirm … S&P 2135 changes the wave count to upward and onward 2500??
Yes. A new ATH and the bear is well and truly dead.
A third wave up would then be expected to be underway.
This is after hours Lara…so it won’t count on the index. If you’re turning bullish, it can only mean one thing…. we all know that this means minor 2 is now in and down. Minor 3 wave down is on deck and next?! 😉
I wasn’t turning bullish, just answering a question with a straight answer 🙂
My trades were still short.
Right now….. As it sits….
Even WITH the rain in England earlier today….
I’m prepping for a post mortem…
Remember they will most likely sell the news, regardless of outcome. Take away all the news and just look at technicals. It screams to me we are overbought.
Thanks QV 🙂
Still holding, totally sh*tting myself, but holding 🙂
Same here Stuart, this is as far as I stretch it, even added to short position. Been very choppy for so long….not really the action of a wave 3 up. Soooo, I remain committed.
I have had a strange feeling in my stomach all day today so I kept my shorts on….
52% Remain
48% Leave
Poll of 5,000 people.
Exit poll that not really an exit poll.
Some Govt. official thinks “Remain edges out leave” not sure what this is based on.
Any currency people here? What’s happened since 5PM when this poll was released.
Watching UK news now – vote closed – very high turnout and Nigel Farage stating he thinks Remain might have just about won it. 58% Stay 42% Leave
Not sure how the heck he would know yet (sure everybody knows but Farage is leave). Very strange that he would make such an early statement (unless is propaganda – reported he said that, not direct from horses mouth).
if we were to open right here, main count would be invalidated (i know, after and premarket does not count)
5 min to exit poll that is not really an exit poll. Will be 1st indication of vote.
ES 5:00PM Close 2013.25
old proverb – buy the rumour-sell the news 🙂
“I think the market jumped the gun,” said Gennadiy Goldberg, an interest-rate strategist at TD Securities LLC in New York, one of 23 primary dealers that trade with the Federal Reserve. “Today’s market move is what I would have expected from a ‘Remain’ win tomorrow.”
Futures rising already, looks like the FTSE will break 6400 soon. Am net long at the moment with stops at above open on all positions. When (not if) the 3rd wave arrives I plan to let them close and hope to ride the the shorts that are underwater 🙂
Well at least thats the plan
So I don’t listen to the talking heads, pretty much none of them. I have subscribed to Lowry’s, solid TA, and I do watch the odd video from Ciovacco Capital.
That’s about it.
So I’m asking members who do listen, what do you think the consensus is? Markets to rocket up when the Brexit vote is released?
I’m thinking about the psychology of a second wave correction here. Remember back in early June when the last high was made, how at that high many bears turned bullish. That should be happening again now with another deep second wave correction. I like this little indicator because it’s updated daily. Today greed at 74. I think it needs to get more extreme before a high is in place.
And when I begin to doubt myself…. then it’s working on me too!
Have to keep thinking, what if? What if I’m wrong? What else could it be?
I had to turn it off ~ 4:05 … but before I did, I posted…
Wow… Bulls are falling all over themselves and are all Very Giddy!
I think, from what I heard all day most are expecting a big rally with a vote to stay in. I think we already got that rally.
All these Fast money guys looking for higher prices with stay vote… even with move today.
So, what happens if the vote is to leave? With all the “news” pro remain I’m wondering if the Brits will be a bit contrary and vote to leave. Theoretically that could send the markets plummeting… but then we are expecting a third wave so….
Right now they all think it’s stay based in two indications revealed after 5PM… The Vote Closed at 5PM… so its over.
Nigel Farage Says That “Remain Will Edge It” as Sterling Soars… Not sure what he knows or if off this same poll.
and
52% Remain
48% Leave
Poll of 5,000 people.
Exit poll that not really an exit poll taken before end of vote today.
Leave would be a 100% complete surprise at this point.
I think the rally is already backed in… but ES just put in a high of 2116 after 6PM and reversed so far to 2114.25… SO????
Market will sell off, regardless of vote IMO. I subscribe to sell the news theory. If they stay, market will sell off, if they exit…market will crash.
All my oscillators are over bought…on multiple time frames, except Daily…has room to the upside, but rarely do I get all them to jive at once.
Right now i believe this 100% QV.
Regardless of outcome, there is a sell off.
Market will let me know if I’m wrong 🙂
I think a remain result is now baked in – leave result and the market will drop through the floor. Imho risk is to the downside atm.
I agree with Stuart that piling on the short side here is certainly not the easiest trade – but then… the best trades I have ever made felt totally wrong.
….add to that, the bond market doesn’t believe we are in a bull market either.
I can’t remember a time that the bond market has been wrong.
They are biding ES higher in after hours 2110 so far.
A huge decline in volatility today as price moved higher.
Enough I think to resolve the divergence I saw yesterday? Or maybe one more upwards day first?
Ok then…. here we go….Just added heavily to shorts and took a deep breath.
Still under key invalidation and at a serious inflection point. If you are an EW believer then this is the point to get aggressively short, not on the lows, but right here, right now.
Risky Whiskey indeed, but that’s where this trader is right now. This is not a “sleep easy” trade, so this is what i will be watching first:
1) Sky news will at just after 10pm issue an exit poll (not an official or large survey) – so maybe some market movement
2) In terms of actual results Sunderland prides itself on a fast count and is expected to be the first declared result at around 12:20 UK time – given its demographic likely to be ‘leave’ Most of the North in that boat i suspect.
3) It rained in England today, and because folks there don’t generally enjoy rain it may well have deterred the undecided/light loafered “remainers” away, only for the polling booths to be filled with die hard Brexiters.
Of course, EW doesn’t care for events or news, so 1) and 2) and 3) above don’t actually matter….but if the counts/ideas are right, then I’m hoping the risk will translate into profits and I’ll be able to relax and enjoy the weekend instead of doing a post mortem on where i went wrong…
GLTA… and more deep breaths…
“It rained in England today”
Ha ha ha ha ha ha
Doesn’t it always rain in England?
Sorry Stuart, had a big laugh at that one.
as you were…
🙂 Lara
Yeah, rains a lot in England. Not as much as where I am though…
A day with fog/mist or is otherwise so muggy you can see the sky is normal…And those are the good days.
Scotland then…?? 🙂
Try living in Raincouver (Vancouver) people here run and hide when that glowing orb in the sky appears
LOL or Fiordland. I don’t live there obviously, but have visited a couple of times. Always rains.
Gotta love gore tex
Stuart,
Sounds like a plan as I picked partial position on e mini into the close…
Now shutting off and relaxing till 5:00AM EST to see the futures…
There is a Poll coming out at 5PM ET…. supposed to be like an exit poll but not exactly an exit poll. 27 min away.
If this short play doesn’t work out to plan then the scary part (for me) is that I see nothing else other than an impulse from Feb lows AND a wave 2 has already completed and that we are already in the early days of a third wave to the upside…
That’s not where my money is right now but it’s one place my mind is right now 🙂
Rodney asks waaaaay below, what happens to the wave count if there’s a new ATH?
The bear is dead if that happens. Well and truly. The only wave count there would be would be the bull, target 2,500.
Actually it was Paresh who asked and I gave a somewhat muted response saying I leave the counts up to Lara.
OK, thanks Rodney
Dammit!!
Talk about feeling like the biggest goof not trading long this brexit market through the morning … easy money!
Me too. I kept my trading station open all day yesterday watching after hours movement, intending to close my lower short and open a long to hedge.
And I didn’t. Too distracted by so many other things going on.
Kicking myself now.
Oh well. There’s always another opportunity.
Holding onto my shorts, stops just above 2,120.55
The ramp job of all ramp jobs. The issue with the UK is M2 money supply. They need need to exit.
Bought 25% UVXY @ 10.00 after hours. In EW we (or at least I and a few others) trust 🙂
I will stand with EW Bear Count by Lara too!
Higher prices (NH’s) just doesn’t make any sense whatsoever, that’s with everything I know and have experienced in my 56 years… no sense… NONE… NADA! No way! No how! NOPE!
Perfect time for 30% down… in one day!
EDIT: What???
It may happen… you never know! It’s happened before.
Now 9.59
Still a bit more dry powder… Another purchase lined up if it reaches 9.00
Wonderful. I do so hope I’m right, but then hope isn’t a trading strategy is it 🙂
A little added confidence to know that you with your experience are still expecting the same movement I’m expecting.
I keep looking at the bear count and trying to see a scenario where price could move above 2,120.55 and the wave count would make sense. The only scenario I can see is Peter’s ending diagonal. Posting chart now.
IMO it just looks all wrong with intermediate (C) breaking below the channel… but now again returning….
EUFN up just about 4.5%. Nice pop!
Lots of short covering at the close.
Updated hourly chart.
I’m reminded of the storm in a teacup* that was the Greece crisis.
And as someone points out below, news is usually factored into the market before it’s announced.
So I’d be expecting some movement upon release of the Brexit vote, but not a whole lot.
*edit: in regards to market movement that is, not how it affected the Greeks.
Shaking the trees! 🙂
Parabolic! The gap up tomorrow will likely be insane…
Are you in then?? 🙂
Heck no! Tomorrow could go either way… I just want to get through this craziness 🙂
After hours price spikes downward, they have been fairly predictive of selling off.
Spikes go down to SPY 209.4.
SPY is current spiking much higher.
SPX keeps going higher… so STAY in EURO is now baked in.
Wow… Bulls are falling all over themselves and are all Very Giddy!
This site is saying there is 54,000 employees/staff/workers for the EU….and the site is dated!
http://openeuropeblog.blogspot.com/2007/01/how-many-people-work-for-eu.html
I think we need one more move up….
I agree. Maybe an ending diagonal unfolding?
seeing the same time and sales action as I did yesterday in the ES…. craziness. I’m flat, gonna stay flat until tomorrow. Even though I have this BIG urge to short this thing going into the close.
Hedge funds will start to publish exit polls right after the markets close as they were not allowed to share the information till 10:00 PM BST but could trade based on it…:)
Step right up… place your bets… What’s it going to be?
Last hour!
seeing a little bullish flag on the 1 hour chart, not much time left though
Someone on this board placed cycle dates here about a week ago. I can’t remember who, but I wrote the dates down. They were; 6/23. 7/5, and 7/14.
This is playing out so far, with today as the possible cycle high at 6/23.
Many thanks to whomever shared that info.
Philip June 14, 2016 at 5:52 am
Andy Pancholi Special Report (free video)
http://cyclesanalysis.evsuite.com/mtr-brexit-video-optimized/
“FUTURE TURN POINTS”
June 23
July 01/05
July 14/15 – “really, really important”
______________________________________________________
the July14/15 “really, really important” turn cited by Pancholi could well be a July 18/19 high…Pancholi may be a trading day or so early…
Daniel Ferrera also identified June 23 as a key date linked to the May 2015 high…
Philip,
A number of other analyst have highlight highs hitting end of month or early july followed by an interim low than ramp into October before the final fall starts in fall 2016.
Make a note of July 18/19 and August 5/8 on your calendar…
when do the other analysts expect the market to hit “an interim low”?
Main count – June 29, July 25 and much larger drop by Nov 1, 2016
Alternate count – June 24, July 20, and Nov 1, 2016
VIX stealthily creeping higher. Long lower wick saying “I’m not quite done!” 🙂
40,000 people work in Brussels for the EURO Bureaucracy making huge salaries and living large… WOW!
Now you know why all the SCARE tactics being employed against the BREXT Leave view.
Hey UK is that what you really want to be part of… that group sucking every last drop of your blood??????????????
40K???!!!!
I almost just lost my lunch! I knew it was bad, but not that bad!
Lord help the Brits if they voluntarily sling that albatross around their necks.
I just heard a piece from a reporter in Brussels on cnbc. That is what they said. 40,000 people… all the big wigs have huge staffs.
You think there is any duplication in that mess wasting a TON of money???
That whole group is UN-ELECTED to boot! That group will rule the world one day soon.
Agree with you on the unelected governing body issue in EURO.
What a colossal, corrupt, corrosive, contemptible, cancerous, kleptocracy! 🙁
😀 Felicitous alliteration and diction
🙂
That’s only half the story – look at all the huge buildings they have built. They also pay everyones travel to goto the other side of Europe every month
http://www.express.co.uk/news/politics/655417/Brexit-EU-referendum-parliament-Strasbourg-Brussels-cost-British-taxpayers
Yer can’t make this stuff up. I will never knowingly pay another penny to these clowns – so it seems likely I’ll never live in UK again.
That is unbelievable… before today I didn’t know any of this. The BREXIT vote at least shedding some light on all this.
That will be (is) the Home of the New World Order! Every nations Sovereignty worldwide will be dissolved in favor of this. If you let it.
Think the plans for that aren’t in the works??? This just proves that it is!
The whole Gun Argument in the USA is 100% about this. They can’t achieve a One World Society without disarming the citizens of the USA. Because the citizens of the USA will never ever willingly become a part of this.
Now you’ve got me worried. I am wondering whether people in the BVI are subject to being victims of this larcenous crowd….
Everyone is… especially if they are successful in the USA. There are enough people here distracted by being on their smartphones all the time… and smoking pot… that it is very possible for them to be successful. Which again the movement to legalize pot & other drugs across the USA is all part of the plan imo.
Yup, I read in Canada the elected government is trying to legalize pot so they can fill the gap in tax rev. due to drop in business and oil exploration activities. unreal….
Joseph,
How many federal government employees are in Washington areas supporting US federal government? How does it compare to Brussels based Euro employees?
I am sure the population of EURO countries is far greater than US.
Most of the US Agency’s should be dissolved… most achieve nothing productive. It’s all BS work!
All they do is write regulations now… which makes it almost impossible for a poor or middle income person to start a business. So many nonsensical regulations that you need Lawyers to figure them out, especially after the amount of regulations that have been written the last 7 years.
It’s no wonder why for the 1st time in US History less business are staring up than are failing every day. + the failure rate has increased dramatically. Stated another way… the cost to start up has increased dramatically and most are doomed to fail. Startup & small businesses have been the driver of good paying jobs in the USA for decades. Another reason why the income gap is widening. If this is happening here… this is happening worldwide.
I should also add that the regulations increase your cost of doing business (if you are a current owner) which squeezes the income of the business owners and therefore also squeezes the incomes of their employees. Regulations make it much more difficult to stay in business and therefore everyone loses their jobs. Whats left after that? Minimum wage part-time jobs. This is where we are now.
Ditto, but these politicians live on big governments and hence will never cut down on this unnecessary overhead.
All except one! Which I will not name.
Lots of indices sporting second wave ZZ after a five down….
If we forget technicals for a day as this market is 100% emotionally driven right now on Brexit, an the Vote is “remain” (seems likely) … this market will pop 300 pts up tmrw.
Agree???
I disagree. The market is being priced in, and has been all this week for a “remain” vote. If they remain, sell the newwwwws… JMHO 🙂
And even if it does move up, I doubt it will be a big move up. Will not take out SPX all time high. If it does, I will have to take my shorts off; and that will not go un-noticed!
I think Ari is on to something…! 🙂
When was the last time we saw back to back triple digit rises in DJIA?
Probably a pop up and then reversal for Bromain. What would really rock the market is a yes for Brexit. Unlikely – but certainly not impossible.
No doubt … a Brexit reality would drop the market big time! Of course the only people that know that answer “right now” are the big banks 😉
I agree with Ari, events do not drive markets over anything greater than a day or two. It is the mood of the masses which make the longer term trends. IMO we are well into the process of a major turn of mood to the downside.
Kevin,
I think the pop tomorrow on ‘Bremain’ vote will be short lived as today’s buying is in anticipation of a favorable outcome. However, the wrench in this is how desperate central banks and FED are to ramp the markets. Investors have limited amount of money while no one controls how much and when these folks print new money to aid their agendas.
Does anyone have a updated NASDAQ EW analysis handy as I think it is very important piece of the puzzle and how S&P will act over the coming days and weeks.
Weekly
Daily
http://tos.mx/KDfkI6
healthy ABC correction of wave 1 on the VIX?
Vernecarty,
…Can you elaborate on what you make of the comment you made? Re:
Move down in VIX this morning barely took out yesterday’s lows by 0.10 points. Candle now sporting a lower wick….hmmmnnn…!
You also mentioned that we’ll definitely go higher if the SPX closes above 2105. why do you say?
I could be wrong, but I am seeing lots of confluence in the way of fib retracements and supply/demand candle stick analysis that suggests that this bullish move today is well within normal limits for a correction. …And on a more “esoteric note’, the position of the moon is precisely in line with this week’s bullish action as well. The bearish action, if the bear count is correct, should ensue the week of July 3rd-9th. I hope those who are buying options are buying enough time to allow their positions to play out without too much time decay to contend with.
Lisa,
On moon position, it will also coincide with low in GOLD and I am watching that for a long play position in GOLD.
Hi Lisa:
I meant to say SPX 2100 as the round number pivot battles tend to dictate where prices go depending on who wins.
My impression on VIX is that it is not behaving as it normally does ahead of a sustained move higher. It should have decisively taken out yesterday’s lows and the lower wick suggests that is not going to happen. I think you are right in that this is a corrective move in a march of volatility towards higher ground. I have not seen the usual signs of an interim bottom, and in fact yesterday’s candle was the strongest we have seen in quite some time.
Prospective sub-minuette w(iv) of five.
Update: if the above count is correct, can not go above 2114.62 or w(iii) would be the shortest.
Waning momentum consistent with a terminal wave. I think it will be over today, with the typical whiplash of all the folk piling in long on today’s move up. I was expecting a red VIX candle today, it may even morph into a dragon-fly, or unfilled candle depending on what price does. I expect a gap up at tomorrow’s open.
Update: Above count is invalid below 2102.87…. very close now.
The action today is what I was expecting to see yesterday… rusty timing indeed!
That said, doesn’t change my overall medium term outlook. Still believe this goes down again from this area. So long as we stay below 2120 all is good.
Surely I am not alone in shorting this?
been long; personally won’t look to short until price hits a major up target (see comments below) and VIX index (blue line on 2 hour chart) drops below 14. It is at about 17.92 right now so it has a ways to go down yet. The last VIX peak (a buy signal) was at about 22.25.
Looks like a very good spot to go short. I’m all in on the short side here.
July UVXY calls says you are correct… 🙂
Steeple shooting star on SPY one minute chart…
Having trouble here with Black trend line that Lara has pointed out numerous times.
Looks like the cash dump arrived right on time… MMs have been merciless to anyone trying to position trade this market. Big moves in either direction have recently turned out to be more often than not. one day wonders. Will it continue?! 🙂
Maybe some of this move up is short covering?
No doubt! Very typical of bear market “rallies”…..classic “shake the trees” MM and bankster strategy….
They do seem ruthless in making sure everyone is off the trade before they move.
UVXY heading to hug $11.16 soon..
Not looking good for UVXY as it went through $11.16 in a hurry. Now waiting to see if and how it works for the remainder of the day (likely to be boring). If UVXY closes below $11.00, I would expect a revisit to $9.65 before moving back up. Maybe I am wrong and missing something on the chart but markets are showing uber bullishness.
So, who has is right…. the equities market or the bond market? My money is on the bond market.
The Bond Market has the best track record of being right.
But its not clear to me atm… right on what?
The level of risk, of course! 🙂
I don’t believe the movements the last few weeks is about “level of risk” imo.
I believe the bond market is signaling the BIG R & BIG D. This will NOT change anytime in the next couple of years. I think NIR is on the way to USA.
Rising bond yields mean one thing and one thing only. Risk perception is on the rise. It is the quintessential definition of “Risk Off” imho…
Sorry, I disagree for the big picture.
Bond Yield go up… Bond Yields Go down on a daily basis…
The move down to 2.40%ish Yields on the 30 Year UST has signaled The Big R & The Big D… That is set in stone now!
Any subsequent moves on a daily basis up or down is NOT going to change that!
Bond signals don’t change like the “wind” like the stock market does… That is why Bond money is “the smart money”!
If you are right, my big long TBT trade is in trouble!
I will keep you posted. So far, so good! Up 15% 🙂
Which market is carrying more risk/reward? There has been a fairly moderate spike up of UST bond rates since June 12. Is this due to the thirst for equity assets or an aversion to owning debt. I am trying to understand how those two market decisions could happen at the same time.
If bond holders perceive greater risk in the assets they hold, they will demand a higher yield to off-set that perceived risk.
Mine too. Just wait till the rest of the crowd figures that out! 🙂
Gary,
Depends on the timeframe but longer term 110% in agreement that bond market rules hands down. However, considering most folks here are traders with time horizons ranging from couple of hours to few months, the external influences are fairly important as they play an important role within the today’s financial markets. So I would say until it breaks, the stock market will prove you wrong every time you bet against it.
Thanks Ris. Yet, the equities markets have been unable to make new high since May 2015. So, negative return since then for equities and almost zero return for holding debt.
‘Nuff said!
If you are not scalping this market, you are being scalped, plain and simple!
Directional bets in this market of late, and I could care less whether you are bullish or bearish, have been a fool’s errand.
The event outcome tomorrow will be the excuse to let the ramp run. If that doesn’t happen, it will be our first clue that elusive third wave is around the corner or upon us.
Except in 1999 and 2007…. 🙂
Hourly chart. Targets showing of 2115, otherwise 2134 for ending of c up of Minor 3 within Intermediate (C) up. On the one, two and four hour charts VIX has plenty of room to move down (i use the non-inverted style) yet for these higher price targets. Very interesting at least to me is “c” up of Minor 3 hits 2134….which would point to a failed Minor 5 later on in July. My alt count is bearish, not bullish, overall.
IMO it is not my current alt count to solely hone in on, but to find an answer to the action of the Intermediate (C) on the daily bear chart. It is just too short in time and price to be an Intermediate (C), given what we know of the Intermediates (A) up and (B) down within the overall pattern. It could have ended in 13 days….but only if the price action would have fit: meaning more price to the upside at that time. Thus, arguing it is a smaller wave than an intermediate. That tipped me off to looking for other probabilities. Given 2134 is the all time high back from May of 2015 and we’re in a bear market the highest probability is an ending wedge. Time target ratios for Minor 3 up to end are 6.3 days or 9 days. We are on day 5 now. Last: ending diagonal ratios do also point to targets higher than 2134. 2141.17 is one and another is 2157.52. Watching for internal decays as the wedge moves along I believe will tell us if Primary 3 down is forthcoming, or to new ATH.
Lara,
Do I remember right that all you have is a bearish weekly EW count for the FTSE or has that changed?
You are correct. FTSE wave count is the most bearish of all. I have no bullish FTSE wave count.
I trade in the money spy puts . Last week I was put spy shares in my Fidelity account . So I now have a short position in spy in my account . I get a call Monday from Fidelity telling me that the SPY shares are hard to borrow , and I will be charged to hold the position . I looked up the short interest on SPY , and yes it does show 26.84 short interest / 2.58 days to cover . That’s a big short . I was interested if anyone had a chart of / or know where I could find a chart of SPY short interest over the last few years ? – looks like the entire world is short via the SPX sentiment . But every trader sees these numbers are are aware . Yet they continue to short . Thoughts from you pros
Fred, the same basic thing happened to me last week. I held a spread position on SPY and the puts I sold were exercised back to me, unexpectedly. I found out that the reason was because SPY traded exdividend at the end of the week, thus placing the puts into the money. Considering the enormous open interest on SPY, I’m guessing that lots of others got caught just like you and me. Bet that’s the reason there are so few shares available.
Interesting and slightly scary! Would love to see a on this chart as well.
If these shorts panic to cover, it could be an epic short squeeze. We are probably seeing some covering to account for this rapid move up.
Hi Fred:
It sounds like you held the in-the-money-puts through expiration. Was that your intention? Once the underlying equity of the in -the -money put option is sold short, you are responsible for any dividend due on the stock held short past the ex-dividend date.
This is a subterfuge brokerages will use if you have sold naked calls as they can be exercised at any time which essentially makes you short the stock when the call is exercised. Since the option was exercised, I am assuming you did intend to hold them through expiration. You were charged for the dividend due on the shares you were short, not for being short the stock per se.If the stock paid no dividend, there would be no charge (unless you were of course using margin for the trade)
btw, I am not sure what they meant about shares being hard to borrow. If you hold in the money puts that is not your problem; the seller has to make good and honor the contracts.
Move down in VIX this morning barely took out yesterday’s lows by 0.10 points. Candle now sporting a lower wick….hmmmnnn…!
yeah, but the more sideways action we see (5 min chart) currently and with the SP above 2100, favors a resolution to the upside IMHO.
If SPX closes above 2100 we are definitely going higher…
UVXY being accumulated around 11.50…
If European markets are any indication, DJIA, S&P, and NASDAQ should be up close to 1.1% if not higher ahead of the results. Strong finish into the close will be the best fake ramp to scare the remaining weak hands.
Anyone playing NUGT or GOLD into the event here?
Vern – PCLN is getting very tempting but would want to see NASDAQ fail first.
Yep. They are going to do some kind of intra-day cash dump and I am waiting for that spike… 🙂 🙂
UVXY looks to be heading to $11.16ish and I am waiting to see how that holds as a break of the same will drop it straight to $9.65 level. It will not be surprising to see UVXY close the day just around $11.16. What do you think?
Looks to me like accumulation taking place around 11.50
PCLN probably plump for the pickin’. It’s unlikely to pop back above BB… 🙂
Looks good Olga, I’ve charted a variation if we don’t get the extended sideways actions and just pop up and reverse, although, I consider your chart as main count ATM.
Yeah – I charted that as an alternate below following Daniels comment. I’d rather that count plays out but have a feeling there might be a bit more paint watching yet. There is no (c) of (x) truncation for your charted count so it should have better odds.
Excuse me Olga, I need to refresh the site more often. Nice to see several others seeing this idea.
The lady can chart like a champ can she not? 🙂
FWIW, Given the importance of the event results tomorrow and official statement from FED, I will be very hesitant to put money on the short side just yet. In my view it will be a lot better to have them a day or two of glory by ramping the markets as it only provides us with better entry points for short plays.
You mean to tell me these banksters cannot keep up appearances for more than 20 minutes into the open?? Come on guys, surely you can do better than allow a fade so soon? Funny, anybody chasing this rally already underwater!
Janet Yellen mentioned yesterday the Fed was ready and able to stabilize the markets if Brexit happens. Perhaps overnight was pump #1 in advance of the vote results and she is waiting for the final results before she begins the next pump.
You mean she engaged in “Preemtive Pumping”? Sounds very naughty! 🙂
Yea. LOL
2115 is my current target for this move (where Y = 0.618 * W).
I suspect after all this hell and fury ramp job we will go sideways most of today to complete b of (y).
This move up today is weak so far imho – negative div on 5min RSI and MACD.
5min Chart
C wave in X is truncated slightly relative to A. X may therefore have ended previously at 2082.54 rather than 2084.36. I have 2 upside targets, 2103 and 2112.
Yep – could have. (a) & (b) (of (y)) on my chart might already be done if that’s the case – good call
Daniel’s idea – ‘reversal imminent’ (as Peter’s Jedi dog would say) if this is correct 🙂
who says I didn’t send a self portrait?
Well you don’t look at all happy Peter – looking a bit woof if you don’t mind me saying 🙂
Oh I’m happy alright, making big $$ in the trading right now. Maybe a little constipated when the photo was taken, chew toy issue.
Thank you Olga! As always, much appreciated.
Yeah. The bears have already snatched back that 2100.00 pivot and are smacking the eager bulls Bad! Bad! Bad! 🙂
Come over to the dark side.
Where, my good sir, is your light sabre??!
Don’t leave the starship without it! 🙂
It is under his cloak of course. We may be seeing a lot of cloak-and-dagger action today!
both of you nothing but Jedi mind tricks!
Sneaky! 🙂
My My My! So, we wake up and see futures up hugely and so we all giddily conclude – “The Bull is Back!!” Everyone is talking “break-out”.
I could be wrong, but VIX action yesterday is not the stuff of which interim, to say nothing of lasting bottoms are made. My suspicion is that anyone chasing this “rally” had better be nimble! 🙂
Vern,
Notice how the ramp up and down are happening outside the regular trading hours. This means the intent is to force the crowd to start chasing and when that happens the markets will be ripe for a drop. I doubt very many retail folks got in for ride high into the ‘Bremain/Brexit’ event.
I’ll be very happy to buy back my short at a huge discount 🙂
Me too. The big question is when and at what price? Will we see another 52 week low in UVXY?
Peter’s comment and wave idea of Primary 2 not yet ended may be the solution.
I’ll be buying as close to 2120 as possible with stop just above invalidation albeit I realise my method of trading is not as practical with options.
Atm 2115 seems like as good a target as any, but might get a better target once (b) of (y) is complete.
Olga,
I am waiting for UVXY to go below $11 (more like $10.50ish) to start looking into buying some. AAPL not working with the MoJo and asme for Google, might be an early reversal in the wings.
Someone is holding price on GOLD (at least till tomorrow) at current level as correction should be happening about now.
Folks, this has got banksterism written all over it. I know most of the folk on this forum are a bit ahead of the crowd on that score thankfully!
UVXY bought at the bottom this morning of around 11.50…watching closely for clues…
Short apple via bearish call spreads…
Vern,
waiting for a break of $95 on Apple.
You can take it to the bank dude! 🙂
Futures rallying strongly as it is suggested an IN vote will be the outcome. Another day another Gap and hopefully a great risk reward oppurtunity 🙂
Paresh,
This could be the relief rally now that the voting day has arrived. I had huge problem trying to go long E-Mini’s all day yesterday. MMs were not willing to play ball at all. I sensed something is up and closed my short positions. Looks like a strong move above 2,100 is being worked here now. VIX and UVXY should print fresh new 52 lows here now JMHO.
Hi have held my shorts and gone long yesterday morning and put stops above my open. Do not want to get caught with my shorts down if the tide does go out but equally am getting jittery. Hope its a case of the biggest fake head in a very long time
I am expecting the rally to continue into tomorrow as the result come in favour of ‘Bremain’. I think there are a lot of shorts trapped in the markets as the drop pre-event was expected to be significant but it has not been and these shorts will start to cover into rally today and tomorrow post results (assuming ‘Bremain’ is the outcome and no surprises). However, I am only focused short term on daily picture atleast until mid next week.
I exited all shorts last week with the daily bullish engulfing candle (almost a hammer) and the daily MACD positive divergence. I am thinking we may see a new ATH. We will open at the 2100 region which has produced strong resistance this week. If we go right through 2100 then it is off to the races. If we stall and cannot get through, then it may be look out below. It is a good time to SOH.
Where does a new ATH leave the wave counts?
Could be 2,145 or 2,150 based on how today plays out. I could be wrong with my numbers, so wait for Lara and Olga for more precise numbers.
I am not sure but certainly something would need to change. I leave that to Lara. However, we must first see the break above 2135 and that is not a certainty by any means. There is lot of resistance between 2100 and 2135. Furthermore, the vote on Bremain or Brexit is not yet over. The market can turn around at a moment’s notice.
First?
first!!
Woo hoo!