
Analysis exactly one month ago expected to see an intermediate degree correction which should last about four weeks and end about 526.
Since 6th December, 2013 AAPL has exhibited typically corrective movement in a three wave structure, so far reaching down to 533.60, $7.60 beyond the target. I expect the structure is very close to completion. The target has been recalculated at 534.82.
Click on the charts below to enlarge.
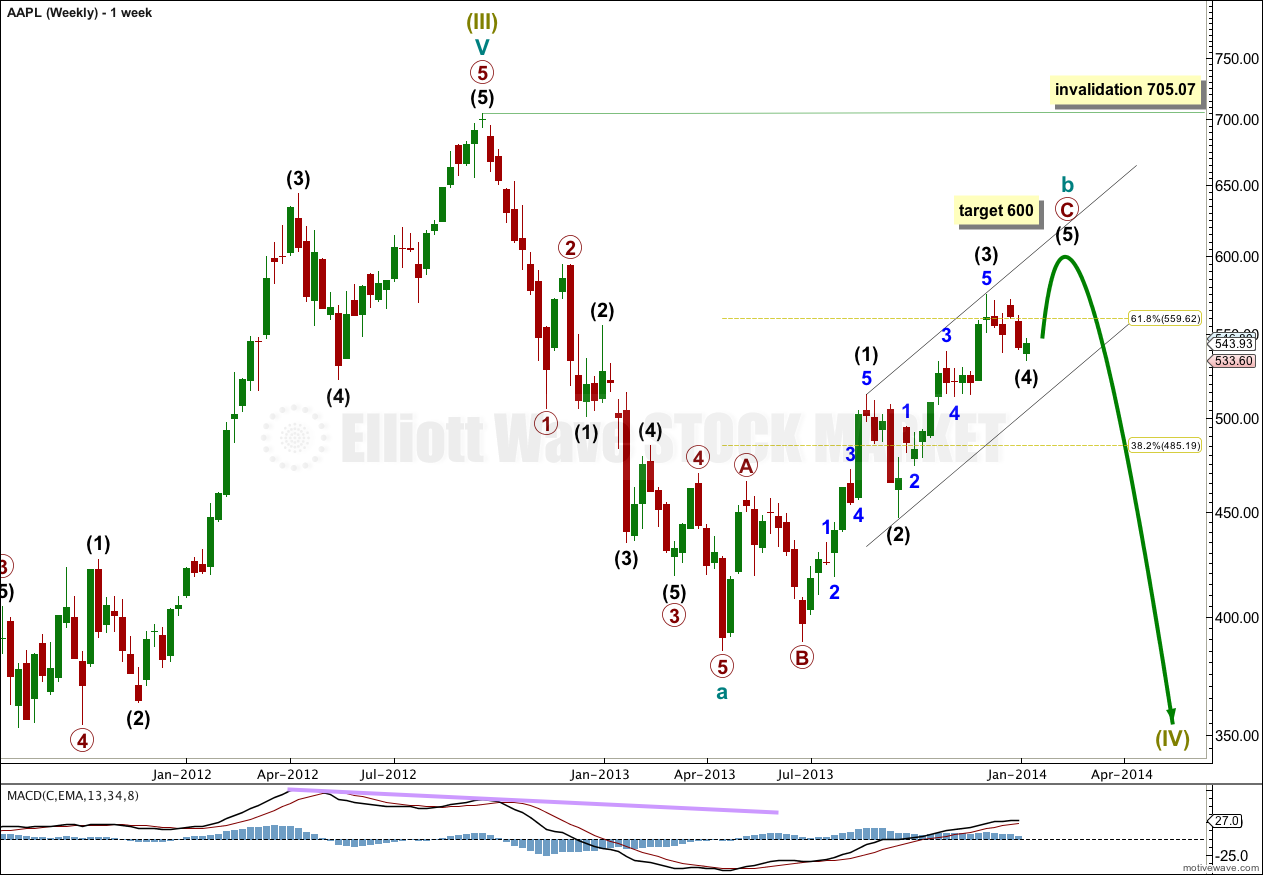
This weekly chart shows the entire structure of this fourth wave correction at super cycle degree: super cycle wave IV.
Cycle wave a is a completed five wave impulse so this correction must be a zigzag. It cannot be over at the low of cycle wave a at 385.10.
Within the zigzag cycle wave b may not move beyond the start of cycle wave a. This wave count is invalidated with movement above 705.07.
Cycle wave b is unfolding as a zigzag. Within it primary waves A and B are complete. At 600 primary wave C would reach 2.618 the length of primary wave A.
In this instance a corrective channel would be of no use to find where primary wave C should end. A channel drawn about the impulse of primary wave C may show where intermediate wave (5) completes this structure. Draw this channel first with a trend line from the highs of intermediate waves (1) to (3), then place a parallel copy upon the low of intermediate wave (2). I would expect intermediate wave (5) to end either mid way within this channel, or at the upper trend line.
When this channel is breached by subsequent movement then I would expect that cycle wave b is over and cycle wave c downwards has begun. Cycle wave c would be extremely likely to make a new low below the end of cycle wave a at 385.10 to avoid a truncation.
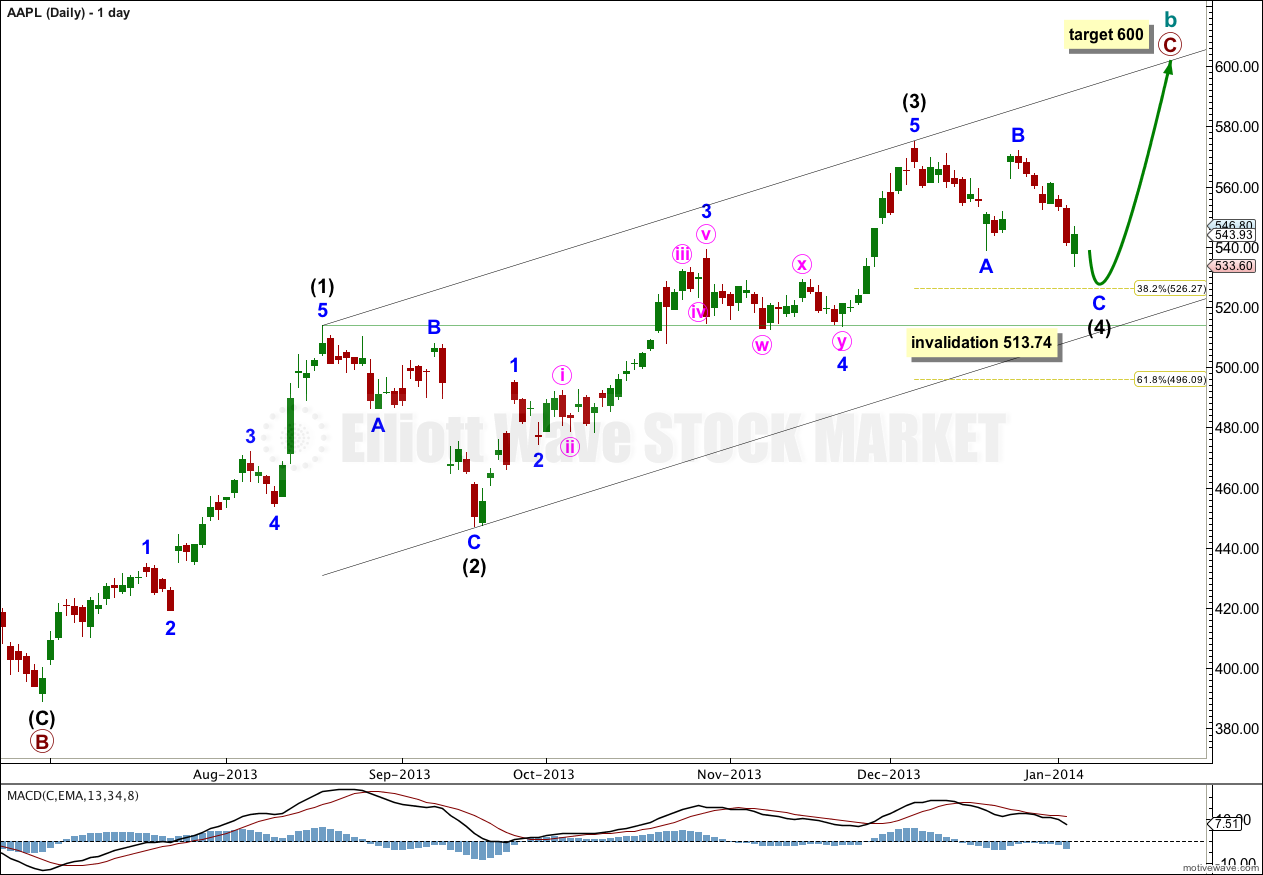
The daily chart shows the structure of primary wave C upwards.
Within primary wave C so far intermediate waves (1), (2), and (3) are complete. A very small amount of downwards movement should complete intermediate wave (4) within a few hours, and thereafter only one final upwards wave for intermediate wave (5) is required to complete this structure.
Intermediate wave (3) is just 3.05 longer than equality with intermediate wave (1). Intermediate wave (3) is almost 1.618 the duration of intermediate wave (1). Both of these waves look extended, so I would expect intermediate wave (5) to not be extended.
Intermediate wave (2) lasted 19 days, and intermediate wave (4) has so far lasted 20 days. This almost perfect proportion gives the wave count the “right look”. If intermediate wave (4) completes with one more daily candlestick downwards it would have lasted a total of a Fibonacci 21 days.
Intermediate wave (4) may not move into intermediate wave (1) price territory. This wave count is invalidated with movement below 513.74.
I would expect intermediate wave (5) to most likely end at the upper edge of the parallel trend channel.
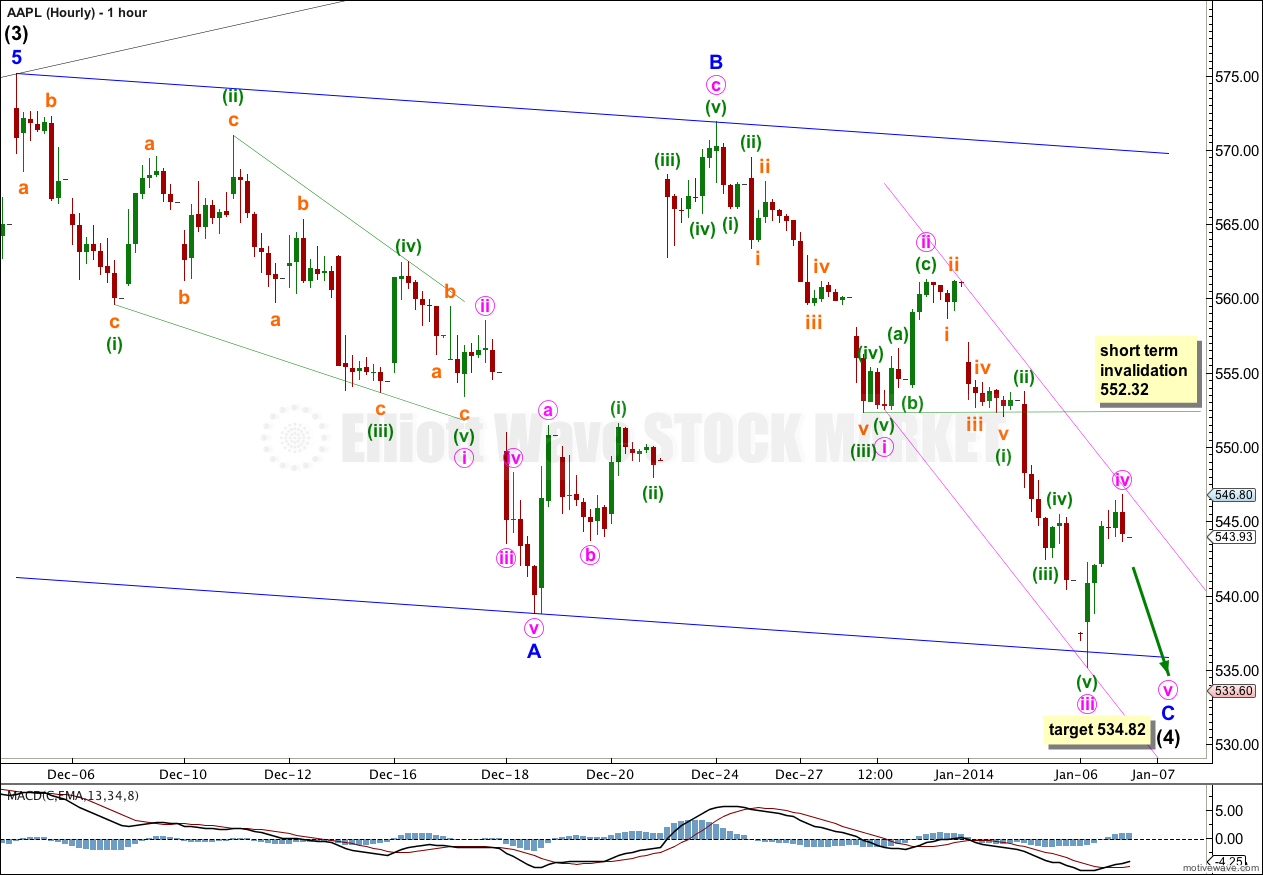
This hourly chart shows the entire structure of intermediate wave (4) so far. Minor wave C has just passed equality with minor wave A, and if the target is reached minor waves A and C would have a very close ratio of equality.
Within minor wave C there is no Fibonacci ratio between minute waves i and iii. At 534.82 minute wave v would reach 0.618 the length of minute wave i.
Minor wave C should end about the lower end of the larger blue parallel channel, and probably mid way within the smaller pink parallel channel.
Within minor wave C minute wave iv may not move into minute wave i price territory. This wave count is invalidated in the short term with movement above 552.32.
When there is some downwards movement for minute wave v then the invalidation point would no longer apply. Subsequent movement above 552.32 would confirm that minor wave C and so probably intermediate wave (4) would be over. At that stage I would expect about two weeks of upwards movement towards 600.
Hi Laura,
I’m a little confused on your targets. Are you saying that Apple should hit 526 to complete this wave down and then move to 600?
Wave four typically retraces less than 38.2% of wave three which would make that around $525 at a complete 38.2% retracement.
526.27 is exactly 0.382.
The target is slightly above that at 530.38.
You are correct, fourth waves are typically shallow. However, this is a tendency and not a requirement. Flexibility and use of the guideline of alternation is really important in analysing fourth waves. In this case the second wave (2) was a relatively deep 53.3% correction of it’s first wave (1), so we would expect that yes this fourth wave (4) should be shallow.
I believe that the fourth wave is complete. Looking at the downward trend tracing of the highs and lows of this correction formed a wedge and it’s peak was Friday. It will be interesting to see what happens Monday. Any movement to the upside would most likely warrant an end to wave 4, however, you are right in that a break above $546 level is the absolute marker of this end.
I am looking forward to your analysis Monday.
I probably will not update AAPL on Monday, I do it only once a week to fortnight.
I want to see movement above 546.82 now to confirm that intermediate wave (4) is over and intermediate wave (5) has begun. Until we have some confirmation then it is safest to assume that the “trend remains the same until proven otherwise”.
Thanks for your informative and interesting comments Osima!
I updated the charts on 9th January, 2014.
I expect AAPL to move slightly lower and the target is recalculated at 530.38.
Thereafter it should resume the upwards trend and move towards 600.