by Lara | Jun 2, 2020 | S&P 500, S&P 500 + DJIA
S&P 500: Elliott Wave and Technical Analysis | Charts – June 2, 2020 Price continues to move higher towards the second and last target. Summary: The next target is at 3,238. Use the lower edge of the Elliott channel to indicate where support may be found on the...
by Lara | May 15, 2020 | S&P 500, S&P 500 + DJIA
S&P 500: Elliott Wave and Technical Analysis | Charts – May 15, 2020 Upwards movement was expected from both short-term Elliott wave counts yesterday, which is how the session has unfolded. Summary: Upwards movement to a final target at 3,058 or 3,238 may have...
by Lara | May 11, 2020 | S&P 500, S&P 500 + DJIA
S&P 500: Elliott Wave and Technical Analysis | Charts – May 11, 2020 A signal today from On Balance Volume suggests a new Elliott wave count. Summary: It is possible the pullback within this bounce is over and the bounce may continue this week to a target at...
by Lara | May 7, 2020 | S&P 500, S&P 500 + DJIA
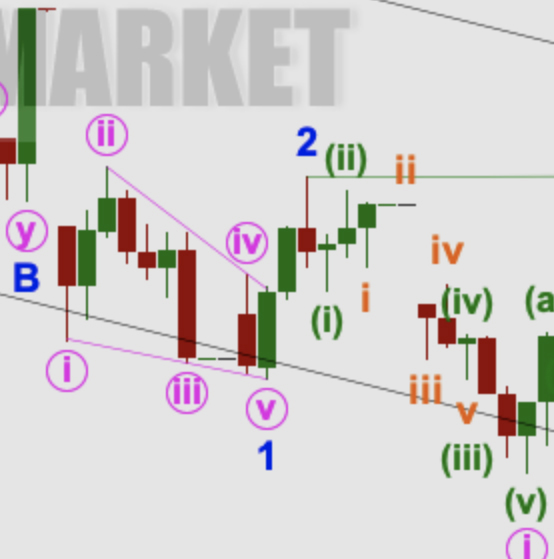
S&P 500: Elliott Wave and Technical Analysis | Charts – May 7, 2020 Analysis has expected that a B wave may be unfolding sideways or lower. A small range day closing as a small doji overall fits expectations. Summary: A downwards or sideways movement may continue...
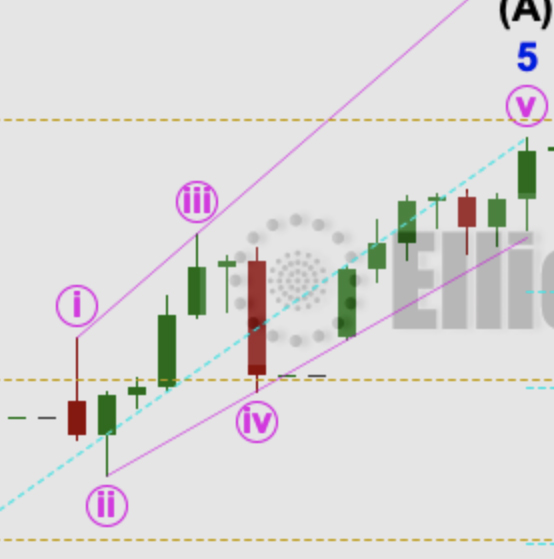
by Lara | Apr 22, 2020 | S&P 500, S&P 500 + DJIA
S&P 500: Elliott Wave and Technical Analysis | Charts – April 22, 2020 A new channel is drawn and price remains within it. The same target zone is used. Summary: The bounce may now end about 3,069 to 3,261. Thereafter, the downwards trend may resume with...
by Lara | Apr 16, 2020 | S&P 500, S&P 500 + DJIA
S&P 500: Elliott Wave and Technical Analysis | Charts – April 16, 2020 A sideways day sees price remain within the channel. Today three short-term possibilities are considered. Invalidation points for a main wave count provide confidence points for alternates....
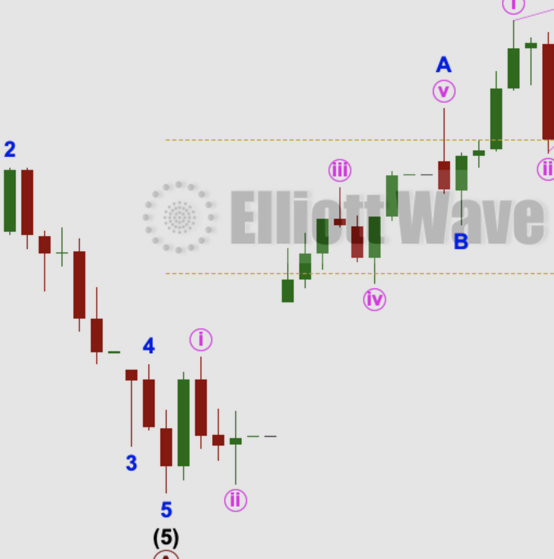
by Lara | Apr 14, 2020 | S&P 500, S&P 500 + DJIA
S&P 500: Elliott Wave and Technical Analysis | Charts – April 14, 2020 Upwards movement is continuing this week towards targets as expected since the 24th of March. Summary: The bounce may end about 2,934 this week. If this target is wrong, it may not be high...
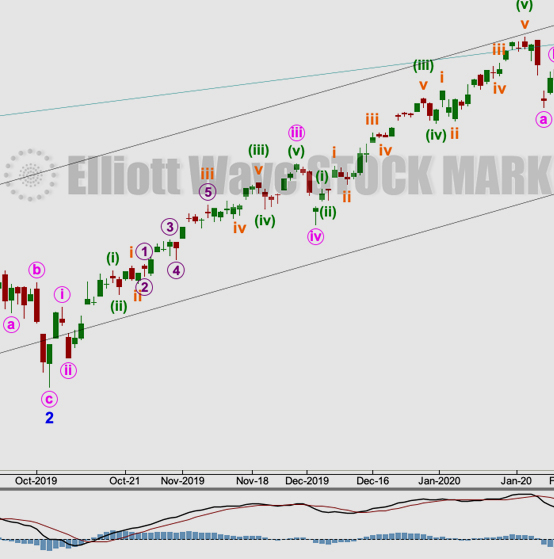
by Lara | Mar 30, 2020 | S&P 500, S&P 500 + DJIA
S&P 500: Elliott Wave and Technical Analysis | Charts – March 30, 2020 Sideways movement in a narrow range fits the short to mid-term expectation from the Elliott wave count. Summary: Primary wave B may have begun. It may be either a quick sharp bounce or a long...
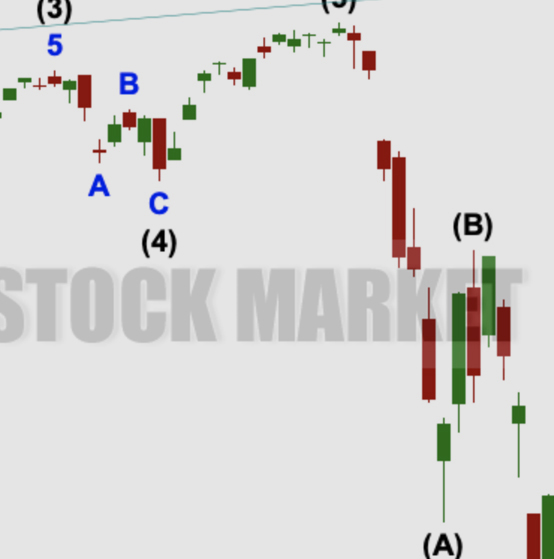
by Lara | Mar 27, 2020 | S&P 500, S&P 500 + DJIA
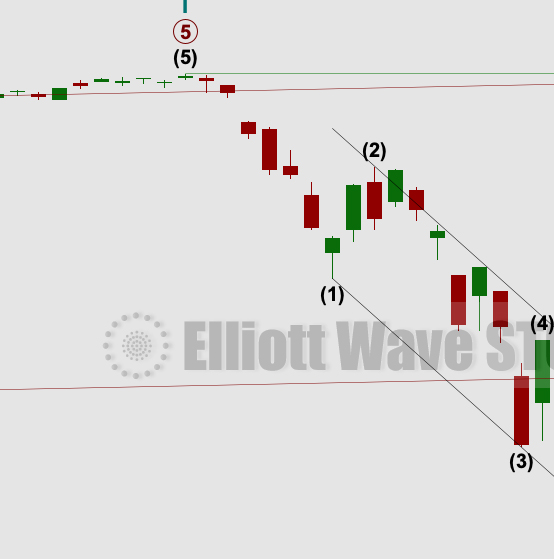
S&P 500: Elliott Wave and Technical Analysis | Charts – March 27, 2020 A breach of the channel on the hourly chart by a gap down at market open indicated an alternate hourly chart was correct, which expected overall downwards movement. The session has closed red...
