by Lara | Aug 4, 2021 | S&P 500, S&P 500 + DJIA
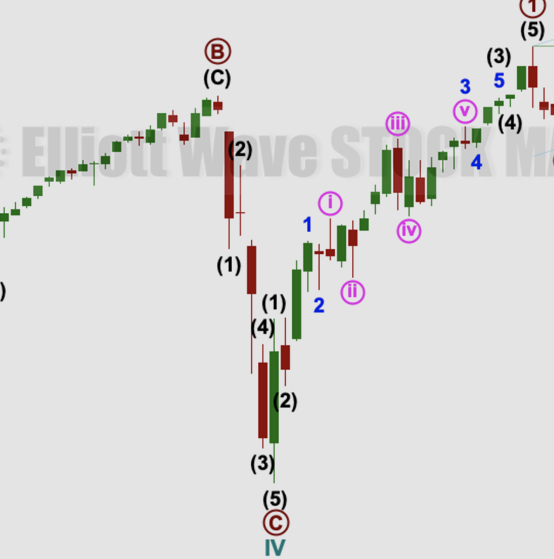
S&P 500: Elliott Wave and Technical Analysis | Charts – August 4, 2021 A small range inside day leaves all Elliott wave counts the same. The main Elliott wave count still has good support from classic technical analysis, particularly a cluster of divergence with...
by Lara | Jul 12, 2021 | S&P 500, S&P 500 + DJIA
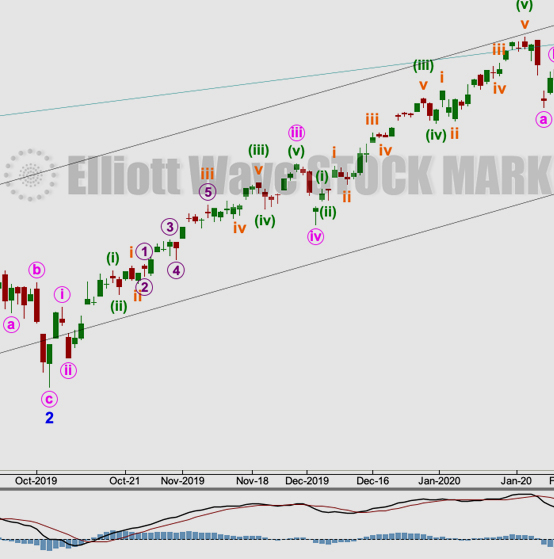
S&P 500: Elliott Wave and Technical Analysis | Charts – July 12, 2021 Upwards movement continues towards the next Elliott wave target. Summary: The primary trend remains up. Pullbacks are a normal and to be expected part of a bull market. Targets for the Elliott...

by Lara | Jun 16, 2021 | S&P 500, S&P 500 + DJIA
S&P 500: Elliott Wave and Technical Analysis | Charts – June 16, 2021 A new low below 4,234.07 indicated further downwards movement was likely. Support was expected about 4,209.89. The low achieved for the session was at 4,202.45. Summary: The trend is up. The...
by Lara | Apr 28, 2021 | S&P 500, S&P 500 + DJIA
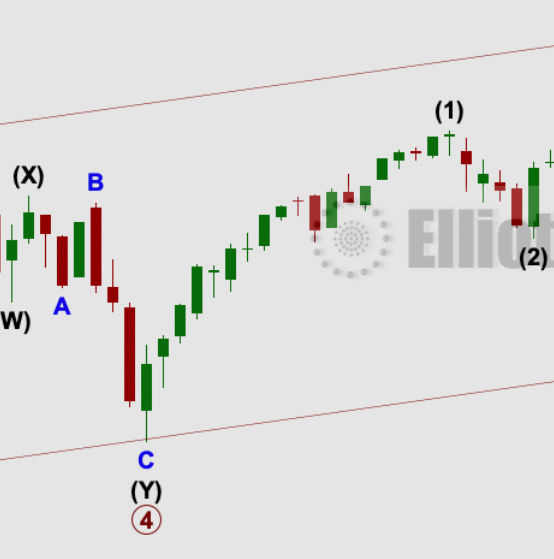
S&P 500: Elliott Wave and Technical Analysis | Charts – April 28, 2021 For the third day in a row the S&P500 has moved sideways in a very narrow range. Today a Gravestone Doji suggests a downwards breakout. Summary: The wave count expects a third wave at...

by Lara | Mar 19, 2021 | S&P 500, S&P 500 + DJIA
S&P 500: Elliott Wave and Technical Analysis | Charts – March 19, 2021 Last analysis expected a pullback to continue. Another downwards day exactly fits this expectation. Summary: The main wave count (daily and weekly) expects the low of the 30th of October to...
by Lara | Feb 24, 2021 | S&P 500, S&P 500 + DJIA
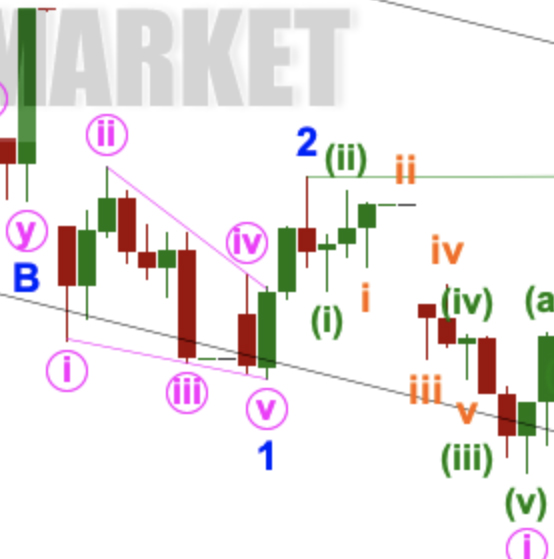
S&P 500: Elliott Wave and Technical Analysis | Charts – February 24, 2021 Last analysis stated that the pullback was expected to be over at yesterday’s low. A strong upwards day today fits this expectation. Summary: The last pullback is expected most likely...
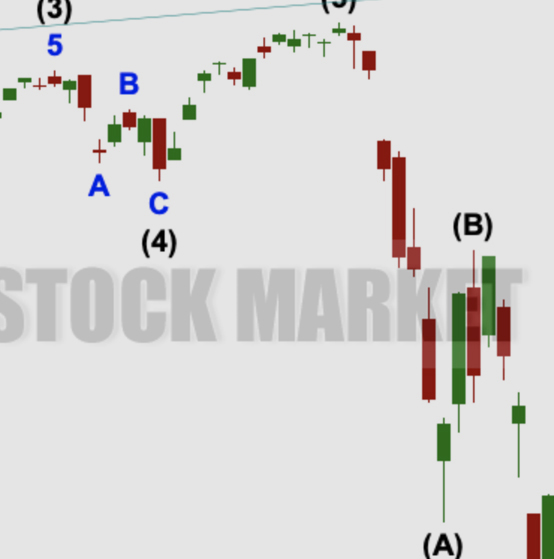
by Lara | Feb 1, 2021 | S&P 500, S&P 500 + DJIA
S&P 500: Elliott Wave and Technical Analysis | Charts – February 1, 2021 Upwards movement for Monday leaves the short-term alternate hourly Elliott wave count as most likely. The target is now calculated at two degrees. Summary: Both main and alternate wave...

by Lara | Jan 6, 2021 | S&P 500, S&P 500 + DJIA
S&P 500: Elliott Wave and Technical Analysis | Charts – January 6, 2021 The main wave count yesterday was judged to have the highest probability. It expected price to continue higher, which is what has happened. Summary: The wave count expects the low of the 30th...

by Lara | Dec 10, 2020 | S&P 500, S&P 500 + DJIA
S&P 500: Elliott Wave and Technical Analysis | Charts – December 10, 2020 Downwards movement this session ended just above the short-term invalidation point, and then from there price bounced up. Summary: The wave count expects the low of the 30th of October to...


