
S&P 500: Elliott Wave and Technical Analysis | Charts – August 4, 2021
A small range inside day leaves all Elliott wave counts the same.
The main Elliott wave count still has good support from classic technical analysis, particularly a cluster of divergence with the AD line.
Summary: There is a reasonably strong cluster of bearish signals from the AD line and short-term weak quadruple bearish divergence between price and RSI. Closure of the last gap with a new low below 4,369.87 would add confidence that a high is in place. Four Elliott wave counts are considered in order of probability:
1 – A minor degree fourth wave may continue lower and / or sideways for another two to five weeks. Support may be found about the lower edge of the Elliott channel on the main daily chart. For the very short term, it is possible that price may make a new all time high to a short-term target at 4,445 before turning down, although this is less likely.
2 – The pullback is over and the upwards trend resumes to the next target at 4,922 (first alternate).
3 – An intermediate degree fourth wave on the weekly chart may move suddenly lower to find support about the lower edge of the Elliott channel, which sits about 3,956 (second alternate).
4 – A primary degree second wave may begin. It may meet the technical definition of a bear market in that it may correct to 20% or more of market value at its eventual low. Also, it may find support about 3,044 and may not make a new low below 2,191.86 (third alternate).
The biggest picture, Grand Super Cycle analysis, is here.
Monthly charts are last updated here with video here.
MAIN ELLIOTT WAVE COUNT
WEEKLY CHART
Click chart to enlarge.
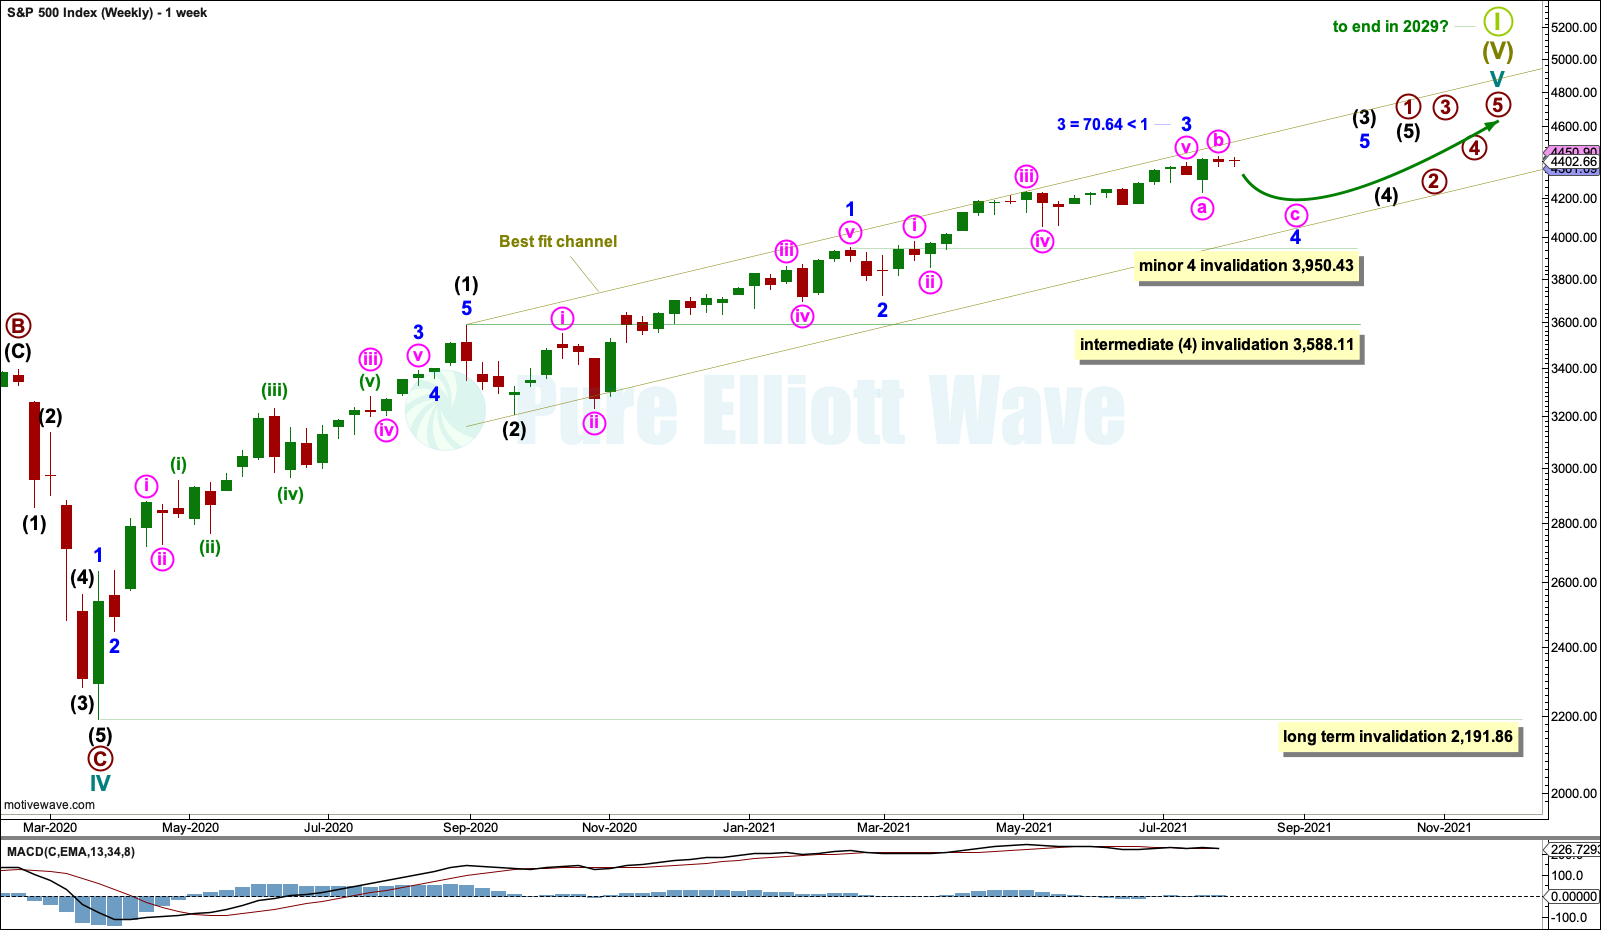
Cycle wave V may last from one to several years. So far it is in its seventeenth month.
This wave count may allow time for the AD line to diverge from price as price makes final highs before the end of the bull market. The AD line most commonly diverges a minimum of 4 months prior to the end of a bull market. A longer divergence is positively correlated with a deeper bear market. A shorter divergence is positively correlated with a more shallow bear market. There is now only eighteen days of divergence.
A longer divergence between price and the AD line would be expected towards the end of Grand Super Cycle wave I.
It is possible that cycle wave V may continue until 2029, if the 2020s mirror the 1920s. Either March or October 2029 may be likely months for the bull market to end.
Cycle wave V would most likely subdivide as an impulse. But if overlapping develops, then an ending diagonal should be considered. This chart considers the more common impulse.
There is already a Fibonacci ratio between cycle waves I and III within Super Cycle wave (V). The S&P500 often exhibits a Fibonacci ratio between two of its actionary waves but rarely between all three; it is less likely that cycle wave V would exhibit a Fibonacci ratio. The target for Super Cycle wave (V) to end would best be calculated at primary degree, but that cannot be done until all of primary waves 1, 2, 3 and 4 are complete.
Primary wave 1 within cycle wave V may be incomplete. This gives a very bullish wave count, expecting a long duration for cycle wave V which has not yet passed its middle strongest portion.
Within primary wave 1: Intermediate waves (1) and (2) may be complete, and intermediate wave (3) may now be approaching an end.
Intermediate wave (4) may not move into intermediate wave (1) price territory below 3,588.11.
Within intermediate wave (3), minor waves 1, 2 and 3 may be complete. Minor wave 3 may be shorter than minor wave 1 by 70.64 points. This limits minor wave 5 to no longer than equality in length with minor wave 3. Minor wave 4 may not move into minor wave 1 price territory below 3,950.43.
A best fit channel is drawn about cycle wave V. Draw the first trend line from the end of intermediate wave (1) to the end of minute wave iii within minor wave 3, then place a parallel copy on the end of intermediate wave (2). The channel may need to be redrawn as price continues higher. The channel may show where price may find resistance and support along the way up.
DAILY CHART
Click chart to enlarge.
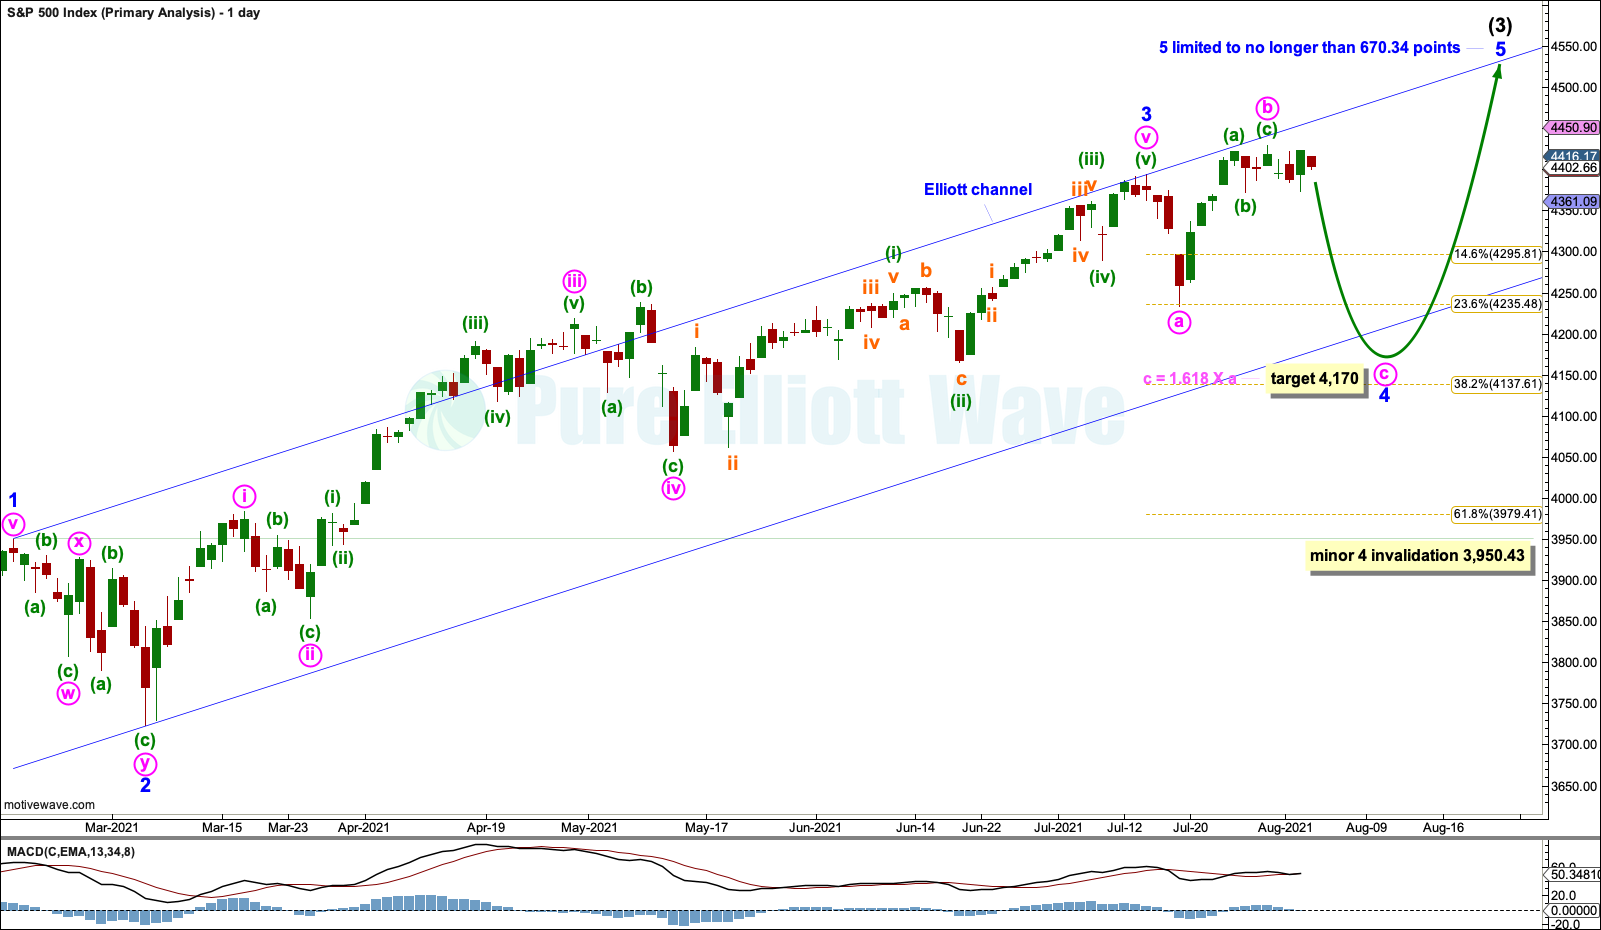
Minor wave 2 subdivided as a double zigzag and lasted 12 sessions. Minor wave 4 may last about 3 to 6 weeks and may most likely subdivide as a flat, triangle or combination, which are often longer lasting than zigzags. Flats, triangles or combinations are choppy sideways movements with swings from resistance to support and back again. Price does not move in a straight line during these swings, so it will not be possible to know which of several Elliott wave structures minor wave 4 has subdivided as until it may be over.
The most likely structure for minor wave 4 at this stage looks like an expanded flat, which is a very common structure. Minute wave c within minor wave 4 would be likely to make at least a slight new low below the end of minute wave a at 4,233.13 to avoid a truncation and a very rare running flat.
Draw an Elliott channel. Draw the first trend line from the ends of minor waves 1 to 3, then place a parallel copy on the end of minor wave 2. Minor wave 4 may find support about the lower edge of this channel.
A target is now calculated for minute wave c that would expect a small overshoot of the lower edge of the blue Elliott channel, which is acceptable. But if the target is wrong, then it may be a little too low as price may find support at the lower edge of the channel.
Minor wave 4 may not move into minor wave 1 price territory below 3,950.43.
If minor wave 3 is over, then it would be 70.64 points shorter than minor wave 1. This limits minor wave 5 to no longer than equality in length with minor wave 3, so that the core Elliott rule stating a third wave may never be the shortest is met.
HOURLY CHART
Click chart to enlarge.
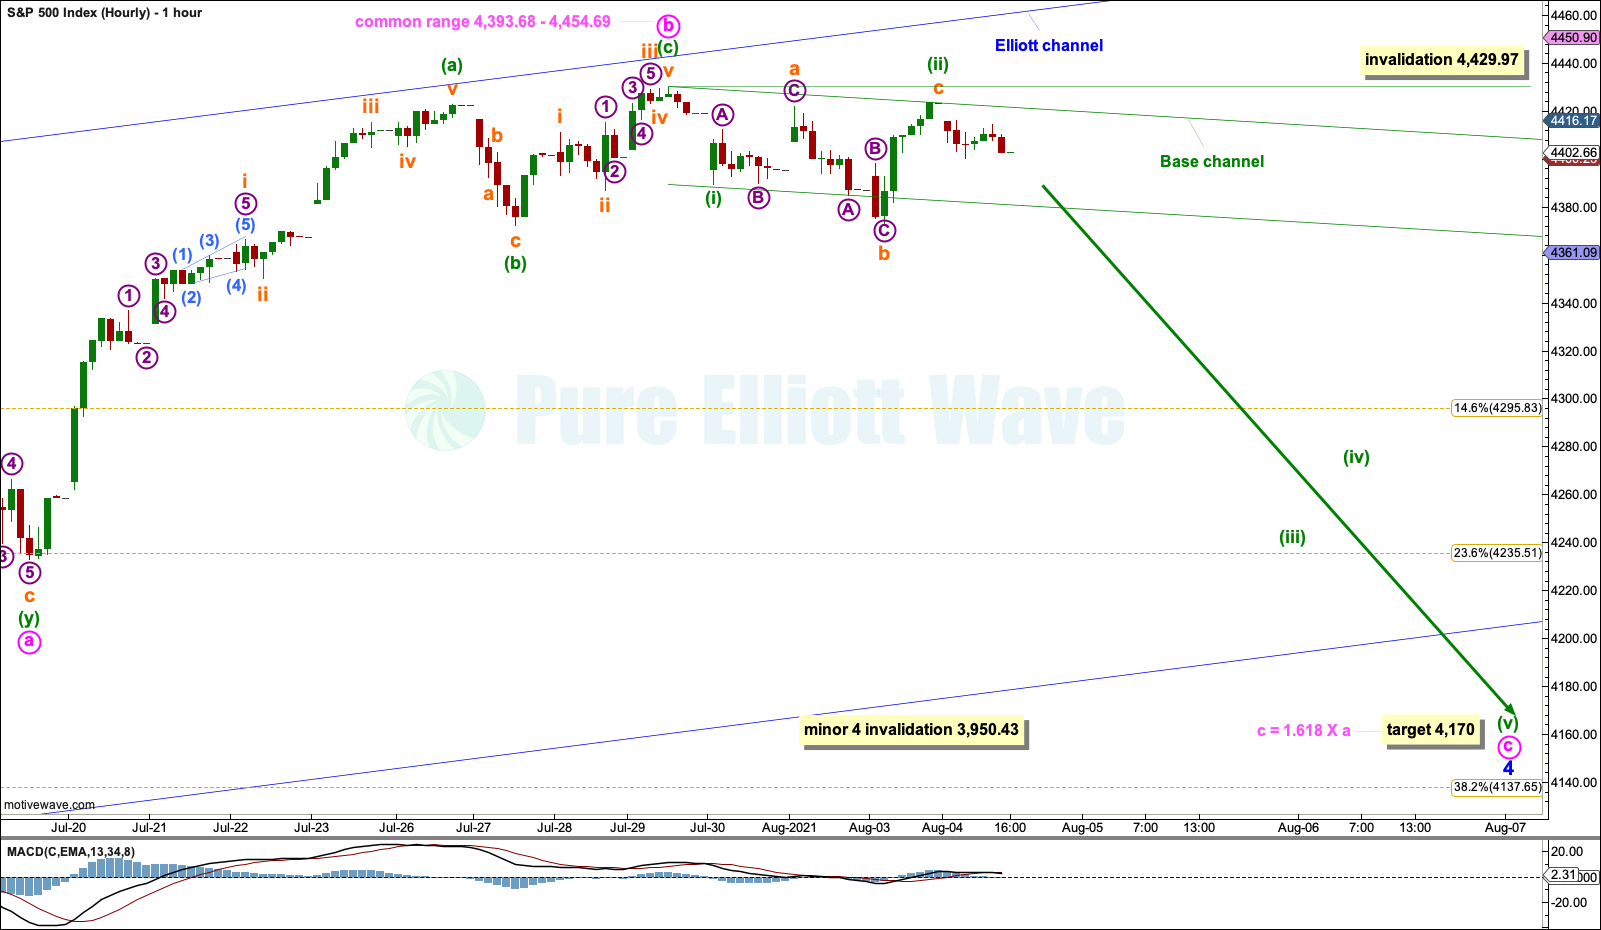
Minor wave 4 may be unfolding sideways as an expanded flat.
Within minor wave 4: Minute wave a subdivides as a double zigzag, and minute wave b now subdivides as a single zigzag that is longer than 1.05 the length of minute wave a, indicating an expanded flat. Minute wave b remains well within the most common range for a flat. Minute wave b is a 1.23 length of minute wave a.
Minute wave c would be very likely to make at least a slight new low below the end of minute wave a at 4,233.13 to avoid a truncation and a very rare running flat. The target expects a common Fibonacci ratio between minute waves a and c for an expanded flat.
Redraw the base channel about the start of minute wave c. Draw the first trend line from the start of minuette wave (i) to the end of minuette wave (ii), then place a parallel copy on the end of minuette wave (i). Along the way down, bounces may find resistance at the upper edge of the channel. Minuette wave (iii) should have the power to breach the lower edge of the channel.
Minuette wave (ii) may not move beyond the start of minuette wave (i) above 4,429.97.
Minor wave 4 may not move into minor wave 1 price territory below 3,950.43.
It must be repeated that analysis during corrections is particularly difficult as multiple structures are possible. Focus should not be on identifying each smaller movement within the correction but on identifying when the correction may be complete and an upwards breakout may be expected.
HOURLY CHART II
Click chart to enlarge.
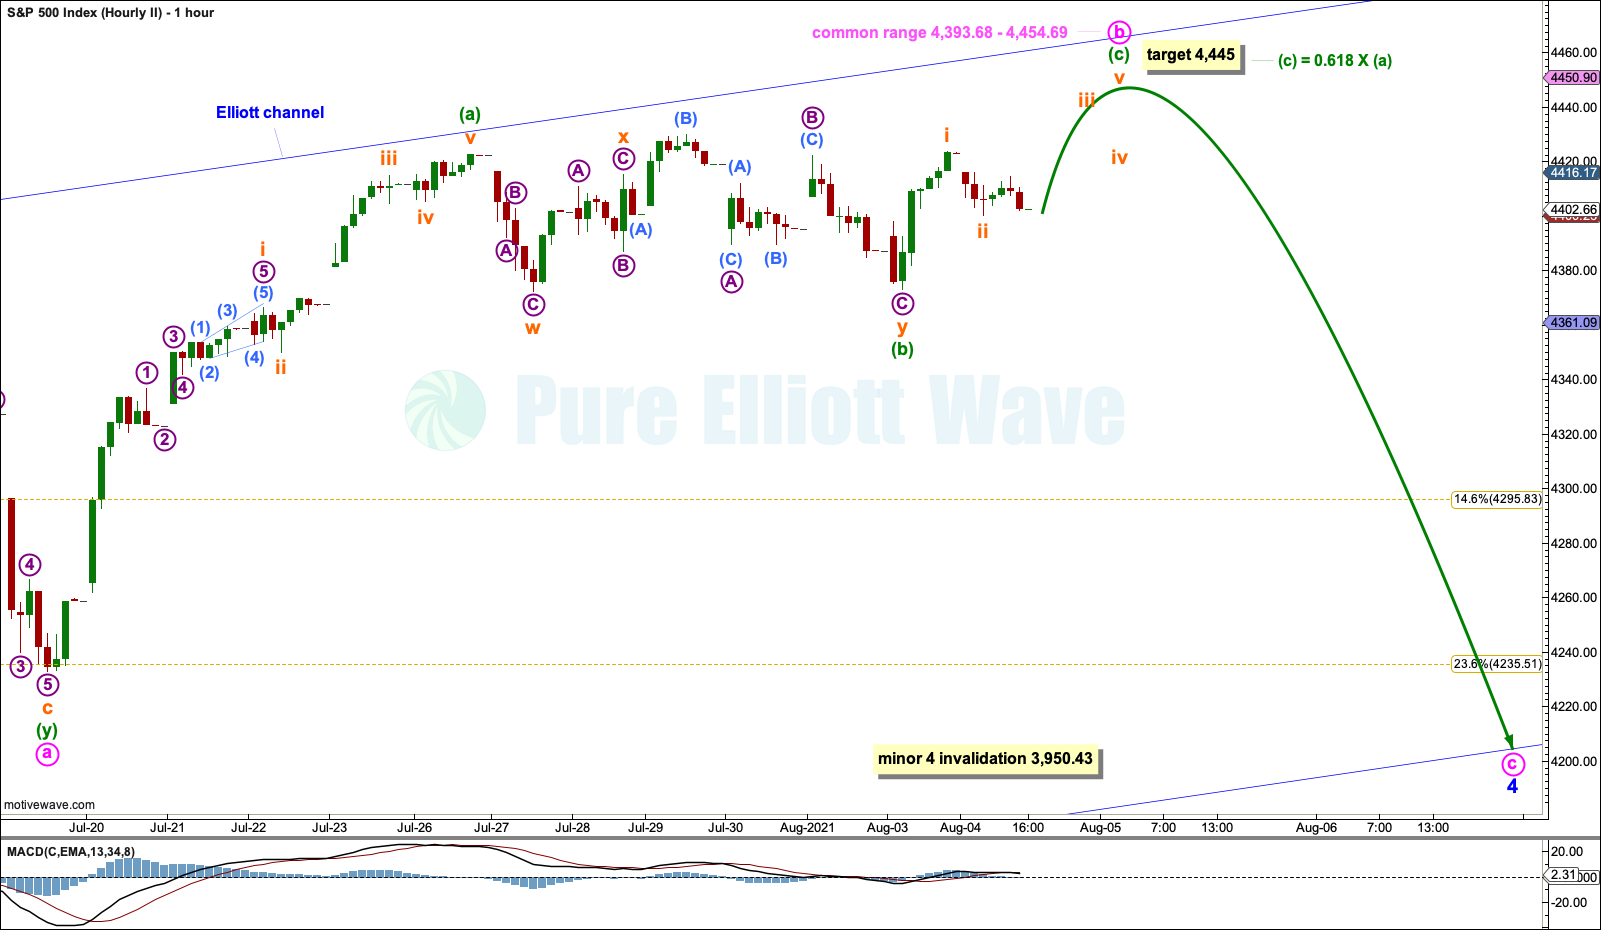
If price makes a new high tomorrow above 4,429.97, then this would be the main hourly wave count.
It is possible that minute wave b within minor wave 4 is incomplete and may move higher. A target is calculated for minute wave b that sees it still ending within the most common range.
Minute wave b may again test resistance about the upper edge of the blue Elliott channel.
When minute wave b may again be complete, then minute wave c downwards would be extremely likely to make at least a slight new low below the end of minute wave a at 4,233.13 to avoid a truncation and a very rare running flat.
FIRST ALTERNATE
DAILY CHART
Click chart to enlarge.
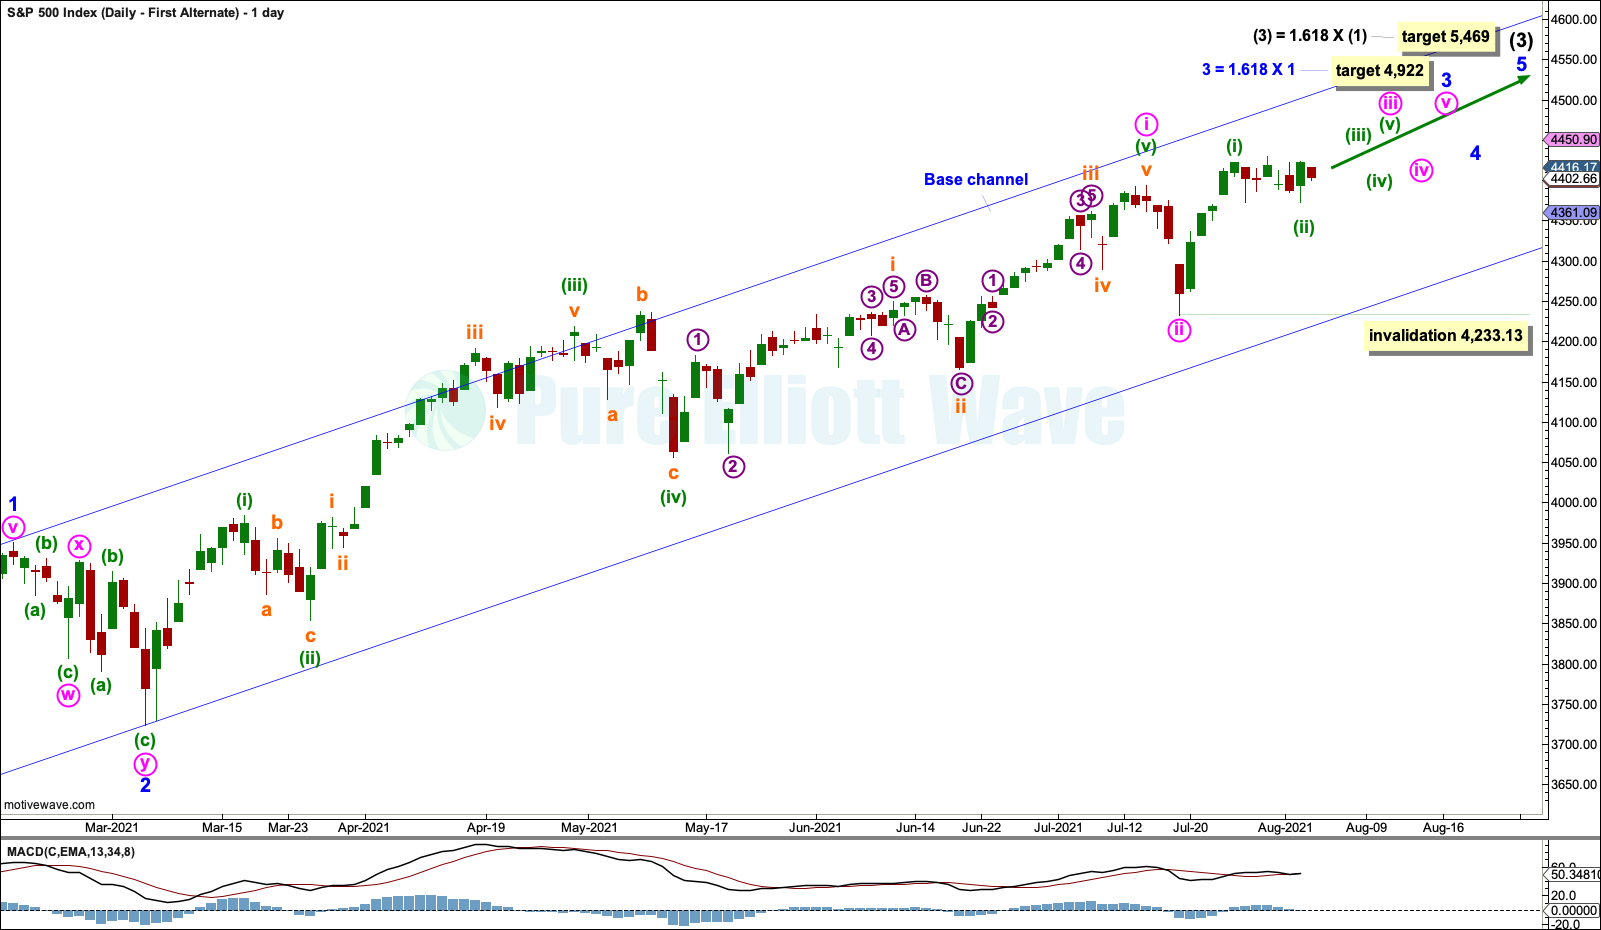
This alternate wave count has a lower probability than the main Elliott wave count. It is named first alternate mostly because we should always expect the trend remains the same until proven otherwise. With new all time highs last week, the S&P is still technically within an upwards trend. However, the cluster of bearish signals puts this wave count behind the main wave count at this stage.
If the degree of labelling within minor wave 3 is moved down one degree, then only minute wave i within minor wave 3 may be complete.
Minute wave ii within minor wave 3 may be over at the last low. A third wave up at minute, minor and intermediate degree may have begun.
Targets are calculated for minor wave 3 and intermediate wave (3) that expect common Fibonacci ratios.
No second wave correction within minute wave iii may move beyond its start below 4,233.13.
HOURLY CHART
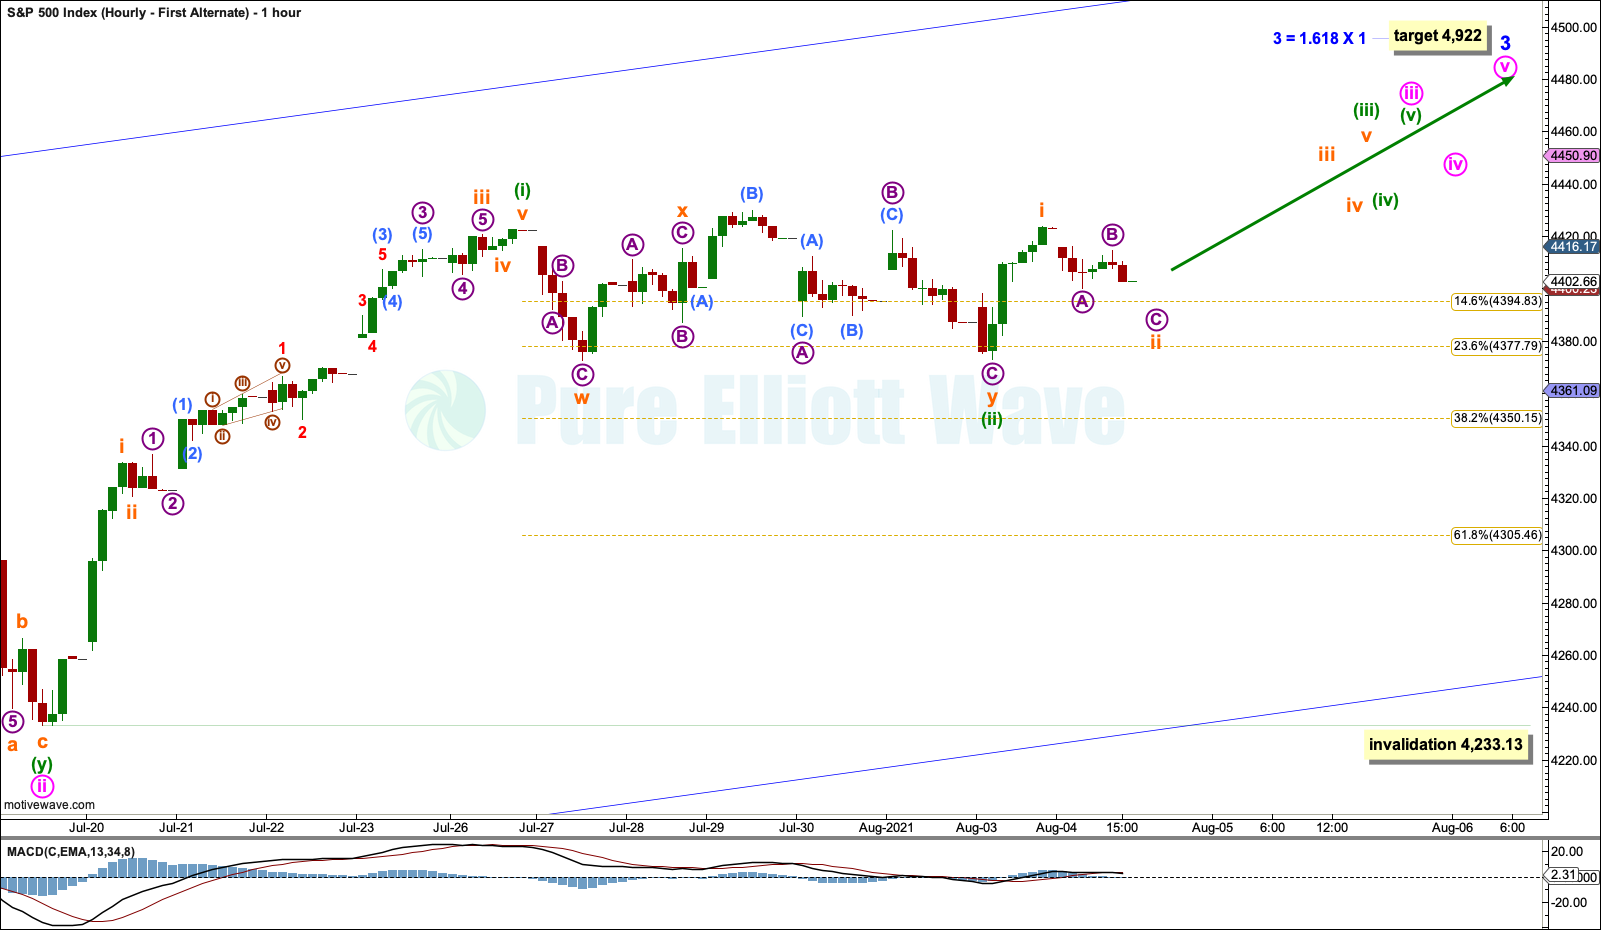
Click chart to enlarge.
Minuette wave (ii) may be complete as a double combination: zigzag – X – expanded flat. If minuette wave (ii) continues lower, then it may not move beyond the start of minuette wave (i) below 4,233.13.
SECOND ALTERNATE
WEEKLY CHART
Click chart to enlarge.
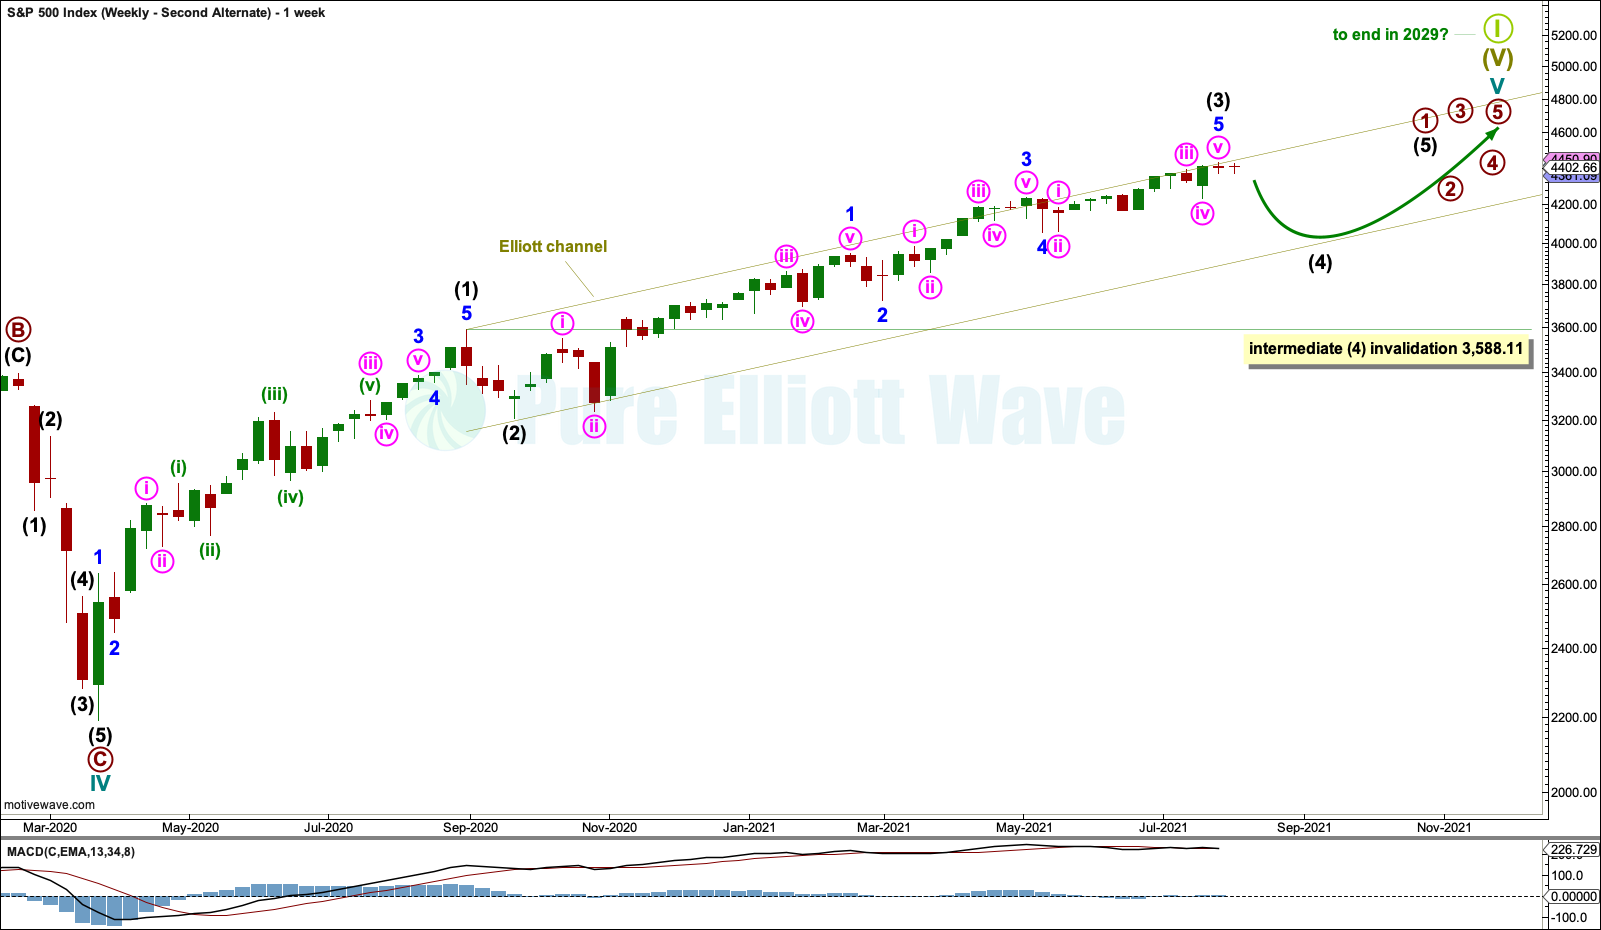
This weekly chart is again considered.
It is possible that intermediate wave (3) is over at the last high. However, it may also continue a little higher.
Intermediate wave (4) may last from three to several weeks and may find support about the lower edge of the Elliott channel. Intermediate wave (4) may not move into intermediate wave (1) price territory below 3,588.11.
Intermediate wave (3) is shorter than intermediate wave (1) by 182.97 points. It is unusual for third waves to be shorter than first waves for the S&P, particularly of a higher degree such as intermediate. This reduces the probability of this alternate wave count.
This alternate wave count is considered because the bearish divergence between price and the AD line is increasingly strong.
THIRD ALTERNATE
WEEKLY CHART
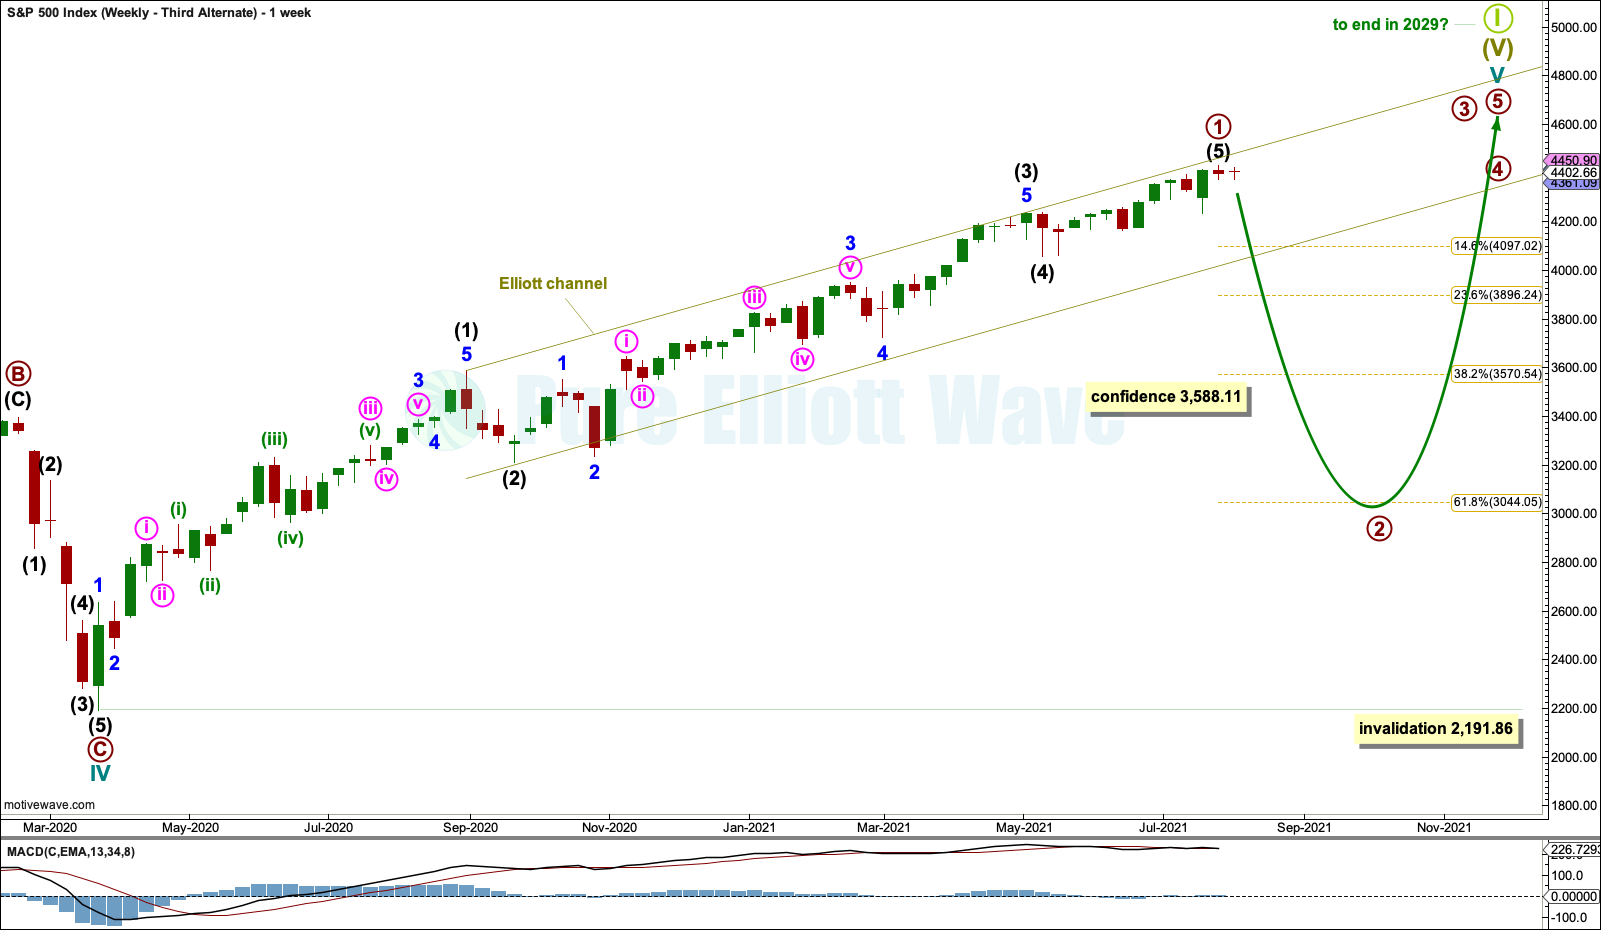
Click chart to enlarge.
This third alternate Elliott wave count is considered because it is technically possible. However, primary wave 2 may correct to the 0.618 Fibonacci ratio, which would be a 31% reduction in market value and meet the technical definition of a bear market. This is possible but has a very low probability as there is only 18 days of bearish divergence between price and the AD line. Within the last (almost) 100 years, only three bear markets have occurred following less than 4 months bearish divergence between price and the AD line. If this wave count is correct, then it would exhibit bearish divergence of less than 4 months a fourth time in almost 100 years; the probability of this alternate is rather low.
Primary wave 2 may last one to a few months. It may not move beyond the start of primary wave 1 below 2,191.86.
TECHNICAL ANALYSIS
WEEKLY CHART
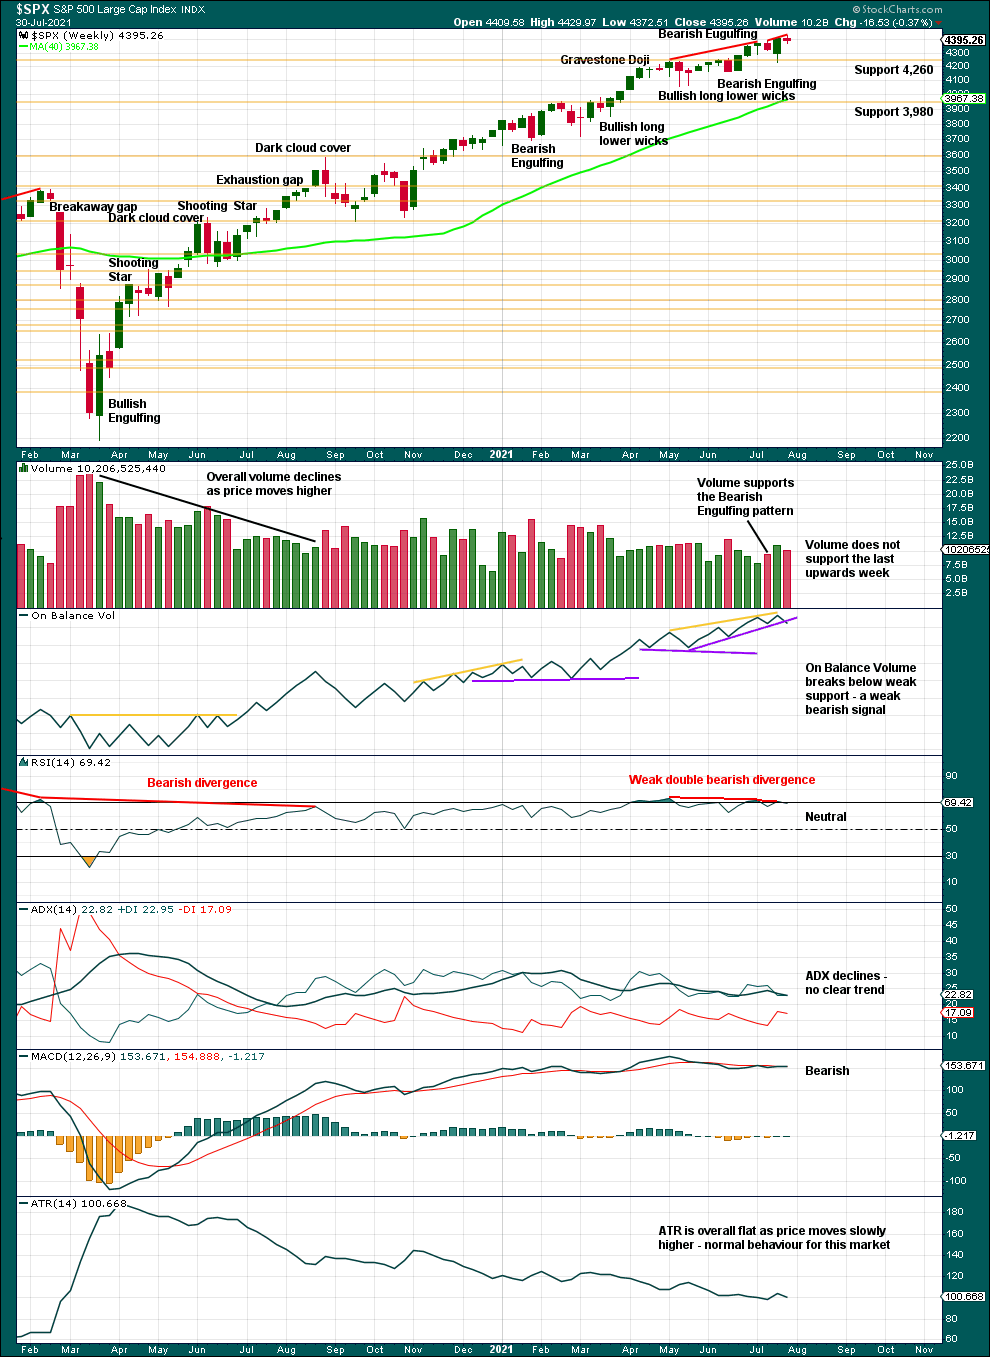
Click chart to enlarge. Chart courtesy of StockCharts.com.
Last week there is now double bearish divergence between price and RSI, although it is weak. On Balance Volume also gives a bearish signal, but that too is weak.
There is some weakness evident in this chart, but it is not greatly concerning. It suggests a more time consuming consolidation or a deeper pullback may occur, but it would still be expected to most likely occur within the larger context of an ongoing bull market.
DAILY CHART
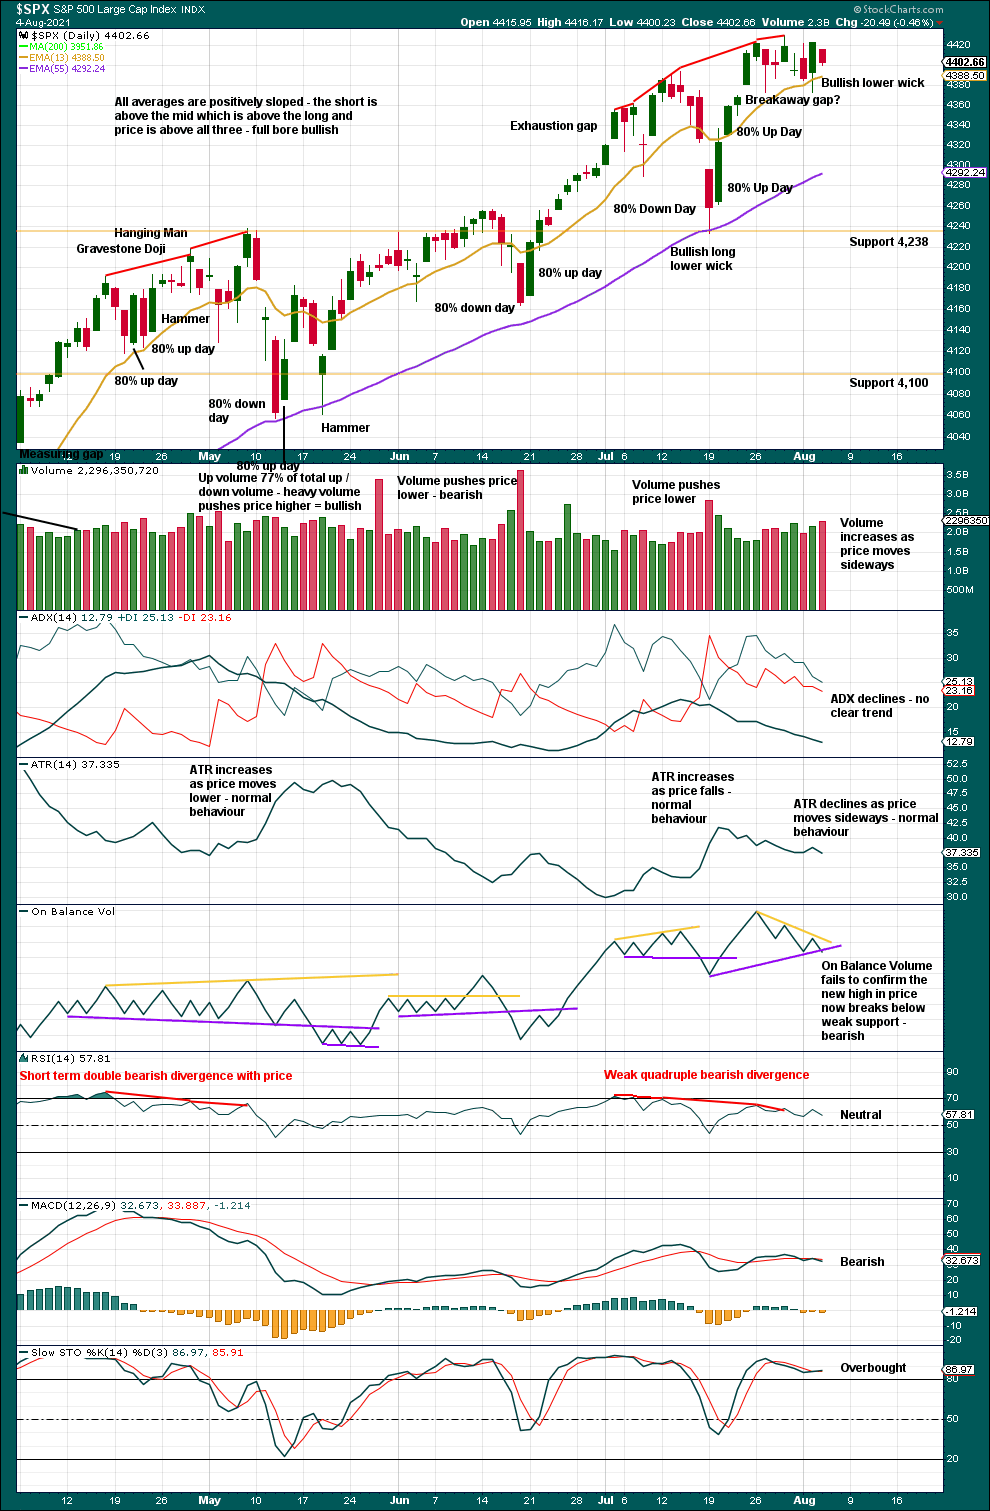
Click chart to enlarge. Chart courtesy of StockCharts.com.
Two back to back 80% up days are now complete off the last low, although they have not come after a 90% or two back to back 80% down days, so this is not enough for confidence in a sustainable low.
The last swing low on the 18th of June though did come with one 80% down day followed by one 80% up day.
However, on the 18th of June there was not a reasonable cluster of bearish signals from the AD line, short-term bearish divergence between price and RSI, nor a reasonable cluster of bearish signals from inverted VIX. The bearish signals are stronger in this instance.
A target from the breakaway gap is at 4,518.04. The gap remains open, so the target remains valid. If the gap is closed, then it would be renamed an exhaustion gap, which would be a bearish signal.
Bearish divergence between price and RSI is now quadruple, although it is still reasonably weak.
The balance of volume today is most likely down and volume today again pushed price lower. The short-term volume profile and now On Balance Volume remain bearish and support the main Elliott wave count.
BREADTH – AD LINE
WEEKLY CHART
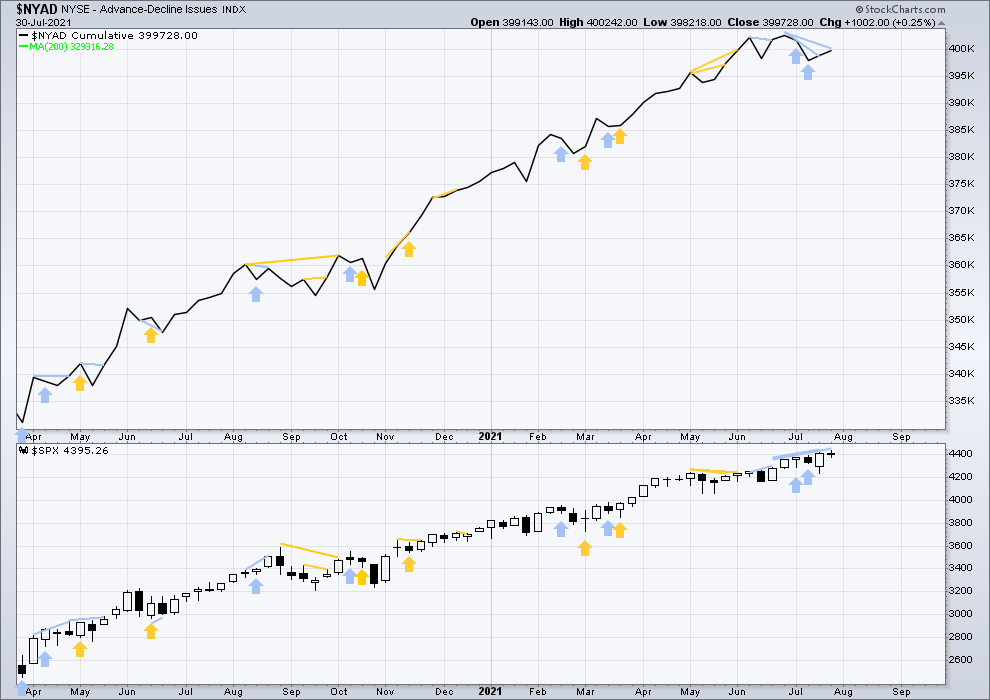
Click chart to enlarge. Chart courtesy of StockCharts.com. So that colour blind members are included, bearish signals will be noted with blue and bullish signals with yellow.
Breadth should be read as a leading indicator.
Lowry’s Operating Companies Only AD line has made a new all time high on the 8th of June. There is now over one and a half months of bearish divergence between the OCO AD line and price. This supports the main and second alternate Elliott wave counts but not necessarily the third alternate Elliott wave count.
Large caps all time high: 4,429.97 on Jul 29, 2021.
Mid caps all time high: 2,780.08 on May 10, 2021.
Small caps all time high: 1,417.45 on June 8, 2021.
With over 2 months of weakness in small and mid caps, some pullback or consolidation may result sooner. The Elliott wave count and supporting technical analysis suggest it may have begun.
Again, price makes a new all time high, but the AD line does not. This adds to the small cluster of bearish divergence and supports the main Elliott wave count.
DAILY CHART
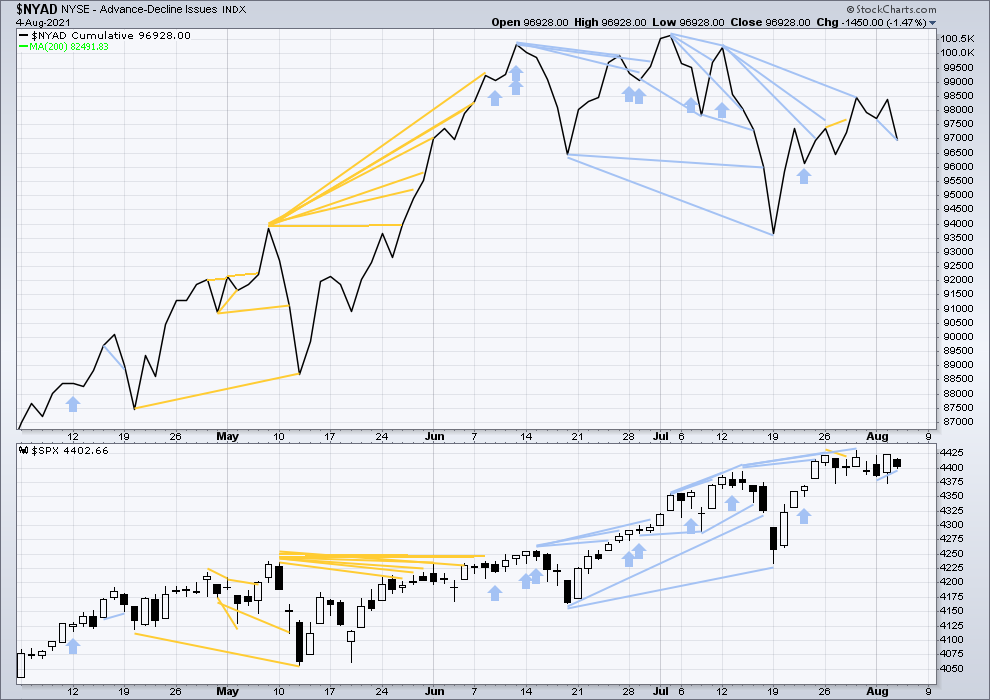
Click chart to enlarge. Chart courtesy of StockCharts.com. So that colour blind members are included, bearish signals will be noted with blue and bullish signals with yellow.
Today the AD line has made a new low below the low two sessions prior, but price has not. This divergence is bearish for the very short term. A reasonably strong cluster of bearish divergence remains, which supports the main or second alternate Elliott wave counts.
The last all time high for the AD line occurred just 18 days prior to the last all time high in price. With less than four weeks of bearish divergence, probability still favours a short-term pullback or consolidation and not a fully fledged bear market. This suggests the main Elliott wave count or second alternate Elliott wave count may be preferred.
VOLATILITY – INVERTED VIX CHART
WEEKLY CHART
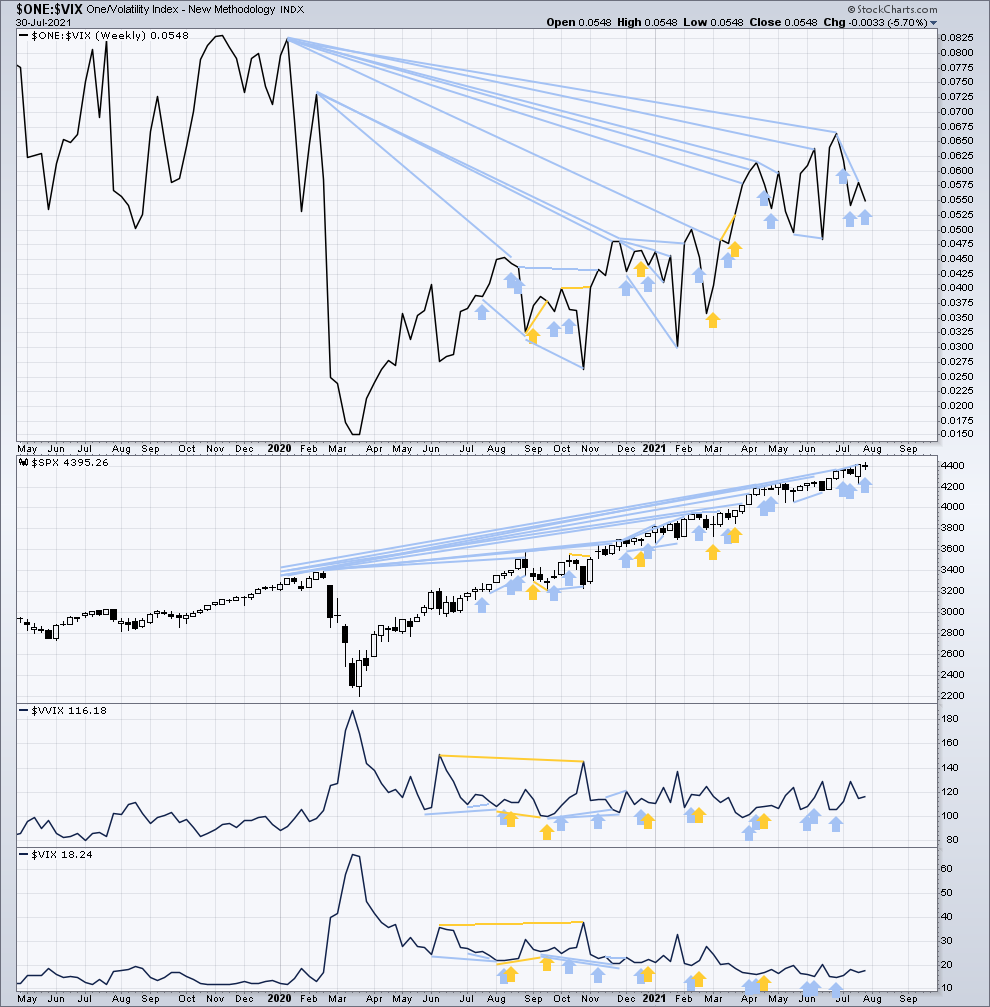
Click chart to enlarge. Chart courtesy of StockCharts.com. So that colour blind members are included, bearish signals will be noted with blue and bullish signals with yellow.
Inverted VIX remains well below all time highs. The all time high for inverted VIX was in the week beginning October 30, 2017. There is over 3 years of bearish divergence between price and inverted VIX. This bearish divergence may develop further before the bull market ends. It may be a very early indicator of an upcoming bear market, but it is not proving to be useful in timing. It may support the third alternate Elliott wave count.
Last week price moved higher, but inverted VIX moves lower. This is another single week instance of bearish divergence which adds to the cluster of short and mid-term bearish divergence. This supports either the main or second alternate Elliott wave counts.
Comparing VIX and VVIX at the weekly chart level:
Both have moved higher. There is no new short-term divergence.
DAILY CHART
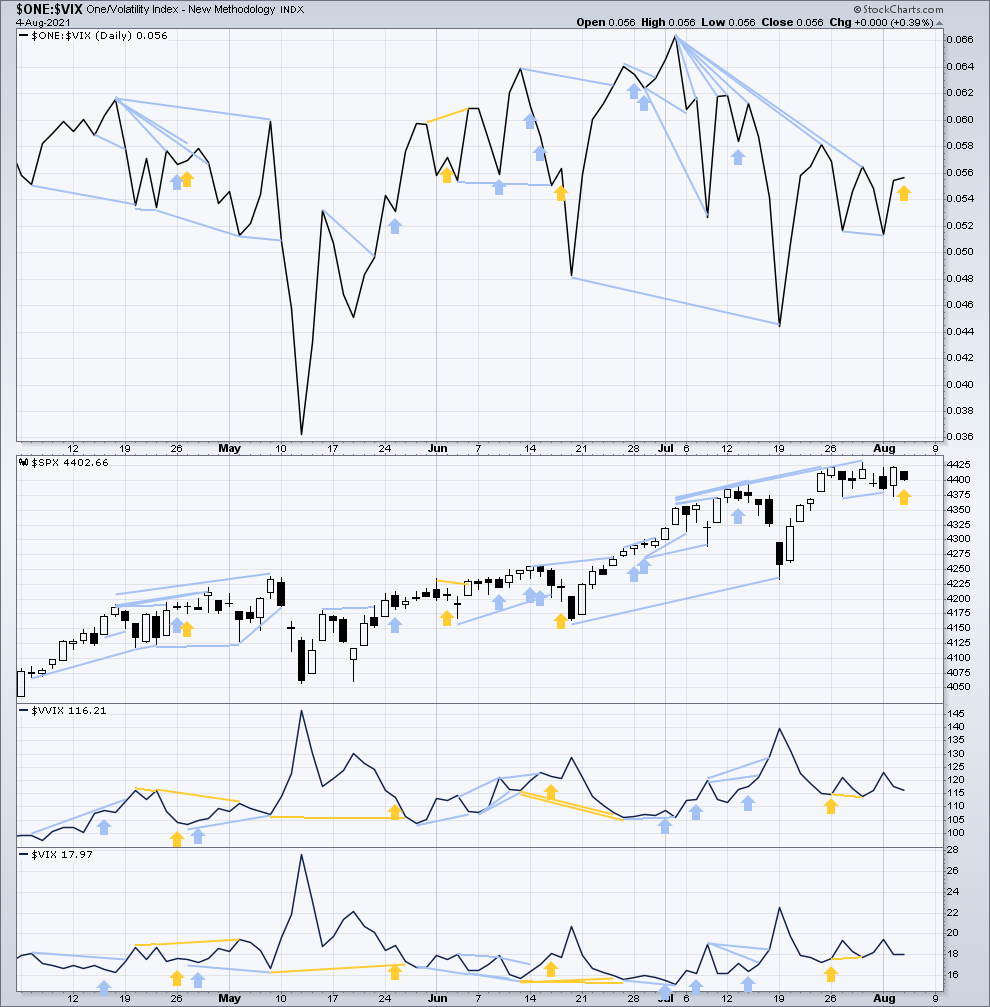
Click chart to enlarge. Chart courtesy of StockCharts.com. So that colour blind members are included, bearish signals will be noted with blue and bullish signals with yellow.
Today price has moved lower, but inverted VIX has moved higher. This very short-term divergence is bullish and supports the second hourly chart for the main wave count, or the first alternate Elliott wave count.
The cluster of bearish short and mid-term divergence remains and supports either the main or second alternate Elliott wave counts.
Comparing VIX and VVIX at the daily chart level:
Both VIX and VVIX have moved lower today. There is no new short-term divergence.
DOW THEORY
Dow Theory confirms a new bull market with new highs made on a closing basis:
DJIA: 29,568.57 – closed above on 16th November 2020.
DJT: 11,623.58 – closed above on 7th October 2020.
Most recently, on 10th May 2021 both DJIA and DJT have made new all time highs. An ongoing bull market is again confirmed by Dow Theory.
Adding in the S&P and Nasdaq for an extended Dow Theory, confirmation of a bull market would require new highs made on a closing basis:
S&P500: 3,393.52 – closed above on 21st August 2020.
Nasdaq: 9,838.37 – closed above on June 8, 2020.
The following major swing lows would need to be seen on a closing basis for Dow Theory to confirm a change from bull to a bear market:
DJIA: 18,213.65
DJT: 6,481.20
Adding in the S&P and Nasdaq for an extended Dow Theory, confirmation of a new bear market would require new lows on a closing basis:
S&P500: 2,191.86
Nasdaq: 6,631.42
Published @ 05:54 p.m. ET.
—
Careful risk management protects your trading account(s).
Follow my two Golden Rules:
1. Always trade with stops.
2. Risk only 1-5% of equity on any one trade.
—
New updates to this analysis are in bold.
—