Elliott Wave Stock Market
  • Analysis
    • S&P 500
    • Lara’s Weekly
    • Public
  • Resources
  • About
    • Testimonials
    • Contact
    • FAQ
    • TOS
  • Subscribe
    • S&P 500 Daily
    • Lara’s Weekly
    • Subscription Plans
  • My Account
    • Login
Select Page
Russell 2000: Elliott Wave Analysis | Charts – July 24, 2020

Russell 2000: Elliott Wave Analysis | Charts – July 24, 2020

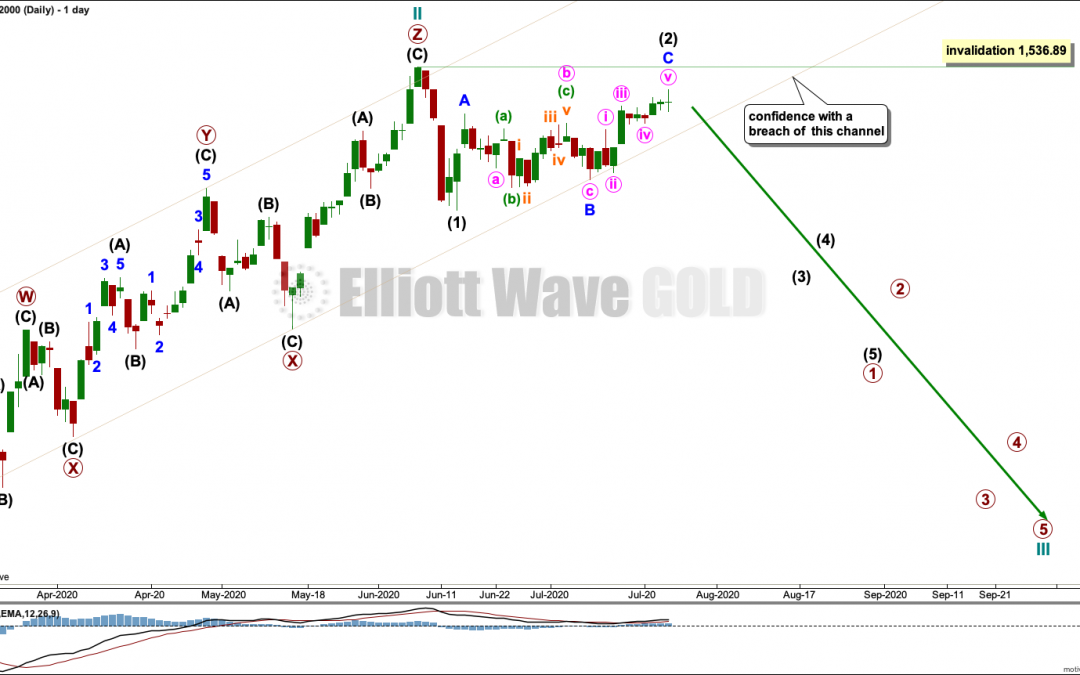
by Lara | Jul 25, 2020 | Public Analysis, Russell 2000, Russell 2000 Historical

Russell 2000: Elliott Wave Analysis | Charts – July 24, 2020 The bounce may be over. Summary: A target for a third wave down is at 326. The channel on the daily chart must be breached for any confidence in this view. A new high above 1,715.08 would indicate a more...
Russell 2000: Elliott Wave Analysis | Charts – April 9, 2020

Russell 2000: Elliott Wave Analysis | Charts – April 9, 2020

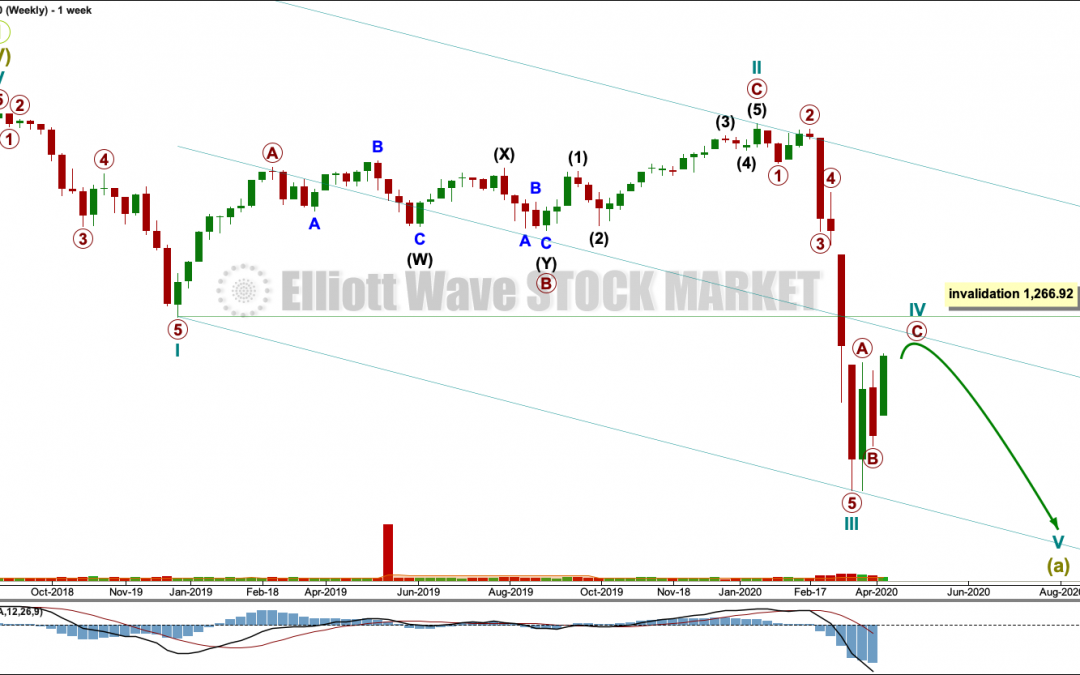
by Lara | Apr 9, 2020 | Public Analysis, Russell 2000, Russell 2000 Historical

Russell 2000: Elliott Wave Analysis | Charts – April 9, 2020 Elliott wave analysis of Russell 2000. Summary: This bounce may end shortly. If price remains below 1,266.92, then this analysis would remain bearish. A new high above 1,266.92 by any amount at any time...

MEMBERS LOGIN

You are not currently logged in.


» Lost your Password?

Free Elliott Wave Structures Guide

Elliott Wave Stock Market - Elliott Wave Structures Guide

Free Wave Notation

Elliott Wave Stock Market - Wave Notation

Categories

Archives

Partners


* When you purchase a MotiveWave product via links on this website, you won't pay a penny more, but I'll get a small commission.
  • Facebook
  • Twitter
© Elliott Wave Stock Market
This EWSM website uses cookies to ensure members and visitors get the best experience. By continuing, you agree to the use of cookies on this website. - To learn more see TOS.