by Lara | Aug 19, 2021 | S&P 500, S&P 500 + DJIA
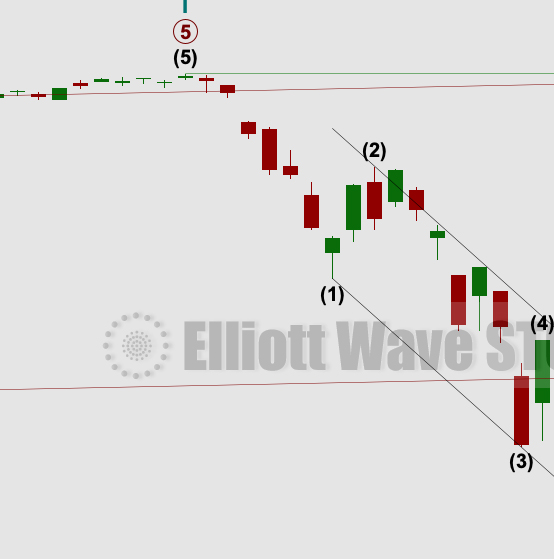
S&P 500: Elliott Wave and Technical Analysis | Charts – August 19, 2021 Downwards movement continues as all three Elliott wave counts expected. The first two Elliott wave counts have a reasonable probability. The second alternate remains highly unlikely. Summary:...
by Lara | Jul 27, 2021 | S&P 500, S&P 500 + DJIA
S&P 500: Elliott Wave and Technical Analysis | Charts – July 27, 2021 A downwards session was expected by the main Elliott wave count today, which is what has happened. Alternate Elliott wave counts are again considered. Summary: There is a cluster of bearish...
by Lara | Jul 1, 2021 | S&P 500, S&P 500 + DJIA
S&P 500: Elliott Wave and Technical Analysis | Charts – July 1, 2021 Further upwards movement was expected from the main Elliott wave count, which has support from classic technical analysis. Today the alternate Elliott wave count is discarded due to low...
by Lara | Jun 8, 2021 | S&P 500, S&P 500 + DJIA
S&P 500: Elliott Wave and Technical Analysis | Charts – June 8, 2021 A strong cluster of signals from the AD line suggests the next direction for price. This supports the Elliott wave count. Summary: The trend is up. The next target for the next wave up is at...
by Lara | May 17, 2021 | S&P 500, S&P 500 + DJIA
S&P 500: Elliott Wave and Technical Analysis | Charts – May 17, 2021 A small inside day today closes red with a long lower wick. Volume and breadth today indicate which, bulls or bears, dominated the session. The main Elliott wave count remains the same. Summary:...
by Lara | Apr 20, 2021 | S&P 500, S&P 500 + DJIA
S&P 500: Elliott Wave and Technical Analysis | Charts – April 20, 2021 The main Elliott wave count yesterday expected more downwards movement today, which is what has happened. Summary: The wave count expects a third wave at three large degrees may have moved...
by Lara | Mar 11, 2021 | S&P 500, S&P 500 + DJIA
S&P 500: Elliott Wave and Technical Analysis | Charts – March 11, 2021 New all time highs were overall expected for the S&P. This rise is being led by small caps, which supports the Elliott wave count. Summary: The pullback may now be complete; the alternate...
by Lara | Feb 16, 2021 | S&P 500, S&P 500 + DJIA
S&P 500: Elliott Wave and Technical Analysis | Charts – February 16, 2021 A higher high and a higher low continues the expectation of upwards movement. Price has slowed down at a strong resistance line. Summary: For the very short term, price is still at a...
by Lara | Jan 22, 2021 | S&P 500, S&P 500 + DJIA
S&P 500: Elliott Wave and Technical Analysis | Charts – January 22, 2021 For the short term, a shallow pullback was expected to develop. So far this is exactly what has happened. The Elliott wave counts remain the same. Summary: The wave count expects the low of...
