
S&P 500: Elliott Wave and Technical Analysis | Charts – May 17, 2021
A small inside day today closes red with a long lower wick. Volume and breadth today indicate which, bulls or bears, dominated the session.
The main Elliott wave count remains the same.
Summary: Friday completes a near 90% up day. This suggests the low may be sustainable; however, coming within 3 sessions of an 80% down day, it is not strong enough for strong confidence.
The main Elliott wave count expects a small fourth wave may have ended. The next target for the next wave up is at 4,900.
An alternate Elliott wave count allows for more downwards movement to a first target at 3,980.47. It has a lower probability.
The biggest picture, Grand Super Cycle analysis, is here.
Monthly charts are last updated here with video here.
MAIN WAVE COUNT
WEEKLY CHART
Click chart to enlarge.
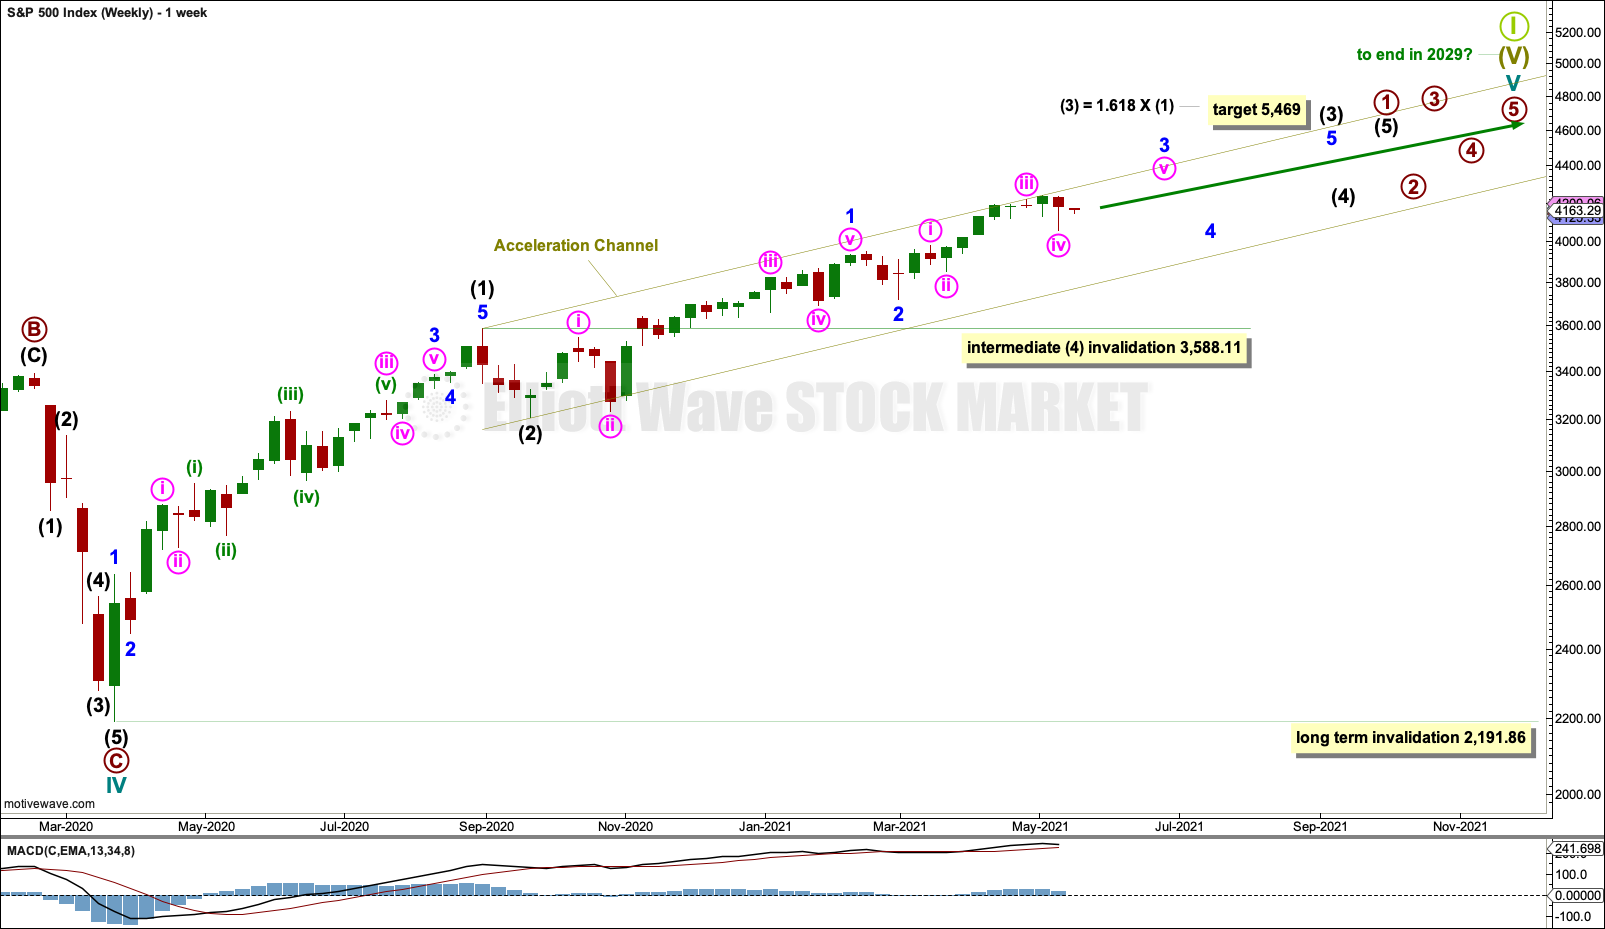
Cycle wave V may last from one to several years. So far it is in its fourteenth month.
This wave count may allow time for the AD line to diverge from price as price makes final highs before the end of the bull market. The AD line most commonly diverges a minimum of 4 months prior to the end of a bull market. A longer divergence is positively correlated with a deeper bear market. A shorter divergence is positively correlated with a more shallow bear market. With zero divergence at this stage, if a surprise bear market does develop here, then it would likely be shallow.
A longer divergence between price and the AD line would be expected towards the end of Grand Super Cycle wave I.
It is possible that cycle wave V may continue until 2029, if the 2020s mirror the 1920s. Either March or October 2029 may be likely months for the bull market to end.
Cycle wave V would most likely subdivide as an impulse. But if overlapping develops, then an ending diagonal should be considered. This chart considers the more common impulse.
There is already a Fibonacci ratio between cycle waves I and III within Super Cycle wave (V). The S&P500 often exhibits a Fibonacci ratio between two of its actionary waves but rarely between all three; it is less likely that cycle wave V would exhibit a Fibonacci ratio. The target for Super Cycle wave (V) to end would best be calculated at primary degree, but that cannot be done until all of primary waves 1, 2, 3 and 4 are complete.
Primary wave 1 within cycle wave V may be incomplete. This gives a very bullish wave count, expecting a long duration for cycle wave V which has not yet passed its middle strongest portion.
Within primary wave 1: Intermediate waves (1) and (2) may be complete, and intermediate wave (3) may now be nearing an end.
Within intermediate wave (3): Minor waves 1 and 2 may be complete, and minor wave 3 may be nearing an end.
Intermediate wave (4) may not move into intermediate wave (1) price territory below 3,588.11.
An acceleration channel is drawn about cycle wave V. Draw the first trend line from the end of intermediate wave (1) to the last high, then place a parallel copy on the end of intermediate wave (2). Keep redrawing the channel as price continues higher. When primary wave 1 is complete, then this channel would be drawn using Elliott’s first technique. The channel may then be used to provide confidence that primary wave 1 may be over and primary wave 2 may have arrived; when the channel is breached by downwards movement it would indicate a trend change.
When primary wave 1 may be complete, then a multi-month pullback or consolidation may unfold for primary wave 2. It is possible that primary wave 2 may meet the technical definition of a bear market; it may correct to 20% or more of market value.
Primary wave 2 may not move beyond the start of primary wave 1 below 2,191.86.
DAILY CHART
Click chart to enlarge.
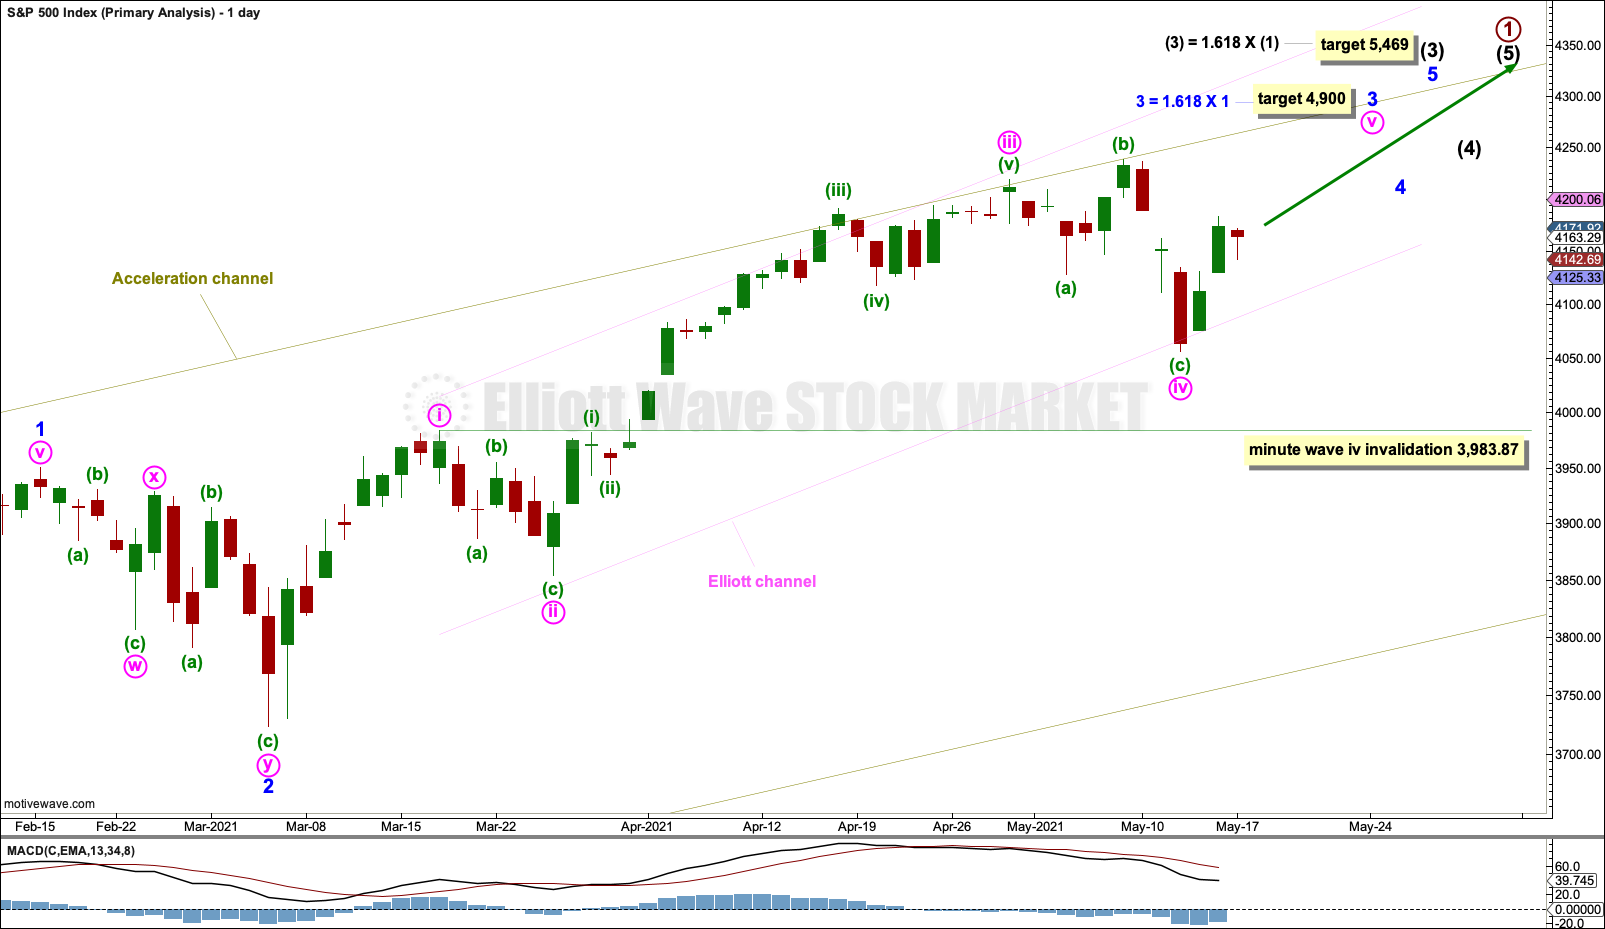
The daily chart focusses on minor wave 3 within intermediate wave (3).
Intermediate wave (3) may be extending. Third waves are most commonly extended for the S&P500, so this wave count follows a common tendency. A target is calculated for minor wave 3, which is also expected to be extending.
If it continues lower, then minute wave iv within minor wave 3 may not move into minute wave i price territory below 3,983.87. Minute wave iv may have ended as an expanded flat.
HOURLY CHART
Click chart to enlarge.
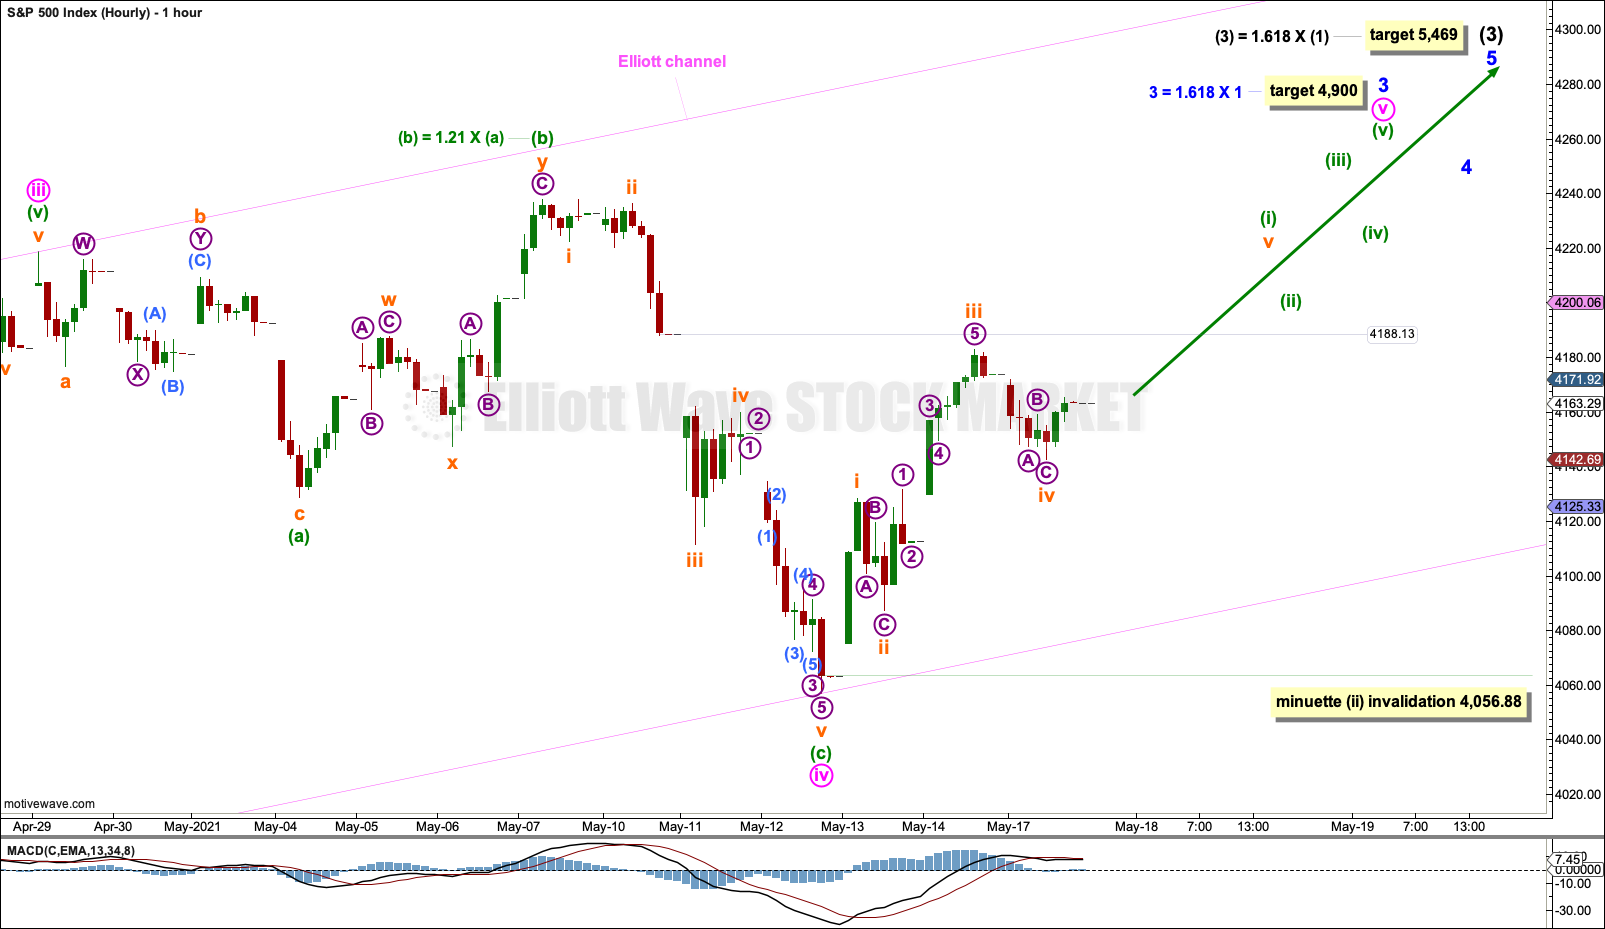
Minute wave iv may be a complete expanded flat.
The last gap noted on the chart may be a breakaway gap (these are not closed until the resulting trend is complete). The gap would be a pattern gap if it is closed, which would be bullish.
A new high above 4,188.13 would be bullish.
The target for minor wave 3 remains the same.
Minute wave v is expected to be a long extension. Within minute wave v: Minuette wave (i) may be incomplete, and minuette wave (ii) may not move beyond the start of minuette wave (i) below 4,056.88.
ALTERNATE WAVE COUNT
WEEKLY CHART
Click chart to enlarge.
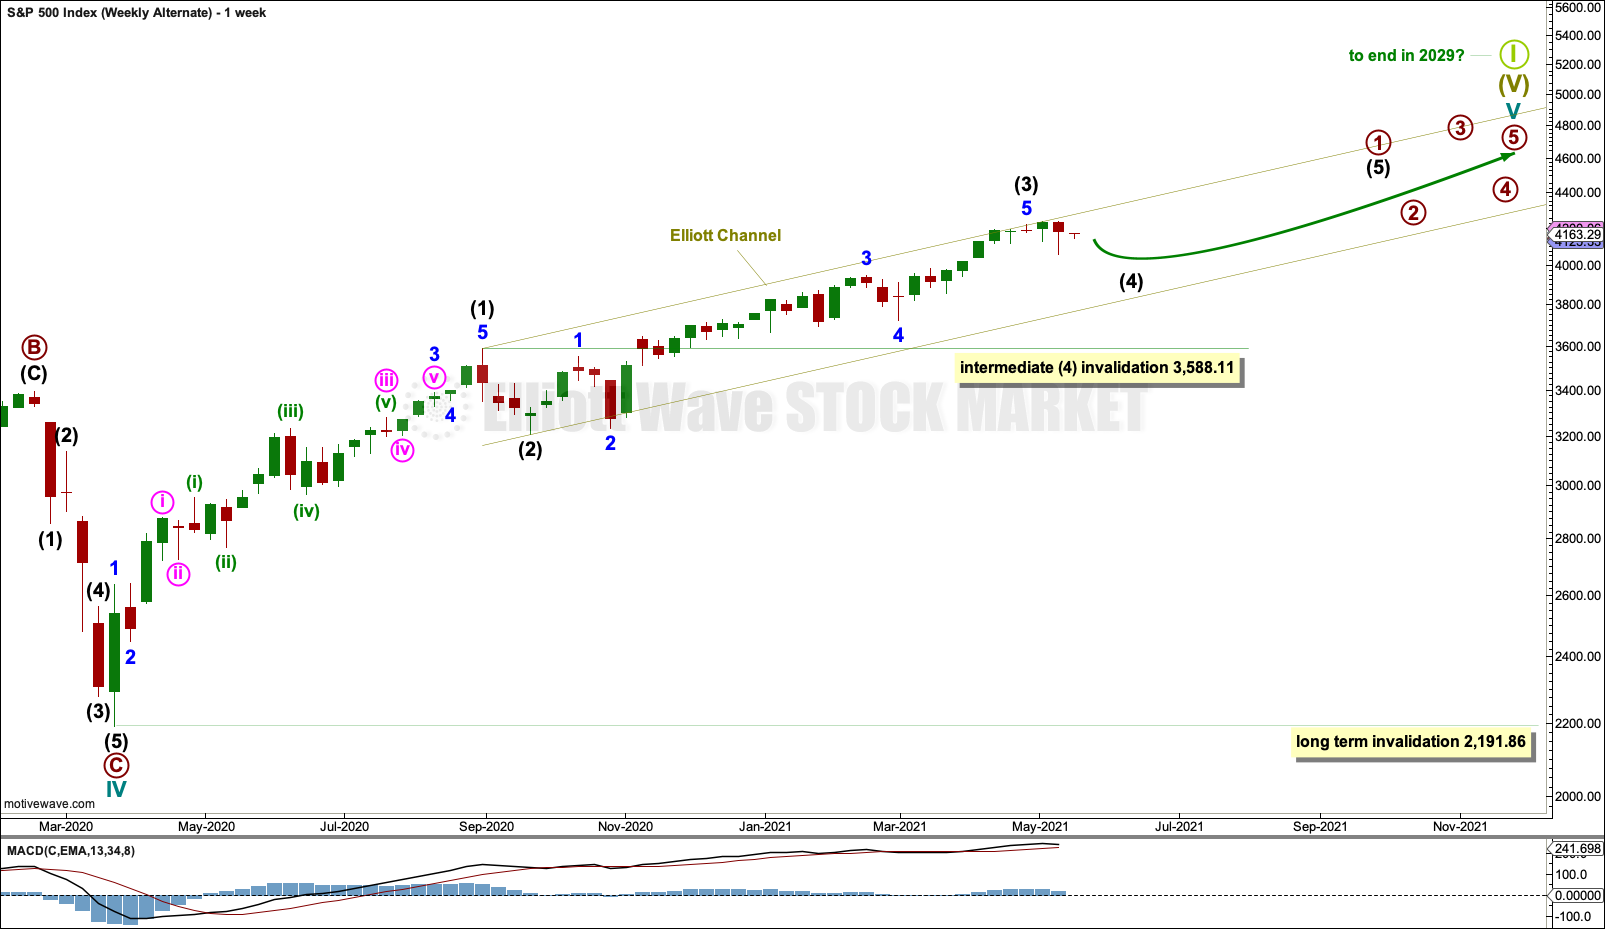
If this pullback is at intermediate degree, then intermediate waves (1), (2) and (3) may all be complete. Intermediate wave (3) is considerably shorter than intermediate wave (1). The S&P500 has a strong bullish bias and a tendency to exhibit extended third waves. Any wave count which expects a third wave is shorter than its counterpart first wave must necessarily have a low probability.
Intermediate wave (4) may be incomplete. It may not move into intermediate wave (1) price territory below 2,191.86.
The channel drawn about primary wave 1 is drawn using Elliott’s first technical for an impulse. Draw the first trend line from the ends of intermediate waves (1) to (3), then place a parallel copy on the end of intermediate wave (2). If intermediate wave (4) is deep, then it may find support about the lower edge of this channel.
DAILY CHART
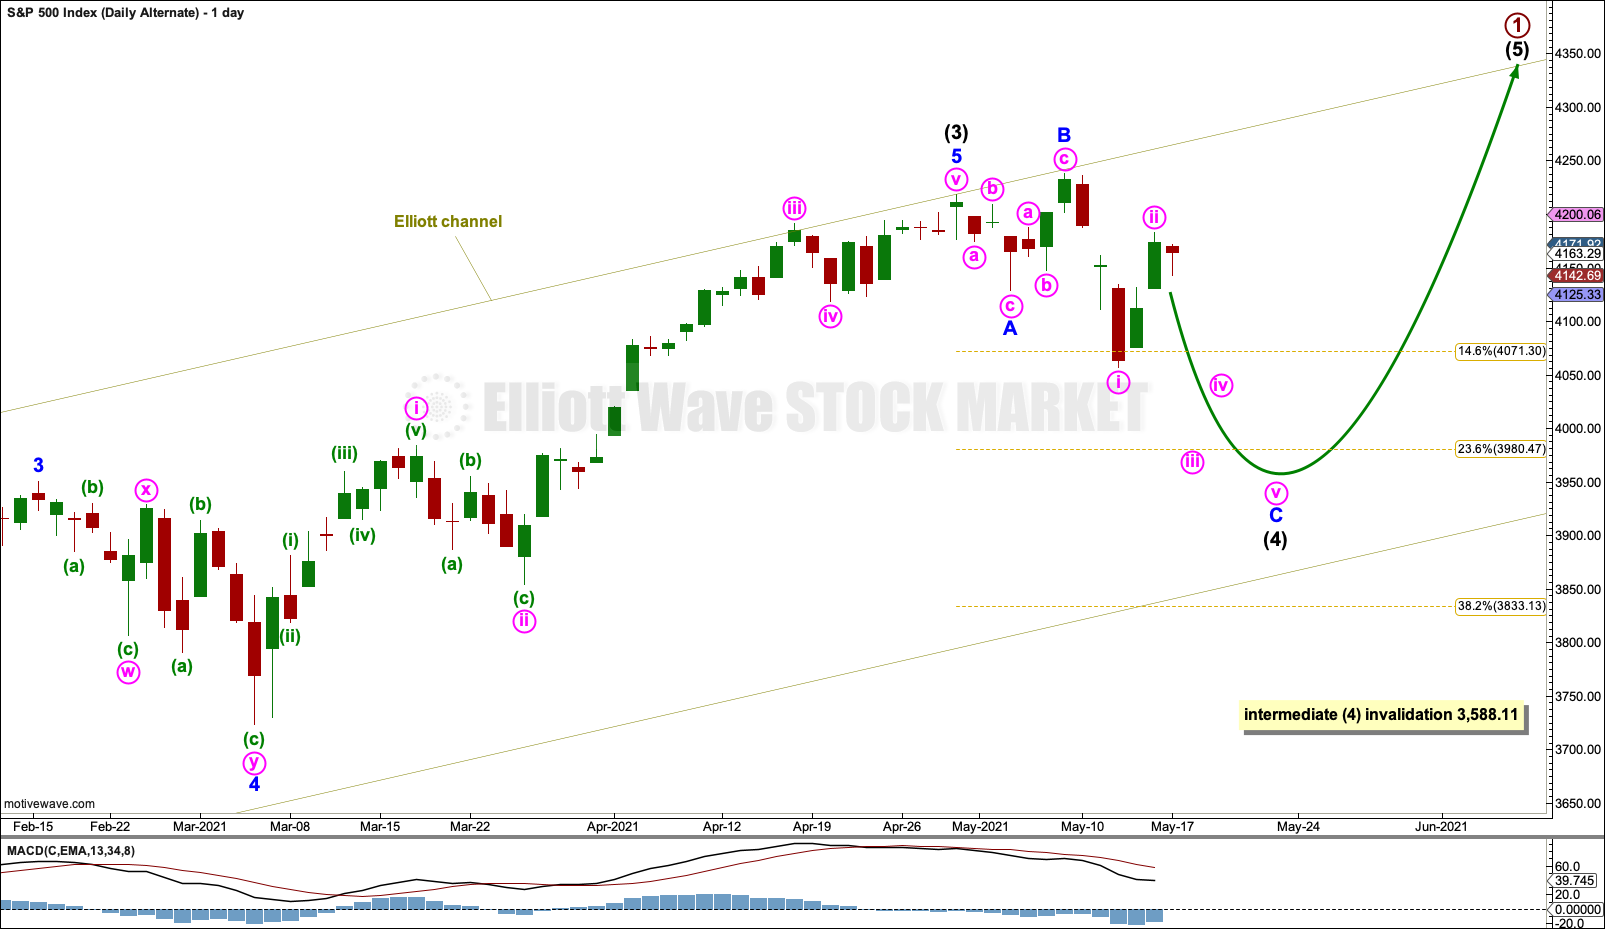
Click chart to enlarge.
Intermediate wave (4) may continue lower as an expanded flat. The first target for this to end may be the 0.236 Fibonacci ratio of intermediate wave (3) at 3,980.47.
If the main Elliott wave count is invalidated with a new low below 3,983.87, then this alternate may be used.
A new all time high this week may see this alternate Elliott wave count discarded.
HOURLY CHART
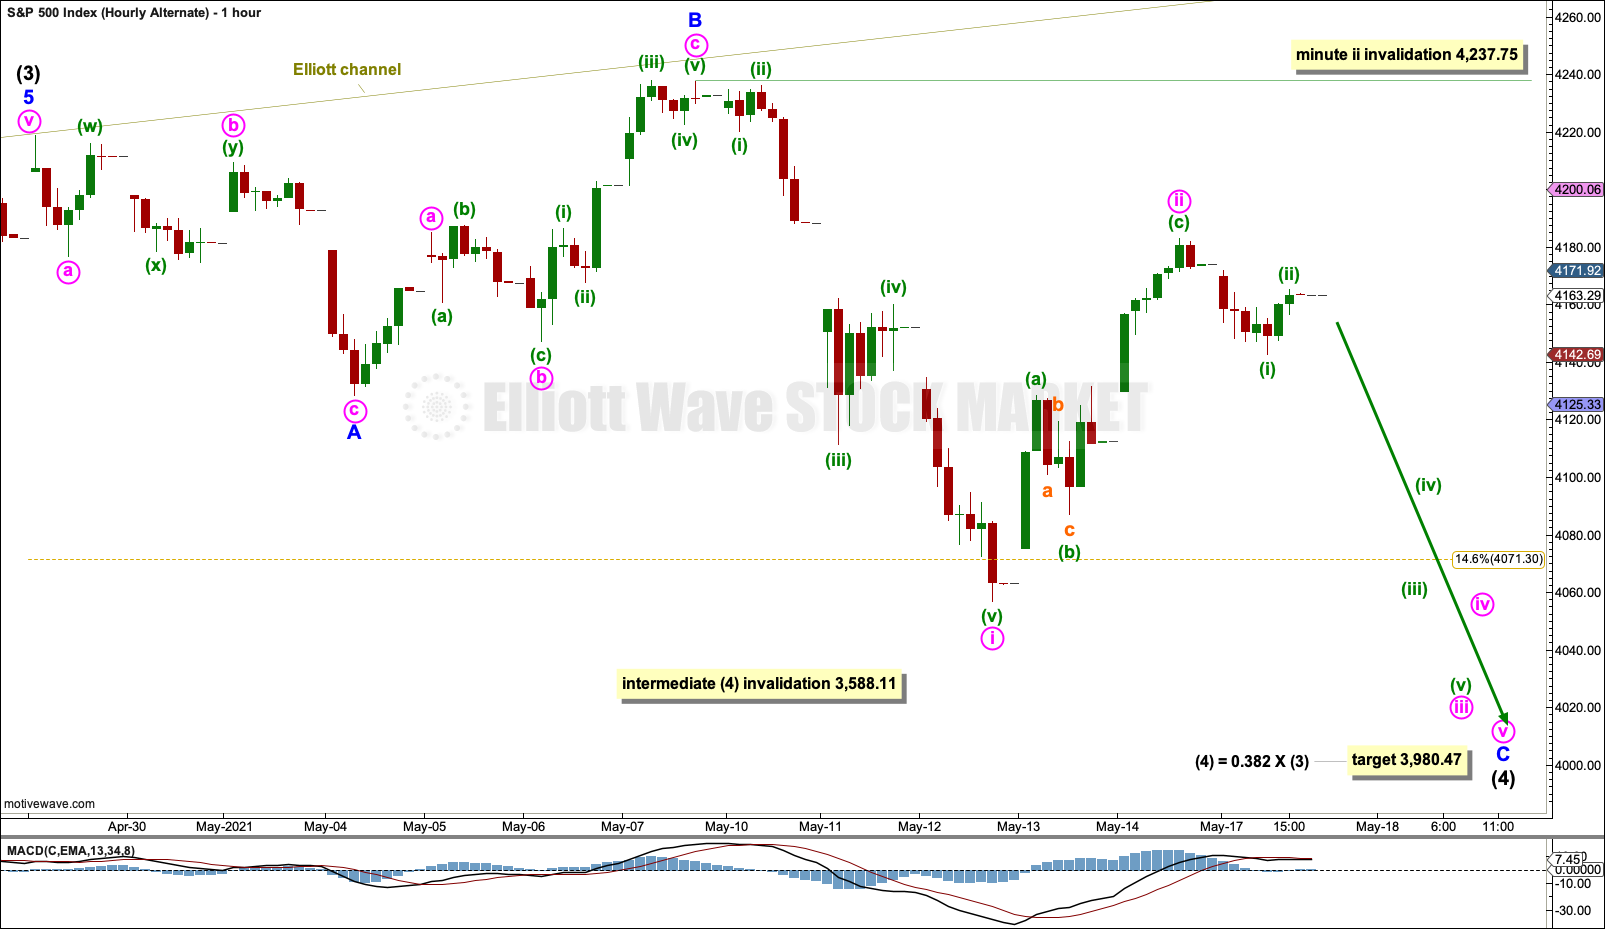
Click chart to enlarge.
If intermediate wave (4) is continuing lower as an expanded flat, then within it minor wave C may be an incomplete impulse. Within minor wave C: Minute wave i may be over, and minute wave ii may also be over (but it may also continue higher as a double zigzag). Minute wave ii may not move beyond the start of minute wave i above 4,237.75.
TECHNICAL ANALYSIS
WEEKLY CHART
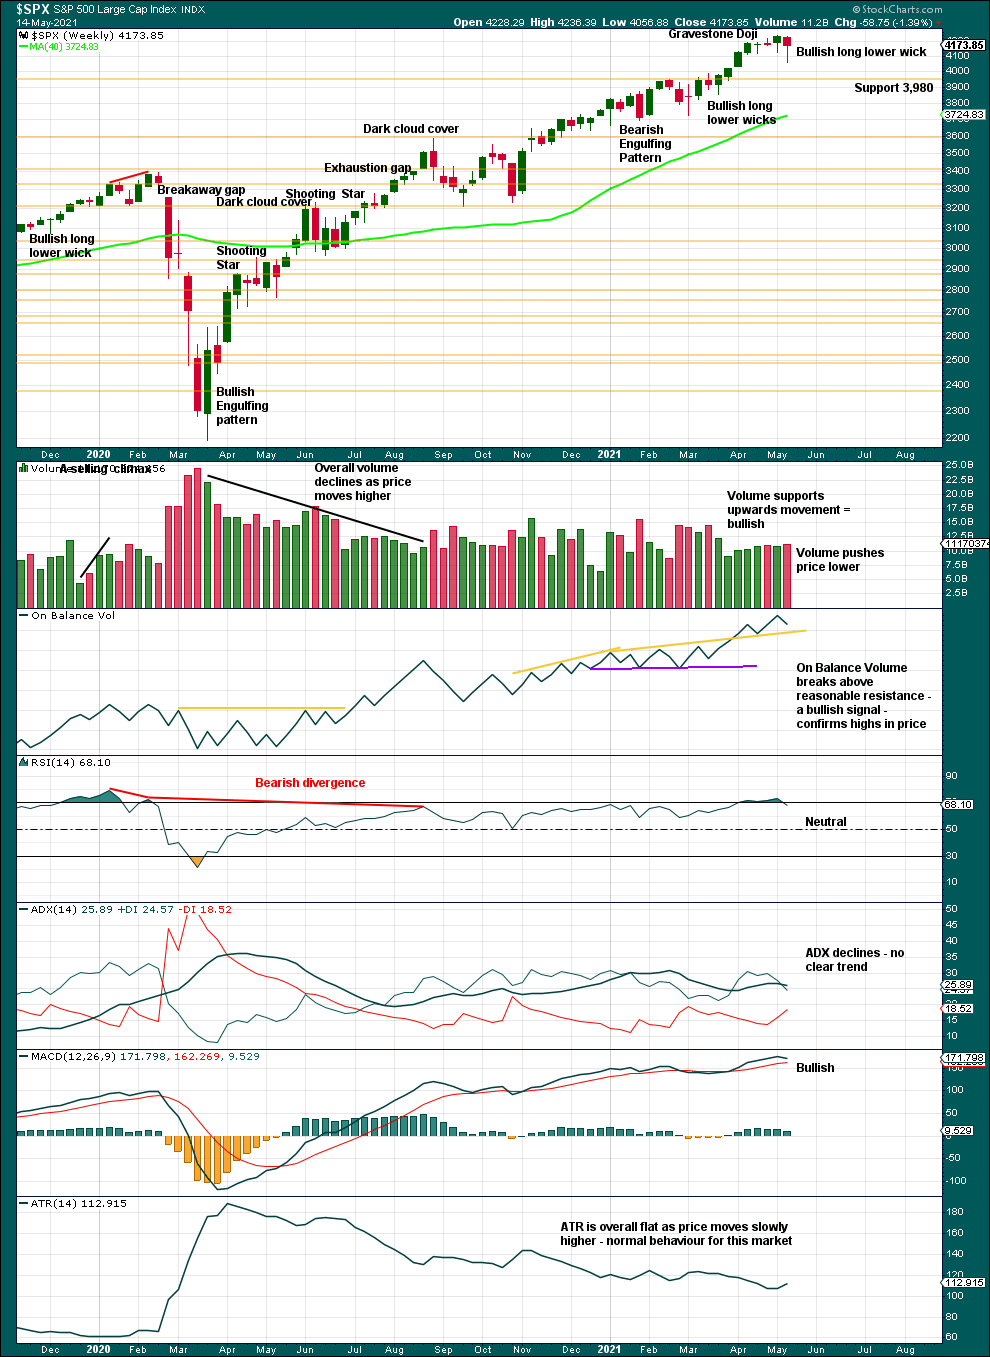
Click chart to enlarge. Chart courtesy of StockCharts.com.
A series of higher highs and higher lows off the low of March 2020 continues. The last short-term swing low is now at 3,723.34. While this remains intact, the dominant view should be of an upwards trend. There is a long way for this trend to run before conditions may become extreme.
This chart has the look of a sustainable bull market in a relatively early stage; there is as yet no evidence that a larger correction should begin here. Although RSI very recently reached overbought, this market has a strong bullish bias and RSI can move deeply overbought and remain there for years prior to the bull market ending.
The long lower wick on the last weekly candlestick again suggests more upwards movement this week.
DAILY CHART
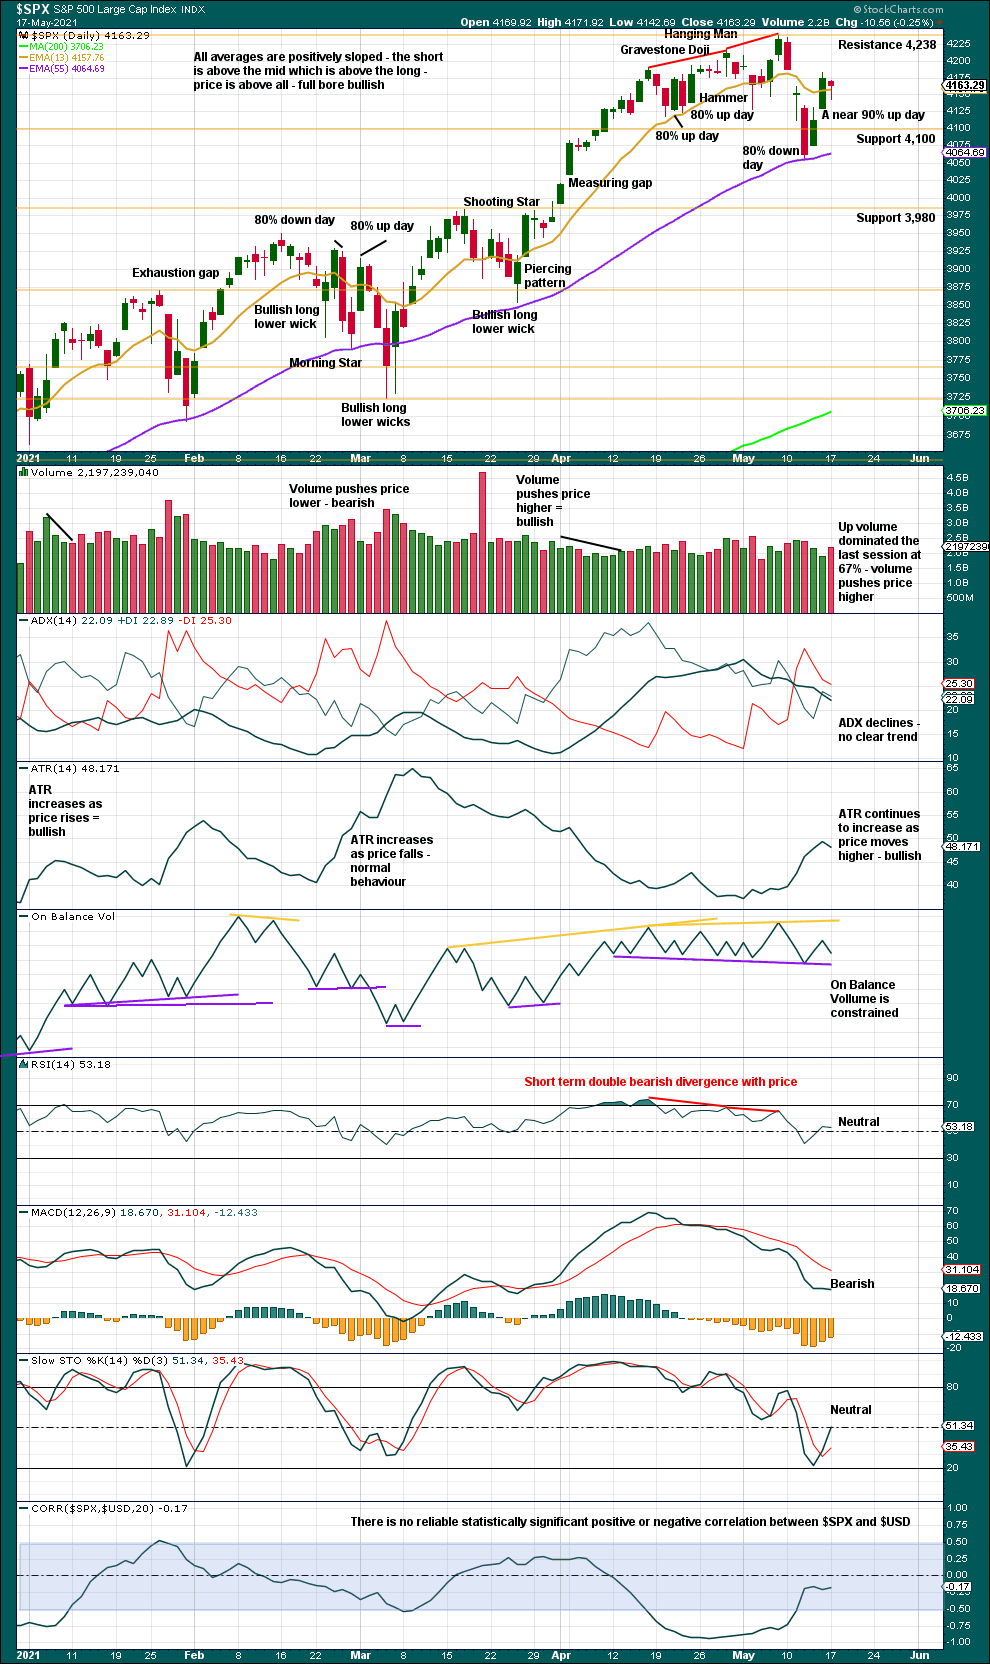
Click chart to enlarge. Chart courtesy of StockCharts.com.
The series of higher highs and higher lows from the low of the 30th of October continues.
Pullbacks are a normal and to be expected part of a bullish trend.
One strong signal of a sustainable low in place, after some decline in price, is a 90% down day or two back to back 80% down days followed within 3 or 4 sessions by a 90% up day or two back to back 80% up days. Currently, this description is not met. However, a near 90% up day following only 2 sessions after an 80% down day is still a bullish signal. It is just not as strong as it is preferred for it to be. This still offers some support to the main Elliott wave count.
The decline in price down to the 12th of May may have been sufficient to resolve the double bearish divergence between price and RSI. If ADX again increases, then it would again indicate an upwards trend, and there would be plenty of room for an upwards trend to continue with RSI well into neutral territory now.
In Monday’s session up volume dominated at 67% and breadth is positive. In conjunction with a bullish long lower wick, this offers a little support to the main Elliott wave count.
BREADTH – AD LINE
WEEKLY CHART
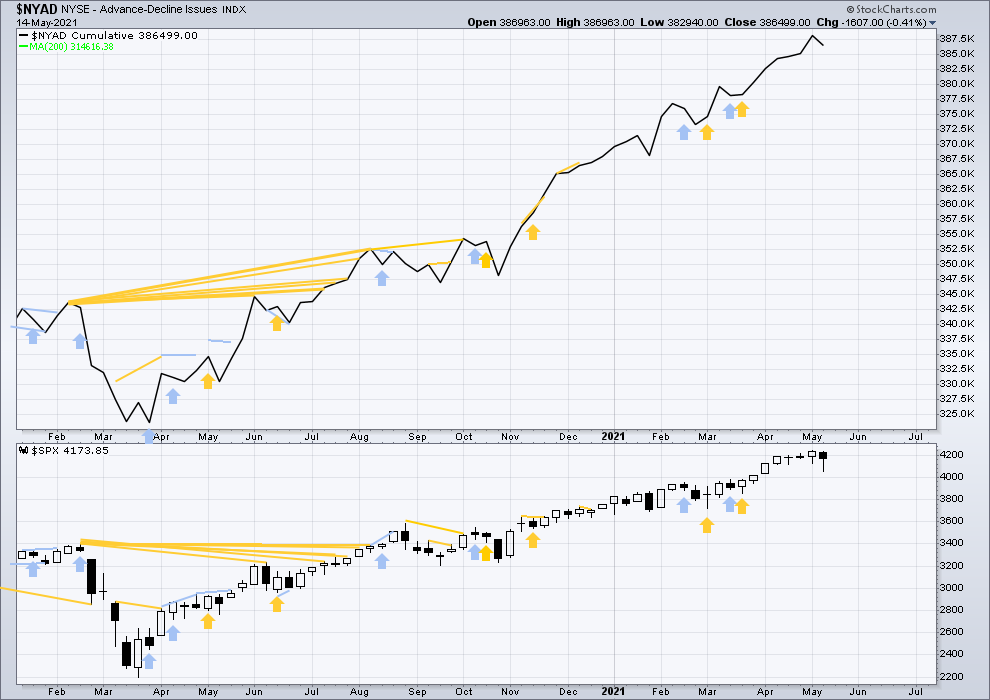
Click chart to enlarge. Chart courtesy of StockCharts.com. So that colour blind members are included, bearish signals will be noted with blue and bullish signals with yellow.
Breadth should be read as a leading indicator.
Lowry’s Operating Companies Only AD line has made a new all time high on the 7th of May. This supports the Elliott wave counts.
Large caps all time high: 4,238.04 on May 7, 2021.
Mid caps all time high: 2,778.84 on April 29, 2021.
Small caps all time high: 1,399.31 on March 12, 2021.
The last new high is found in large caps only. Small caps have been lagging since the 15th of March. Mid caps have been lagging since the 29th of April. This lag from small and mid caps is not precise in terms of timing when a pullback may begin, but it is an early warning sign of some developing weakness. It would be expected that as third waves come to an end some weakness should begin to develop; this situation may fit for either Elliott wave counts.
Both price and the AD line have moved higher last week. There is no new divergence. Upwards movement has support from rising market breadth. This is bullish.
DAILY CHART
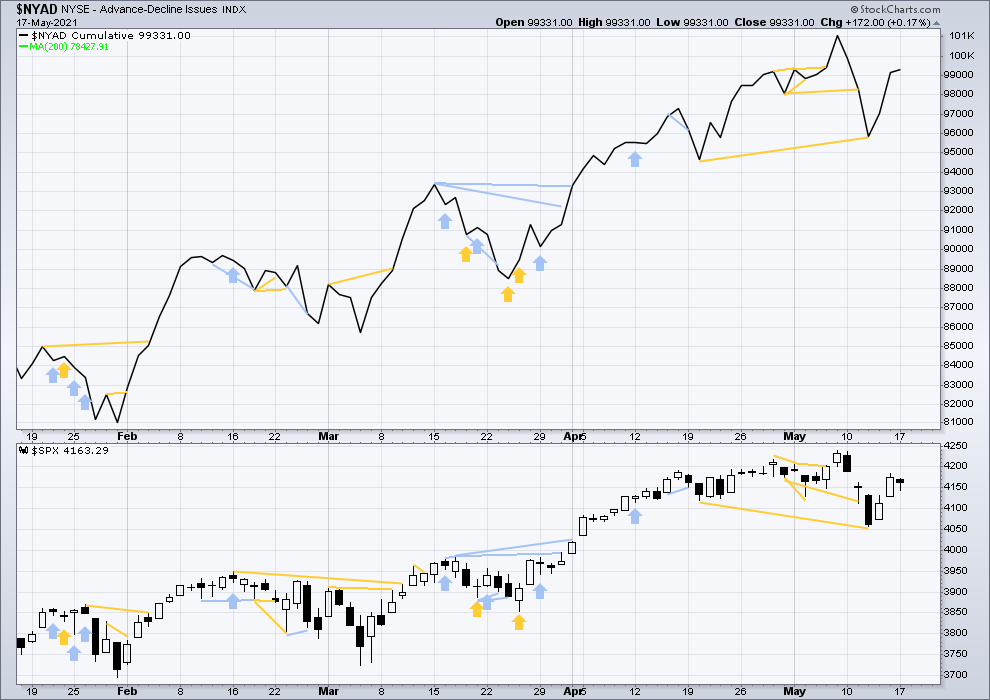
Click chart to enlarge. Chart courtesy of StockCharts.com. So that colour blind members are included, bearish signals will be noted with blue and bullish signals with yellow.
Today price has completed an inside day that closed red. The AD line has moved slightly higher. Upwards movement within this last session has support from rising market breadth; this is bullish and supports the Elliott wave counts. It was small caps today which were strongest, which is also bullish.
There is now a cluster of bullish divergence in recent days that supports the main Elliott wave count.
VOLATILITY – INVERTED VIX CHART
WEEKLY CHART
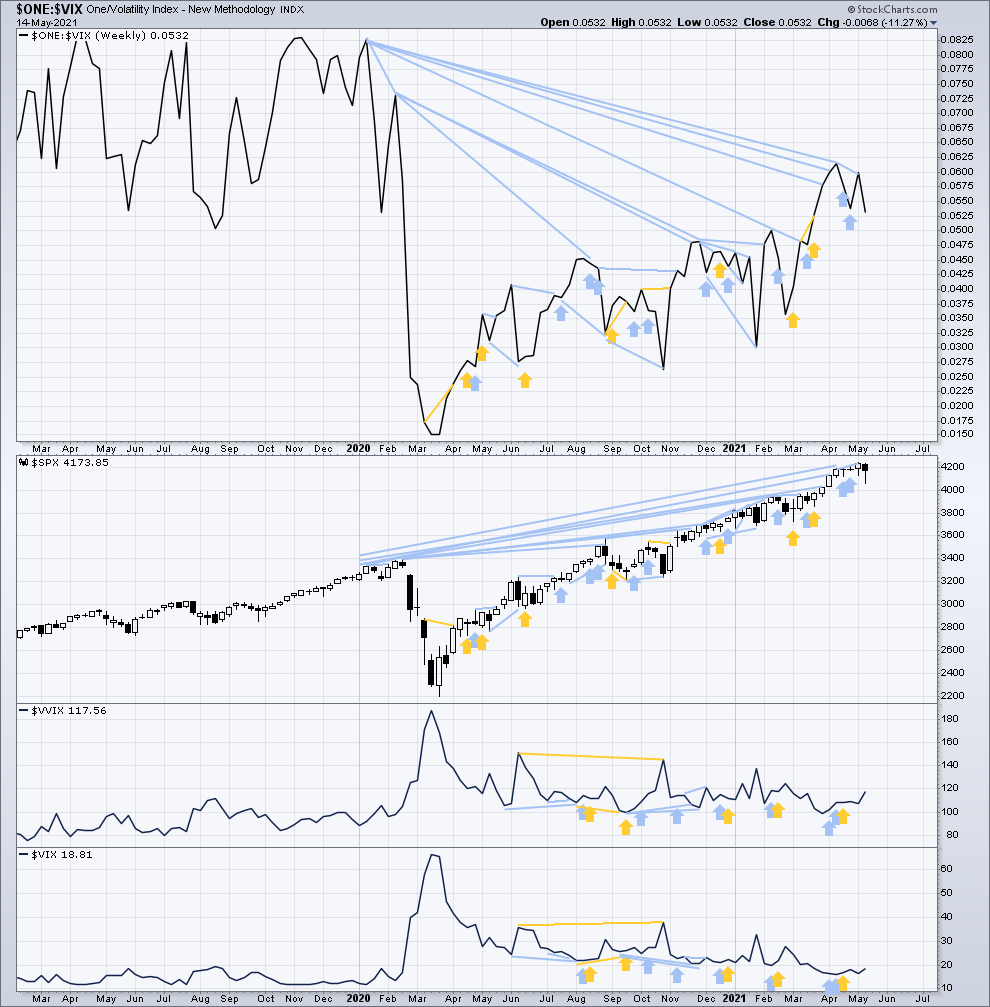
Click chart to enlarge. Chart courtesy of StockCharts.com. So that colour blind members are included, bearish signals will be noted with blue and bullish signals with yellow.
Inverted VIX remains well below all time highs. The all time high for inverted VIX was in the week beginning October 30, 2017. There is over 3 years of bearish divergence between price and inverted VIX. This bearish divergence may develop further before the bull market ends. It may be a very early indicator of an upcoming bear market, but it is not proving to be useful in timing.
Last week both price and inverted VIX have moved lower. There is no new short-term divergence.
Comparing VIX and VVIX at the weekly chart level:
Last week both VIX and VVIX have moved higher. There is no new divergence.
DAILY CHART
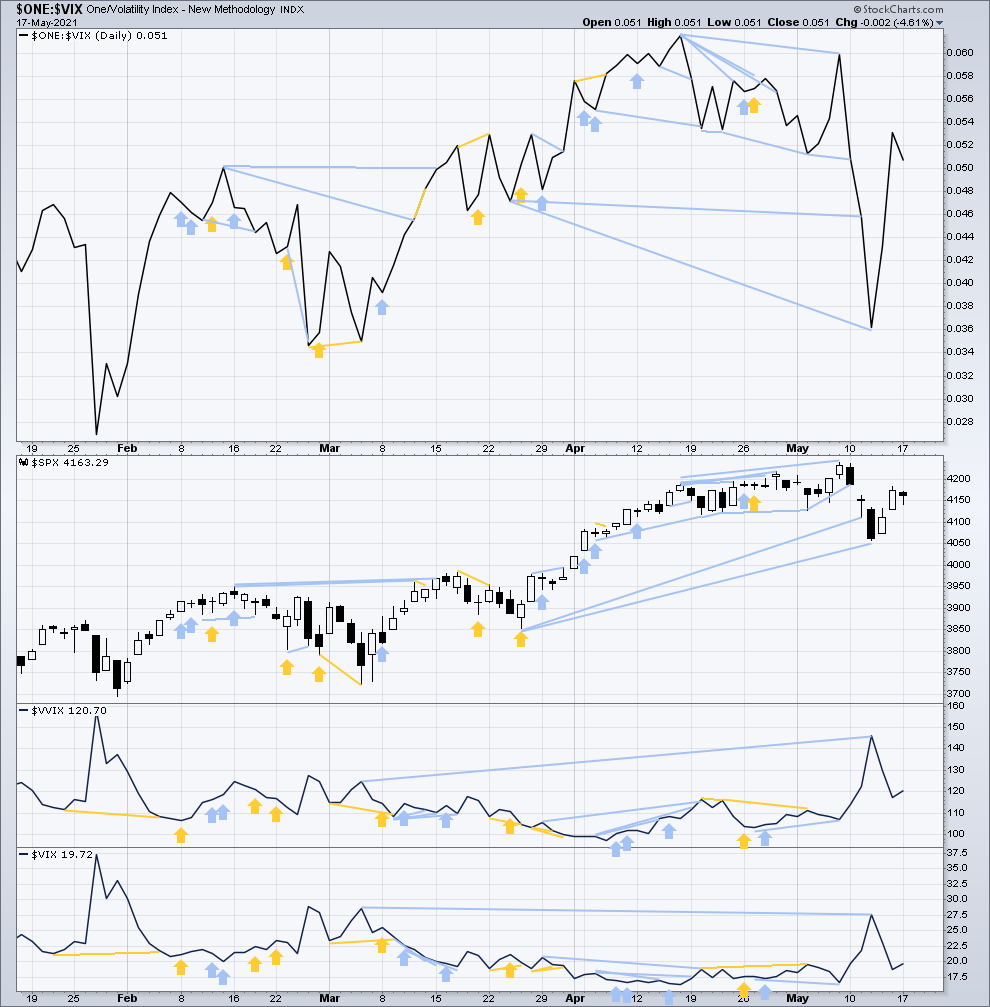
Click chart to enlarge. Chart courtesy of StockCharts.com. So that colour blind members are included, bearish signals will be noted with blue and bullish signals with yellow.
Today price has completed an inside day that has closed red. Inverted VIX has declined, which is bearish for the short term.
Comparing VIX and VVIX at the daily chart level:
Both VIX and VVIX have moved higher. There is no new short-term divergence. Mid-term bearish divergence noted on the chart remains and supports the alternate Elliott wave count.
DOW THEORY
Dow Theory confirms a new bull market with new highs made on a closing basis:
DJIA: 29,568.57 – closed above on 16th November 2020.
DJT: 11,623.58 – closed above on 7th October 2020.
Most recently, on 10th May 2021 both DJIA and DJT have made new all time highs. An ongoing bull market is again confirmed by Dow Theory.
Adding in the S&P and Nasdaq for an extended Dow Theory, confirmation of a bull market would require new highs made on a closing basis:
S&P500: 3,393.52 – closed above on 21st August 2020.
Nasdaq: 9,838.37 – closed above on June 8, 2020.
The following major swing lows would need to be seen on a closing basis for Dow Theory to confirm a change from bull to a bear market:
DJIA: 18,213.65
DJT: 6,481.20
Adding in the S&P and Nasdaq for an extended Dow Theory, confirmation of a new bear market would require new lows on a closing basis:
S&P500: 2,191.86
Nasdaq: 6,631.42
Published @ 07:54 p.m. ET.
—
Careful risk management protects your trading account(s).
Follow my two Golden Rules:
1. Always trade with stops.
2. Risk only 1-5% of equity on any one trade.
—
New updates to this analysis are in bold.