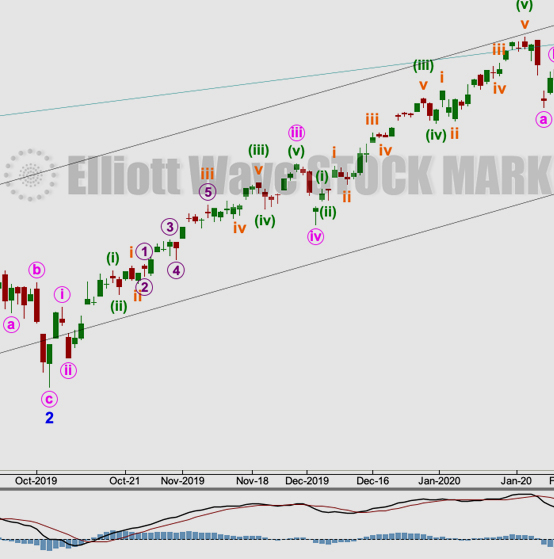
by Lara | Mar 29, 2021 | S&P 500, S&P 500 + DJIA
S&P 500: Elliott Wave and Technical Analysis | Charts – March 29, 2021 An upwards day exhibits some weakness. The main Elliott wave count expects a small pullback. An alternate Elliott wave count looks at the possibility it may be deeper. Summary: The main wave...
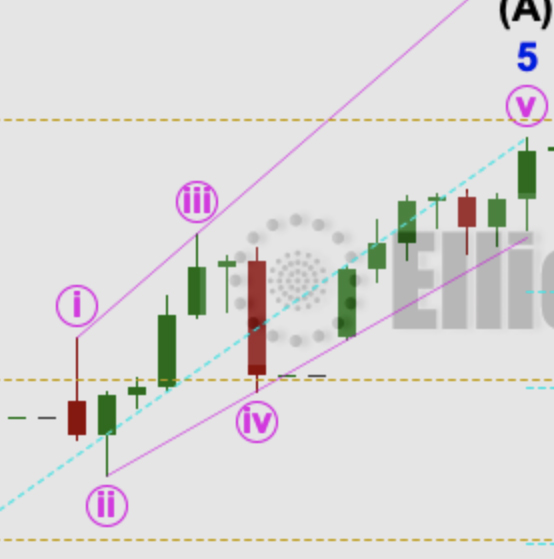
by Lara | Mar 26, 2021 | S&P 500, S&P 500 + DJIA
S&P 500: Elliott Wave and Technical Analysis | Charts – March 26, 2021 The week closed strongly in the afternoon of Friday’s session, but breadth sounds some caution. The Elliott wave count at the daily chart level remains mostly the same. Summary: The main...
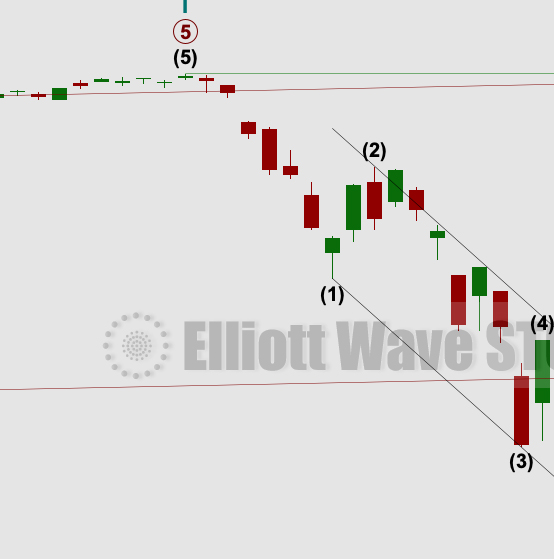
by Lara | Mar 25, 2021 | S&P 500, S&P 500 + DJIA
S&P 500: Elliott Wave and Technical Analysis | Charts – March 25, 2021 Another downwards day was expected for the main hourly Elliott wave count. The third hourly Elliott wave count was invalidated today. Two hourly Elliott wave counts are provided in...
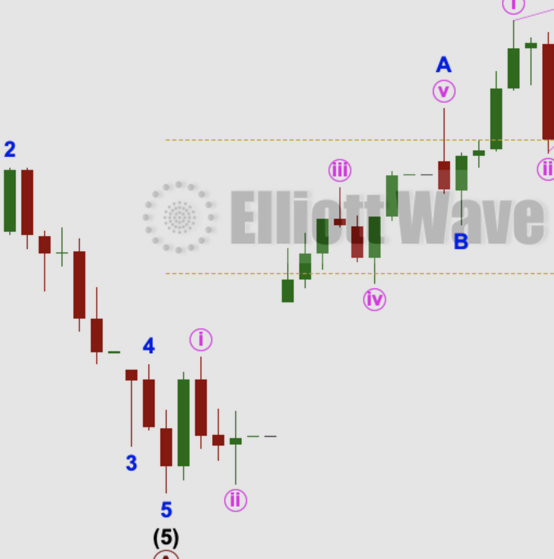
by Lara | Mar 23, 2021 | S&P 500, S&P 500 + DJIA
S&P 500: Elliott Wave and Technical Analysis | Charts – March 23, 2021 A downwards day fits expectations for the main hourly Elliott wave count. Summary: The main wave count (daily and weekly) expects the low of the 30th of October to not be breached for many...

by Lara | Mar 17, 2021 | S&P 500, S&P 500 + DJIA
S&P 500: Elliott Wave and Technical Analysis | Charts – March 17, 2021 A new all time high on a session that has closed green and has a little support from volume is bullish and supports the Elliott wave count. Summary: Both main and alternate wave counts (daily...

by Lara | Mar 11, 2021 | S&P 500, S&P 500 + DJIA
S&P 500: Elliott Wave and Technical Analysis | Charts – March 11, 2021 New all time highs were overall expected for the S&P. This rise is being led by small caps, which supports the Elliott wave count. Summary: The pullback may now be complete; the alternate...

by Lara | Mar 10, 2021 | S&P 500, S&P 500 + DJIA
S&P 500: Elliott Wave and Technical Analysis | Charts – March 10, 2021 Price again has moved higher, which was overall expected. Summary: The pullback may now be complete; next support may be the 0.382 Fibonacci ratio at 3,667 if it continues lower. Another new...
by Lara | Mar 8, 2021 | S&P 500, S&P 500 + DJIA
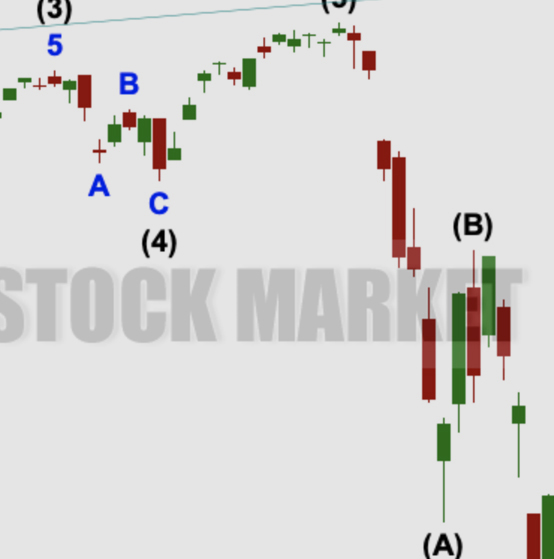
S&P 500: Elliott Wave and Technical Analysis | Charts – March 8, 2021 The main short-term hourly Elliott wave count expected upwards movement to begin the week, which is how Monday has completed with a higher high and a higher low, although the session closed...

by Lara | Mar 5, 2021 | S&P 500, S&P 500 + DJIA
S&P 500: Elliott Wave and Technical Analysis | Charts – March 5, 2021 An upwards day was expected from the main Elliott wave count in last analysis. Summary: The pullback may have continued lower as a triple zigzag. The structure may now be complete; next support...


