
S&P 500: Elliott Wave and Technical Analysis | Charts – March 25, 2021
Another downwards day was expected for the main hourly Elliott wave count.
The third hourly Elliott wave count was invalidated today. Two hourly Elliott wave counts are provided in today’s analysis.
Summary: The main wave count (daily and weekly) expects the low of the 30th of October to not be breached for many months. However, the alternate wave count now diverges and allows for a deeper pullback to unfold here. There is more support from classic analysis for the main than the alternate wave count.
For the short term, it is possible that the pullback may be over at today’s low. A bullish candlestick pattern and bullish short-term divergence from all of the AD line, inverted VIX and VVIX support this view. A breach of the channel on the hourly charts and a new high above 3,942.08 would add confidence. The risk is the pullback may continue lower, to end closer to 3,823, while price remains within the channel.
The next target for the upwards trend is at 4,464 and thereafter at 4,606. About this target another multi-week pullback or consolidation may develop.
An alternate wave count at the weekly chart level has a slightly lower probability with the main weekly chart.
The biggest picture, Grand Super Cycle analysis, is here.
Monthly charts are last updated here with video here.
MAIN WAVE COUNT
WEEKLY CHART
Click chart to enlarge.
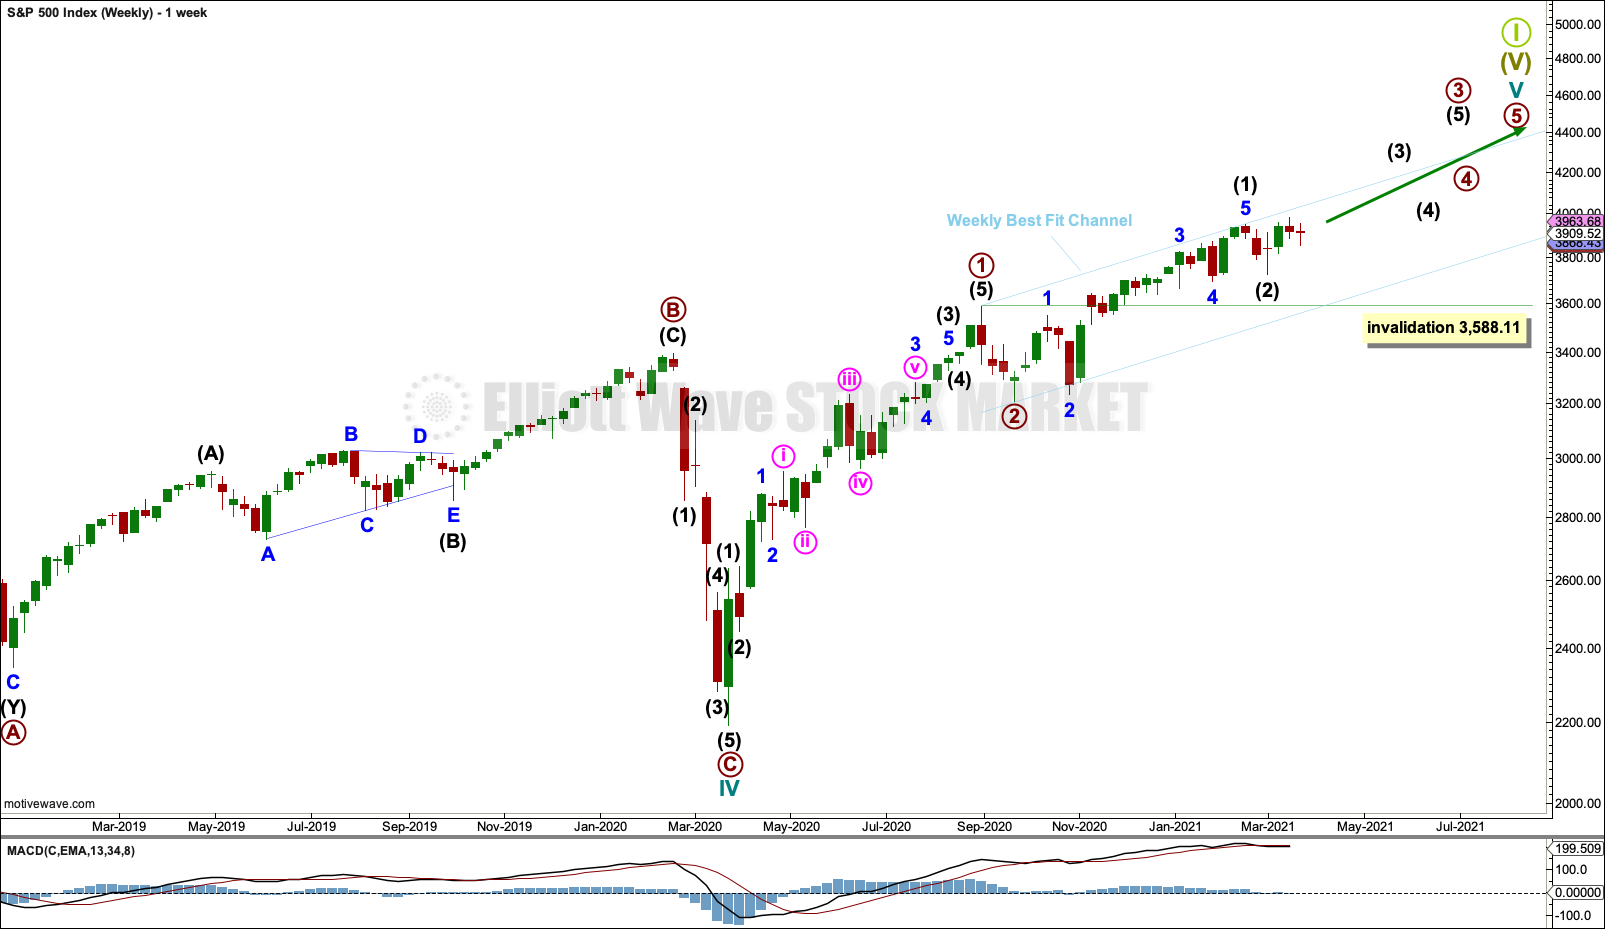
Cycle wave V may last from one to several years. So far it is in its twelfth month.
This wave count may allow time for the AD line to diverge from price as price makes final highs before the end of the bull market. The AD line most commonly diverges a minimum of 4 months prior to the end of a bull market. A longer divergence is positively correlated with a deeper bear market. A shorter divergence is positively correlated with a more shallow bear market. With zero divergence at this stage, if a surprise bear market does develop here, then it would likely be shallow.
Cycle wave V would most likely subdivide as an impulse. But if overlapping develops, then an ending diagonal should be considered. This chart considers the more common impulse.
Primary waves 1 and 2 may be complete.
Primary wave 3 may only subdivide as an impulse.
Primary wave 3 has now moved well above the end of primary wave 1. Primary wave 4 may not move into primary wave 1 price territory below 3,588.11.
There is already a Fibonacci ratio between cycle waves I and III within Super Cycle wave (V). The S&P500 often exhibits a Fibonacci ratio between two of its actionary waves but rarely between all three; it is less likely that cycle wave V would exhibit a Fibonacci ratio. The target for Super Cycle wave (V) to end would best be calculated at primary degree, but that cannot be done until all of primary waves 1, 2, 3 and 4 are complete.
The blue weekly best fit channel is slightly adjusted, so that the lower edge may better show where price may find support. Copy this over to the daily chart.
DAILY CHART
Click chart to enlarge.
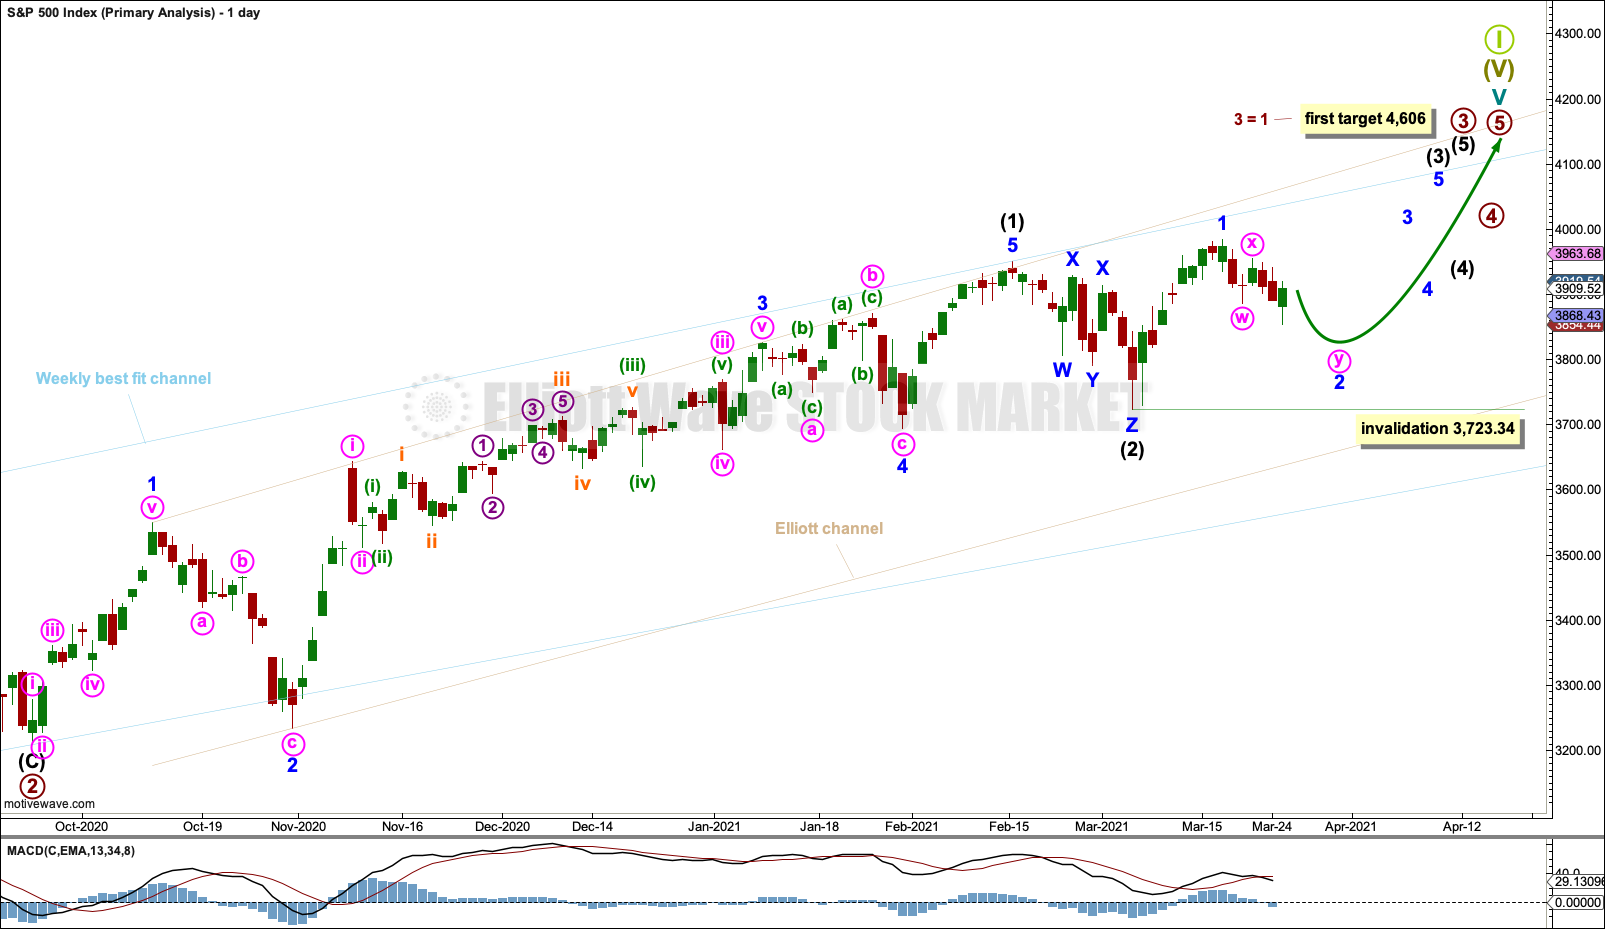
The daily chart focusses on the unfolding impulse of primary wave 3.
Intermediate wave (1) within primary wave 3 may have been complete and the last pullback may be intermediate wave (2).
Intermediate wave (2) may have continued lower as a triple zigzag.
Intermediate wave (3) within primary wave 3 may now have begun.
Within intermediate wave (3): Minor wave 1 may now be complete, and minor wave 2 may now move overall lower for a few sessions (it may not move beyond the start of minor wave 1 below 3,723.34). Minor wave 2 may last from a few sessions to as long as 14 sessions.
The beige Elliott channel is drawn about intermediate wave (1) using Elliott’s first technique: Draw the first trend line from the ends of minor waves 1 to 3, then place a parallel copy on the end of minor wave 2. The upper edge has initiated multiple pullbacks, so it may again be an important line of resistance in the future.
When minor wave 2 may be complete, then the next upwards wave for this wave count is expected to be a third wave at minor, intermediate and primary degree. An increase in upwards momentum may be expected.
HOURLY CHART
Click chart to enlarge.
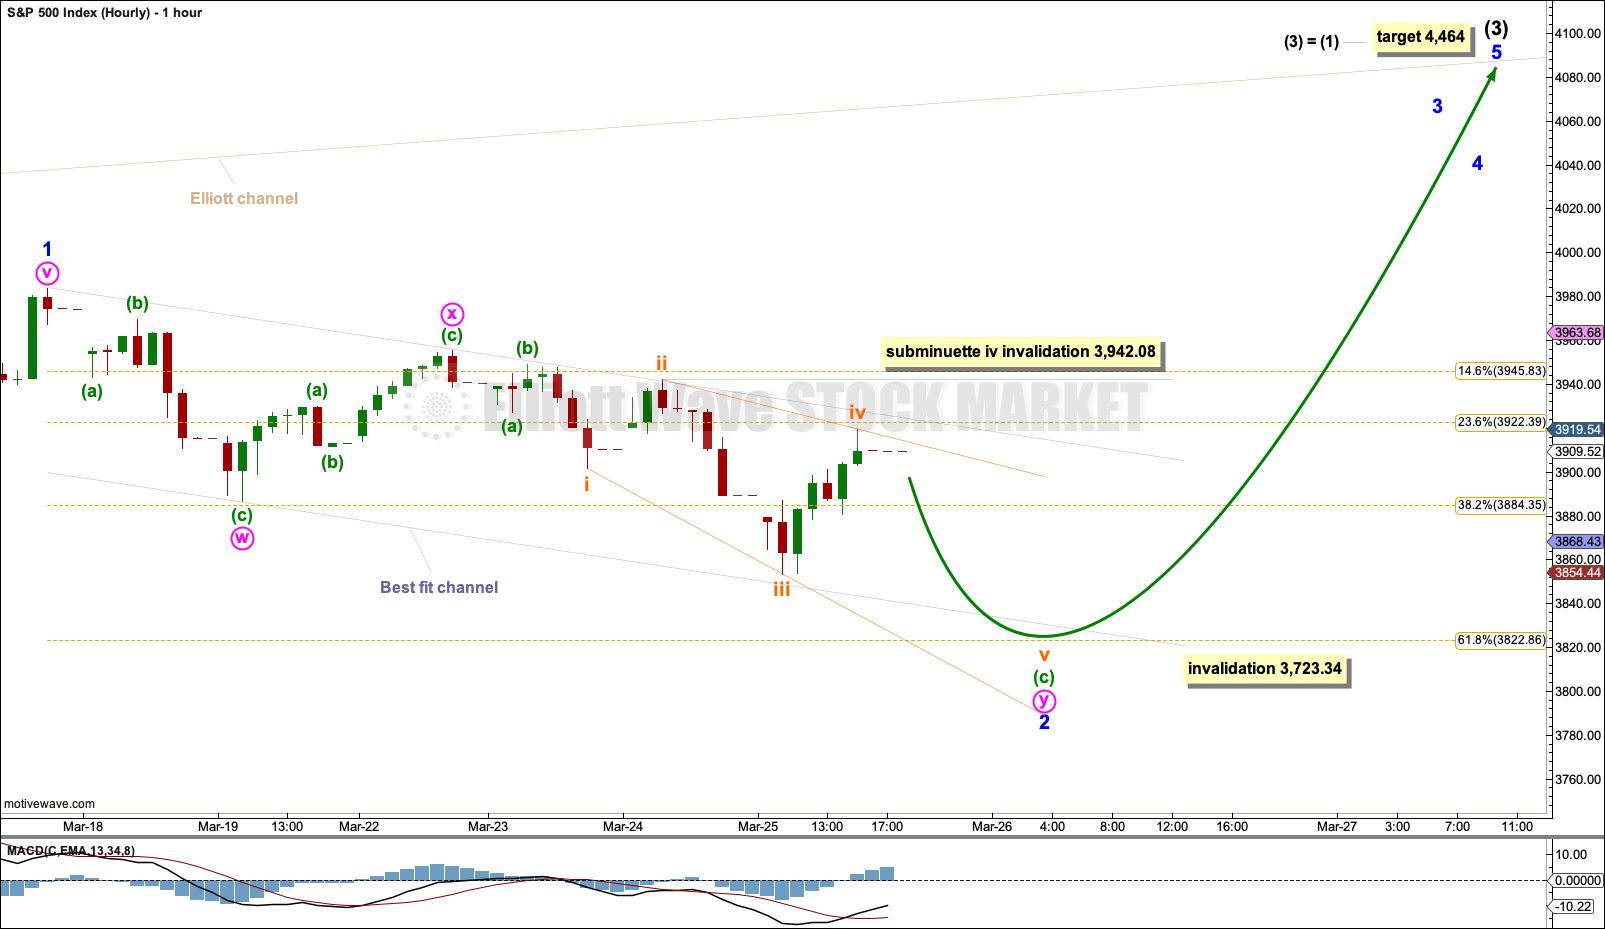
Minor wave 1 may be complete, falling a little short of the upper edge of the beige Elliott channel copied over from the daily chart.
Minor wave 2 may be unfolding as a double zigzag. The first zigzag downwards may be complete, labelled minute wave w. The first and second zigzags in a double may be joined by a complete three in the opposite direction, labelled minute wave x.
The purpose of second zigzags in double zigzags is to deepen the correction when the first zigzag does not move price deep enough. Minute wave y may bring minor wave 2 down to end about the 0.618 Fibonacci ratio at 3,822.86.
Within minute wave y: Now minuette waves (a) and (b) may be complete, and minuette wave (c) may be an incomplete ending expanding diagonal. However, for this wave count now minuette wave (a) is very short in comparison to minuette wave (c), which reduces the probability of this wave count today.
Minor wave 2 may not move beyond the start of minor wave 1 below 3,723.34.
ALTERNATE HOURLY CHART
Click chart to enlarge.
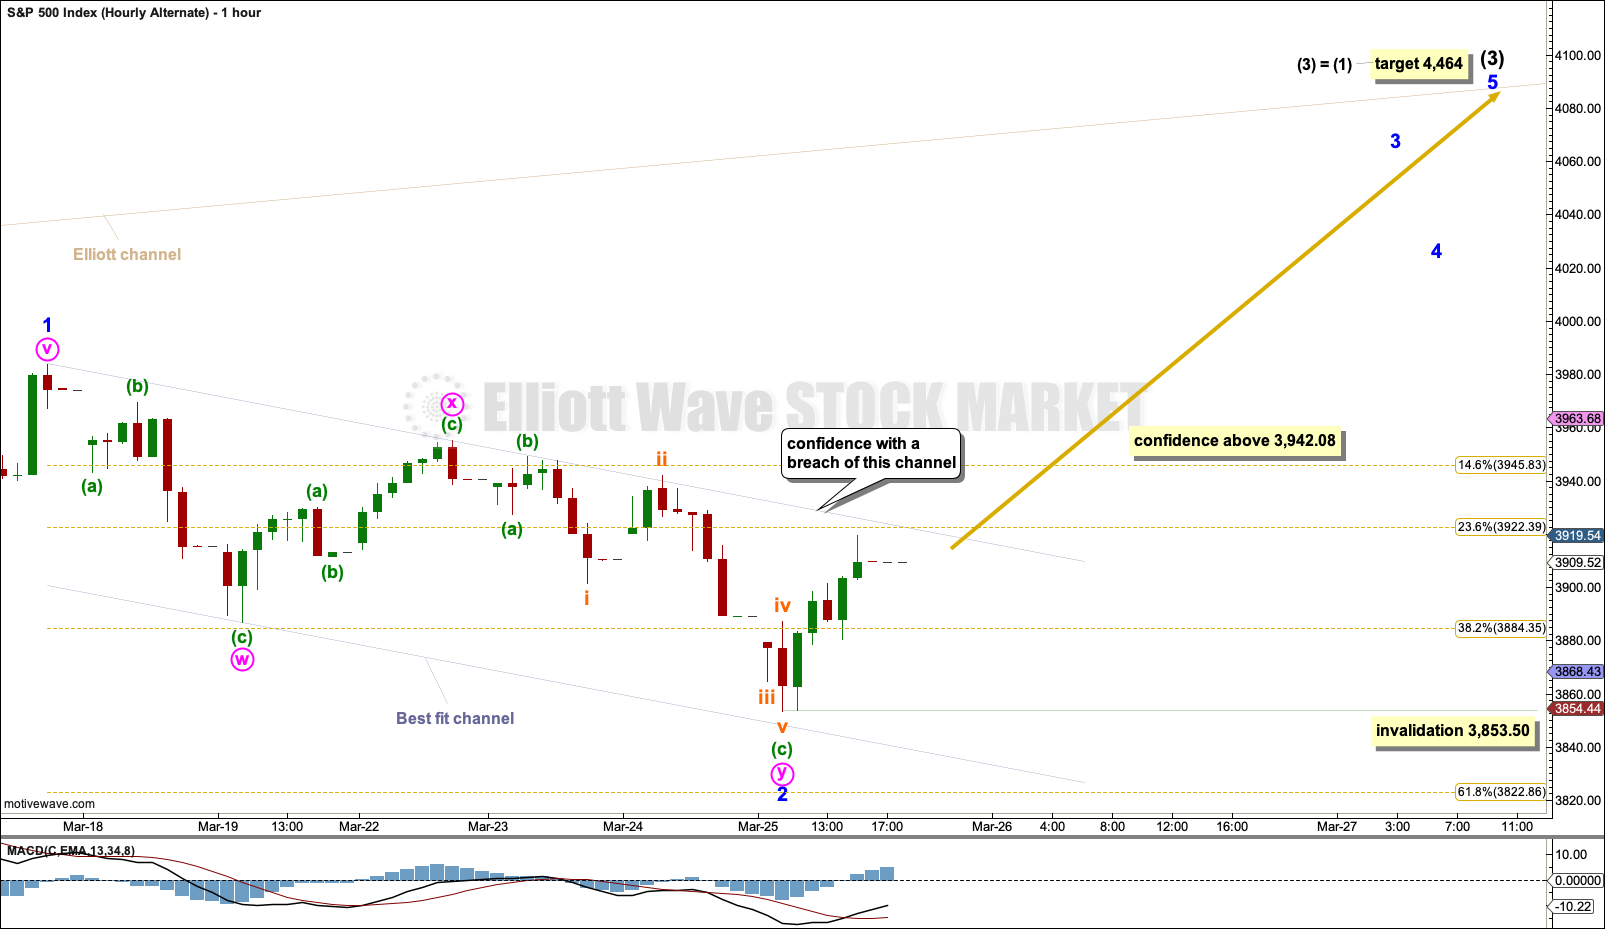
It is possible today that minor wave 2 could be over at today’s low.
Minor wave 2 for both hourly wave counts is seen now as a double zigzag. The second zigzag in the double for this alternate may be complete at today’s low. There is disproportion between subminuette waves ii and iv within minuette wave (c), but for this market this is acceptable as the S&P does not always exhibit good proportion at all time frames.
No second wave correction within minor wave 3 may move beyond its start below 3,853.50.
Confidence in this alternate may be had with a breach of the channel and then a new high above 3,942.08.
ALTERNATE WAVE COUNT
WEEKLY CHART
Click chart to enlarge.
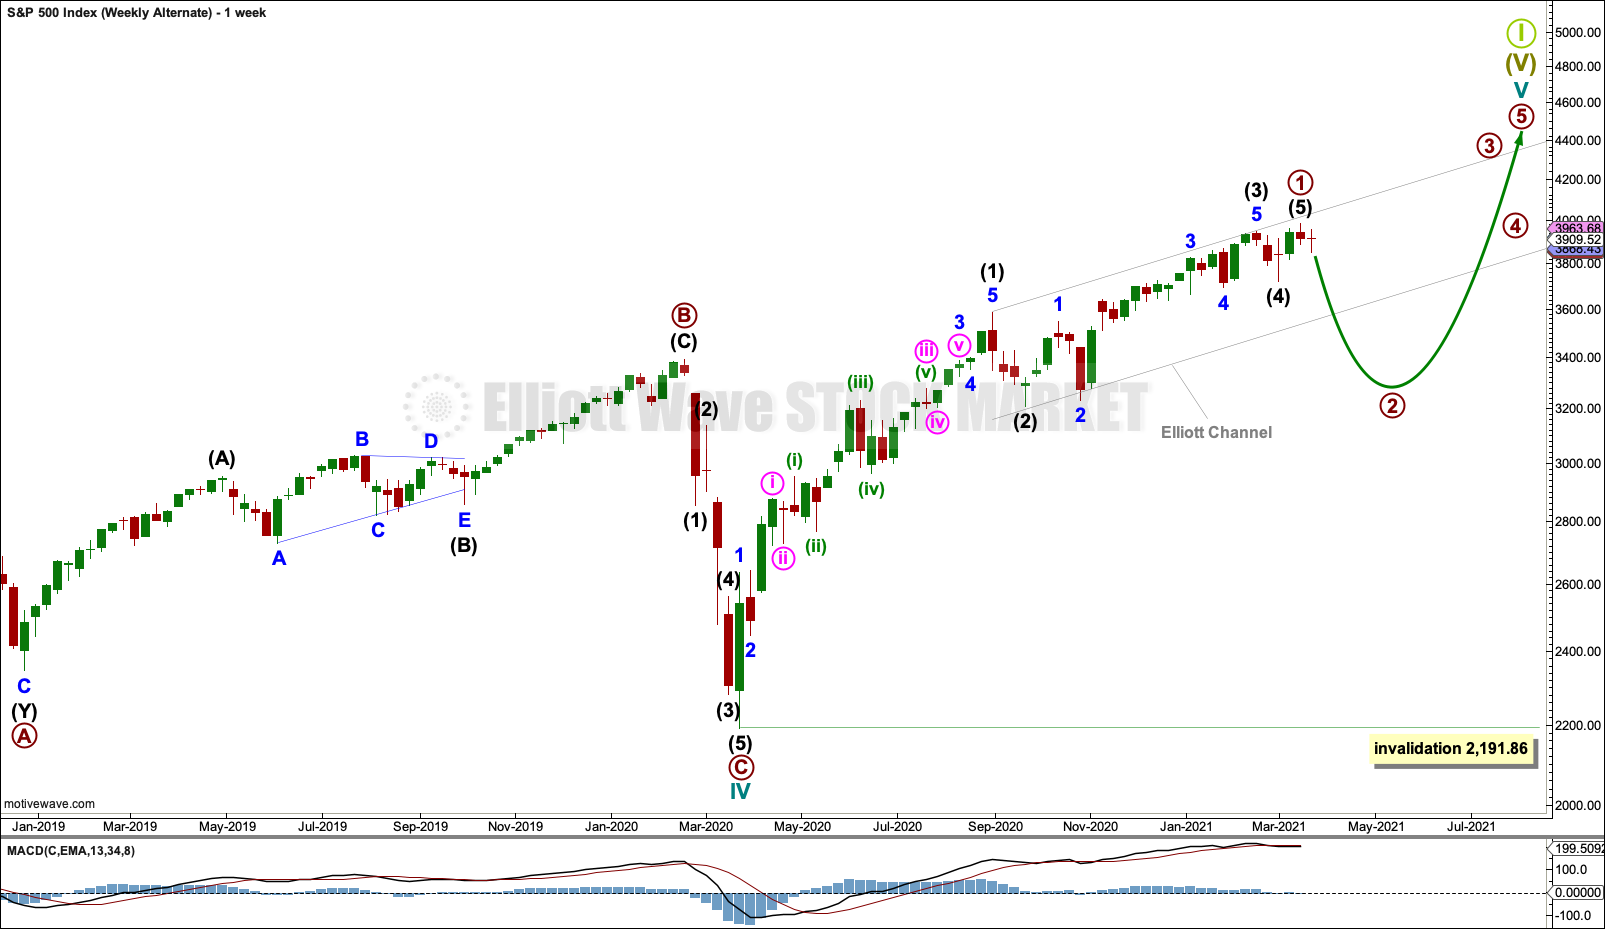
This wave count sees subdivisions in the same way as the main wave count, but the degree of labelling is different. The implications are now important. It is possible that primary wave 1 was over at the last high and a deeper and longer lasting pullback for primary wave 2 may have arrived. Primary wave 2 may be expected to last weeks to months.
While for the short to mid term this alternate wave count is now more bearish than the main wave count, it remains more bullish than the main weekly wave count for the long term. It expects that cycle wave V may last many more years than the main weekly chart.
Within primary wave 1: Intermediate wave (3) is shorter than intermediate wave (1), and intermediate wave (5) may be complete and shorter than intermediate wave (3). The S&P has a strong tendency for its third waves to be long extensions and for this wave count the lack of an extended third wave for intermediate wave (3) reduces the probability.
This wave count has a low probability for this market in Elliott wave terms. It also lacks support from classic technical analysis.
Primary wave 2 may not move beyond the start of primary wave 1 below 2,191.86.
DAILY CHART
Click chart to enlarge.
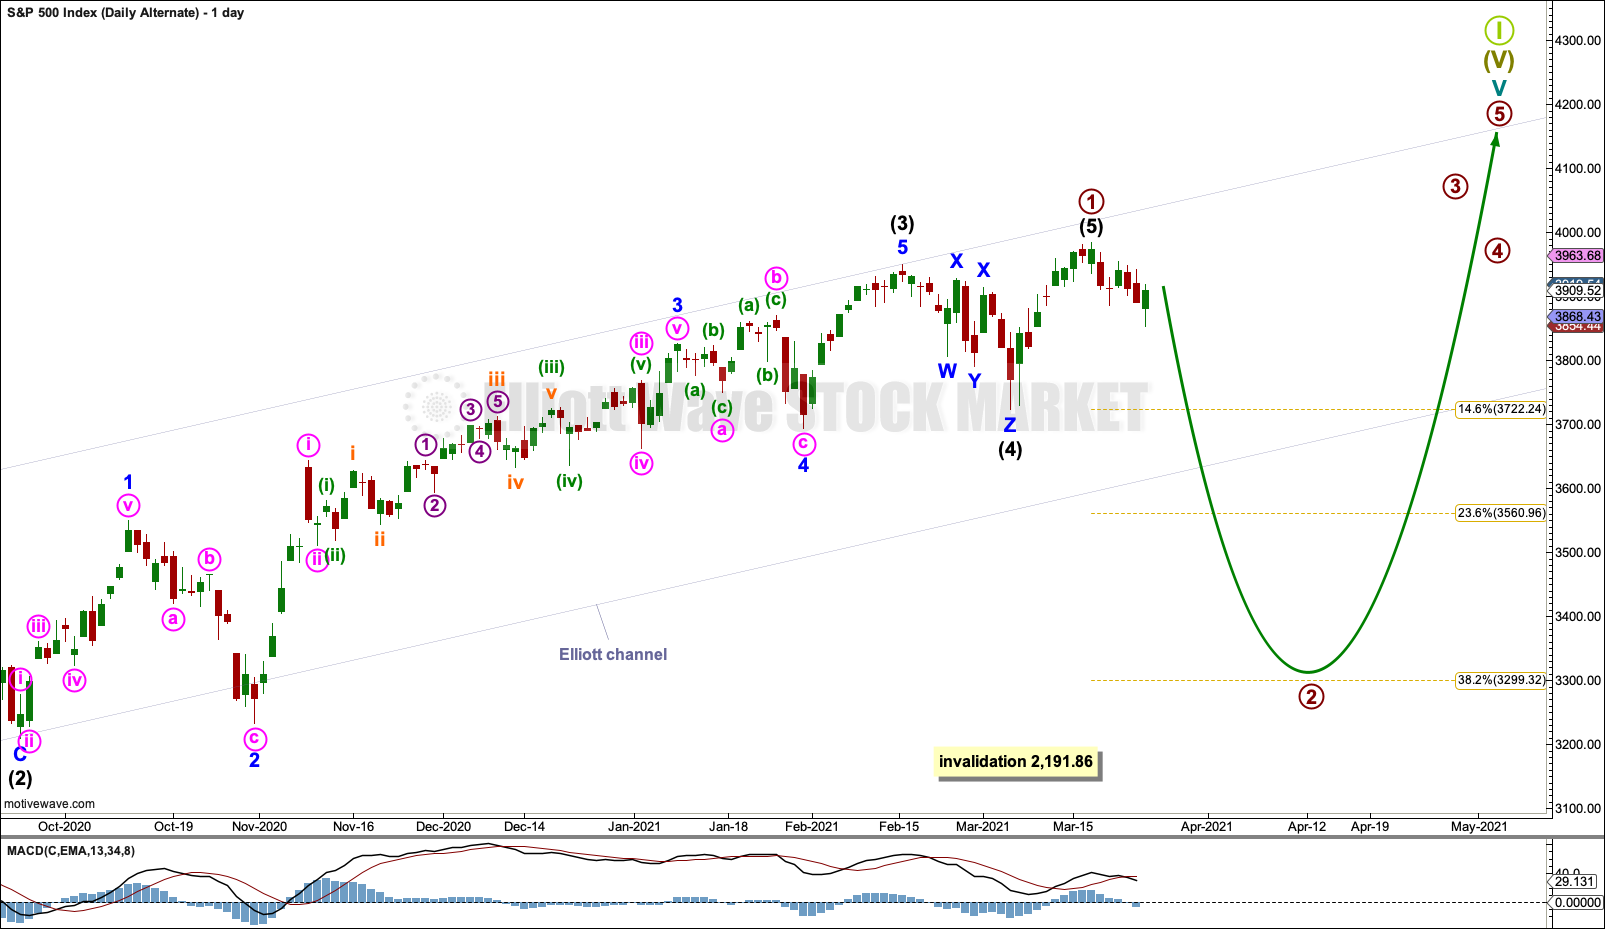
Primary wave 1 may now be complete. Primary wave 2 may have just begun.
This chart is now drawn on an arithmetic scale, so that the Fibonacci re-tracements are accurate. Primary wave 2 may find support about either the 0.382 or 0.618 Fibonacci ratios.
A breach of the Elliott channel drawn about primary wave 1 would provide confidence in this wave count.
Primary wave 2 may not move beyond the start of primary wave 1 below 2,191.86.
TECHNICAL ANALYSIS
WEEKLY CHART
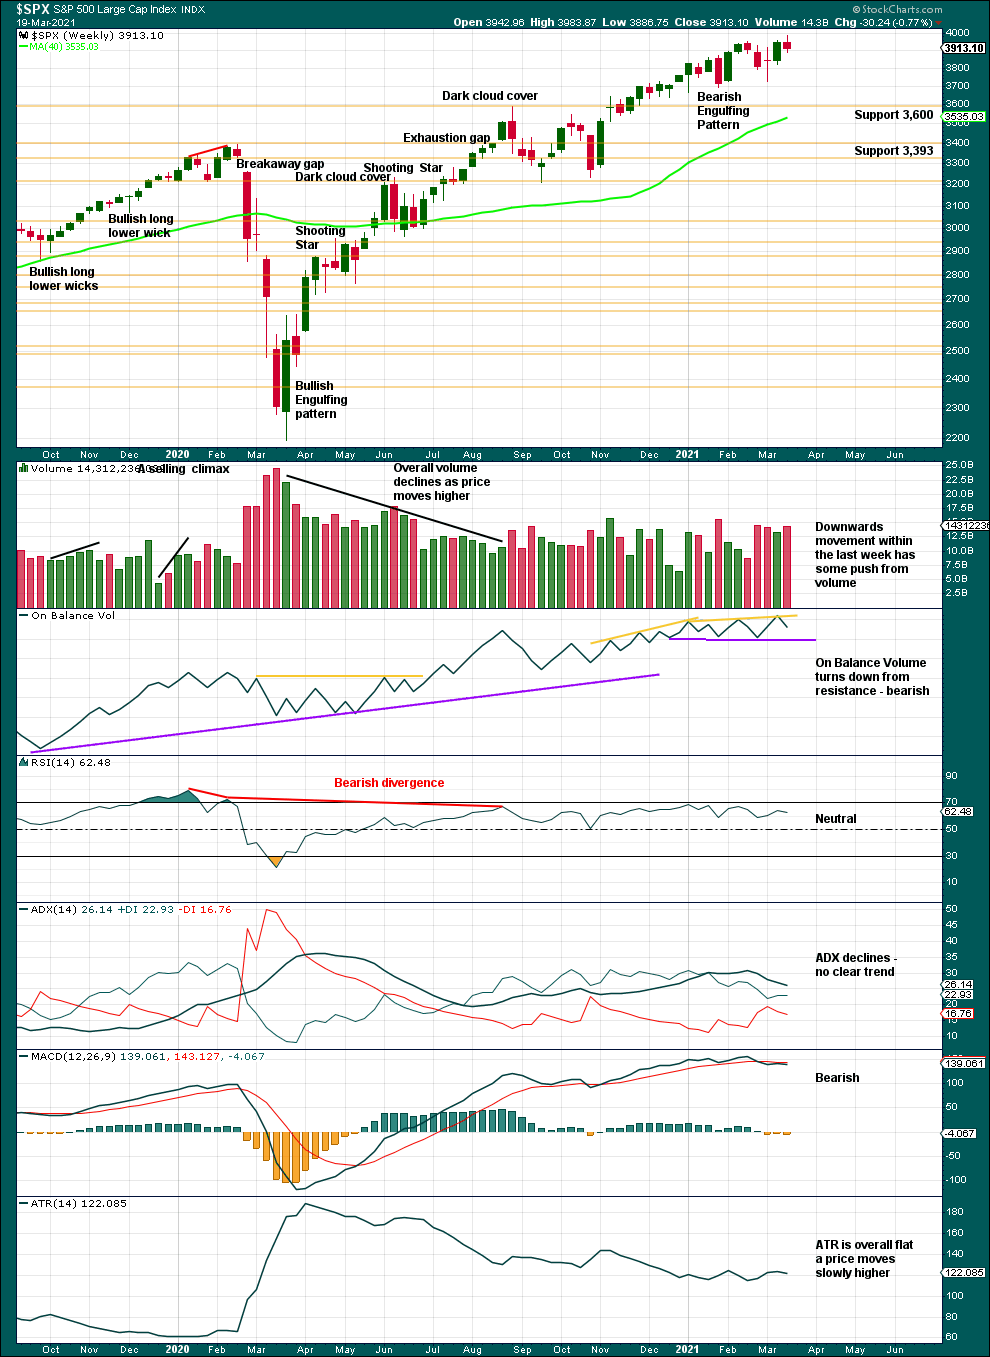
Click chart to enlarge. Chart courtesy of StockCharts.com.
A series of higher highs and higher lows off the low of March 2020 continues. The last short-term swing low is now at 3,723.34. While this remains intact, the dominant view should be of an upwards trend. There is a long way for this trend to run before conditions may become extreme.
DAILY CHART
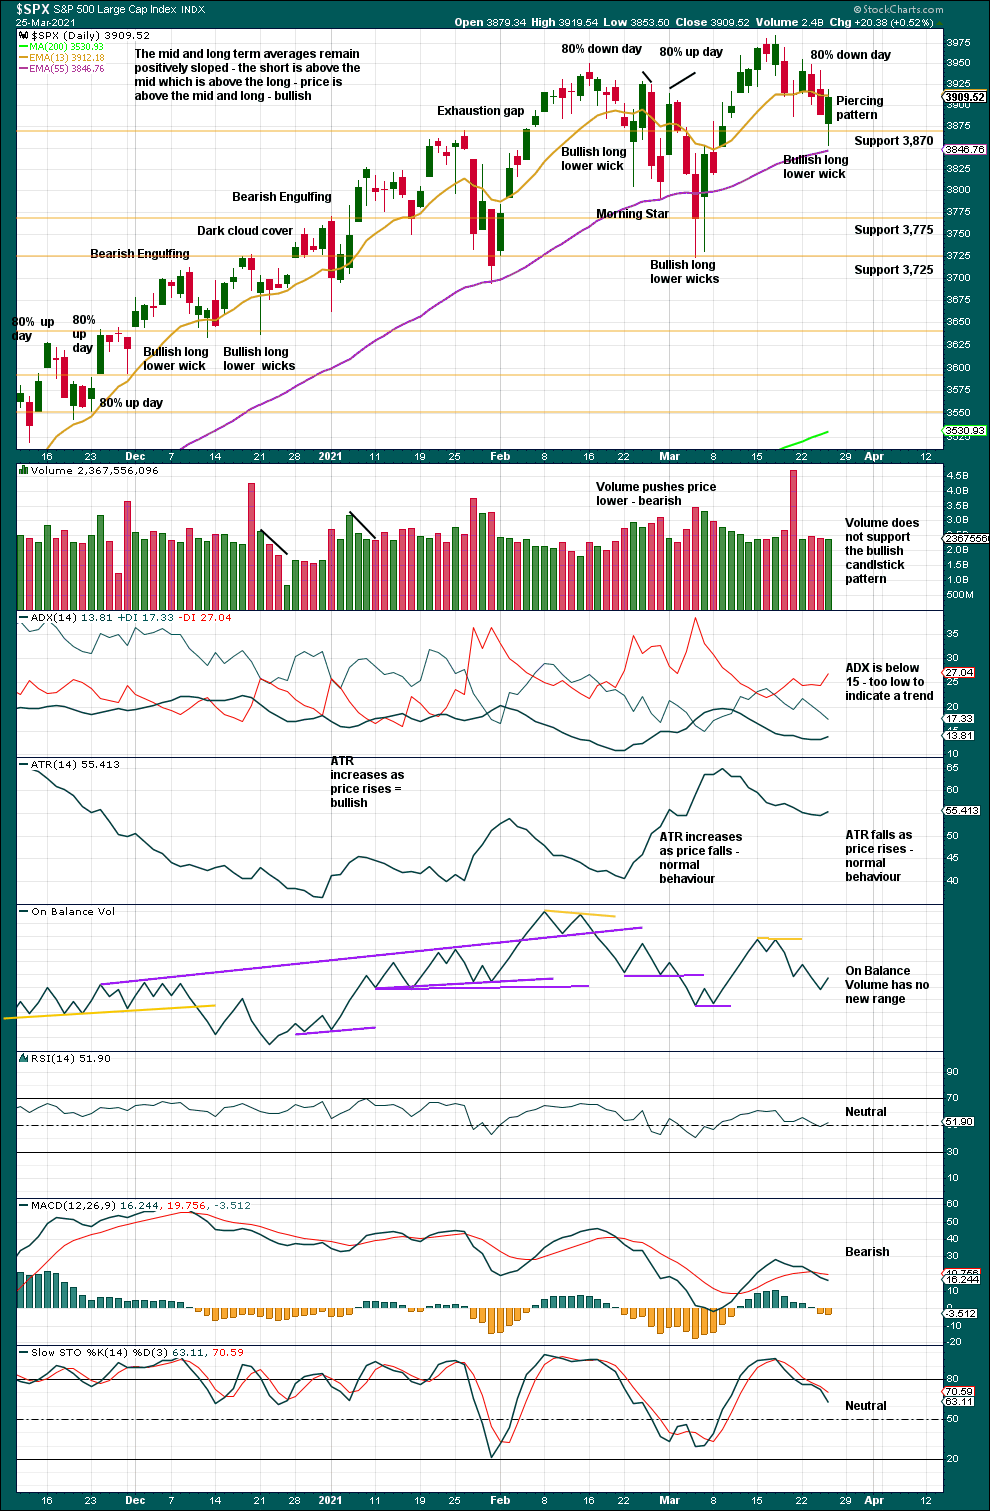
Click chart to enlarge. Chart courtesy of StockCharts.com.
The series of higher highs and higher lows from the low of the 30th of October continues.
The last swing low is the 4th of March at 3,723.34. While this remains intact, the upwards trend may be assumed to continue. Pullbacks are a normal and to be expected part of a bullish trend. Another may have begun after some divergence between price and the AD line, and VIX and VVIX.
The bullish candlestick pattern today supports the alternate hourly Elliott wave count; another pullback may be over. However, it lacks support from volume. Current market conditions mean though that this is not of as much a concern as it would normally be. Price has been rising with light and declining volume at all time frames for many years now.
BREADTH – AD LINE
WEEKLY CHART
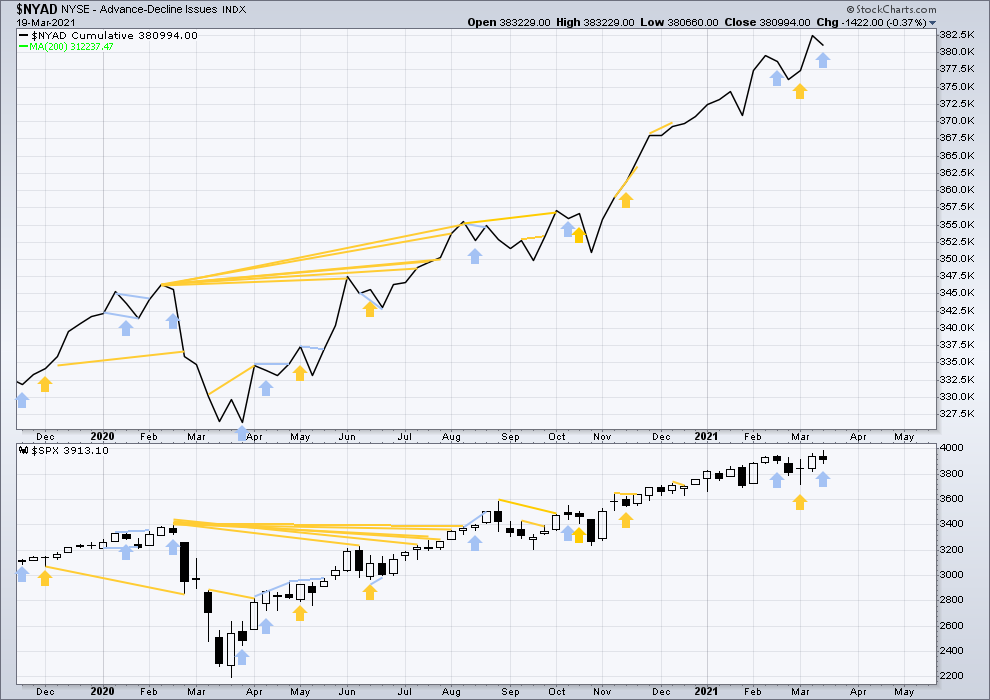
Click chart to enlarge. Chart courtesy of StockCharts.com. So that colour blind members are included, bearish signals will be noted with blue and bullish signals with yellow.
Breadth should be read as a leading indicator.
Lowry’s Operating Companies Only AD line has made a new all time high on the 11th of March. This is a strong bullish signal and supports the main Elliott wave count.
Large caps all time high: 3,983.87 on March 17, 2021.
Mid caps all time high: 2,682.94 on March 15, 2021.
Small caps all time high: 1,399.31 on March 12, 2021.
Last week price has moved higher (although the candlestick has closed red), but the AD line has moved lower. This divergence is bearish for the short term.
DAILY CHART
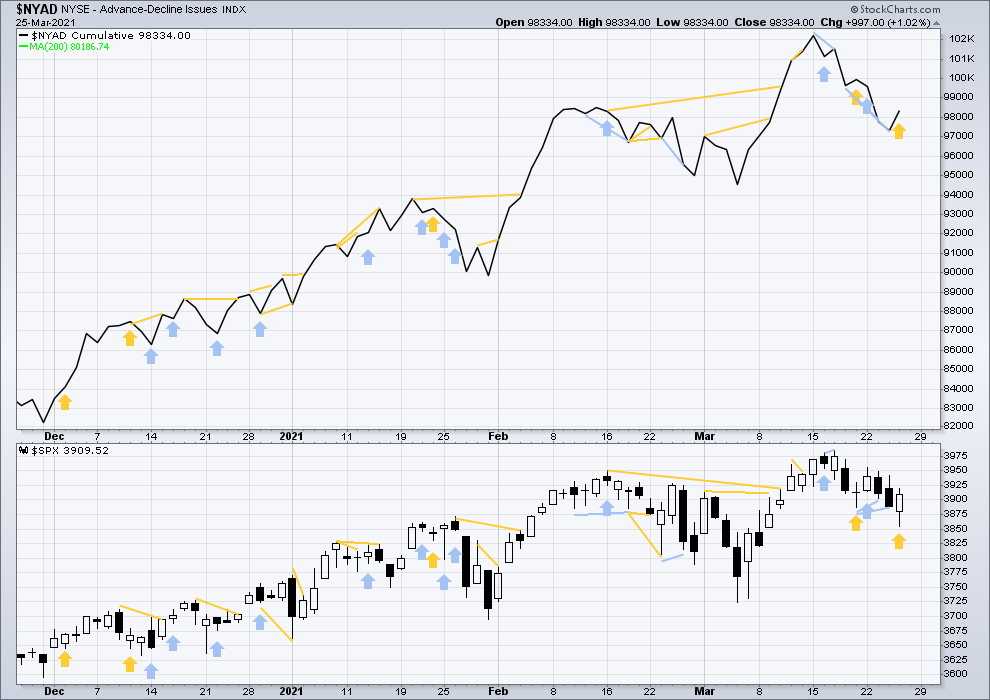
Click chart to enlarge. Chart courtesy of StockCharts.com. So that colour blind members are included, bearish signals will be noted with blue and bullish signals with yellow.
Today price has moved lower, but the AD line has moved higher. This divergence is bullish for the short term and supports the alternate hourly Elliott wave count.
VOLATILITY – INVERTED VIX CHART
WEEKLY CHART
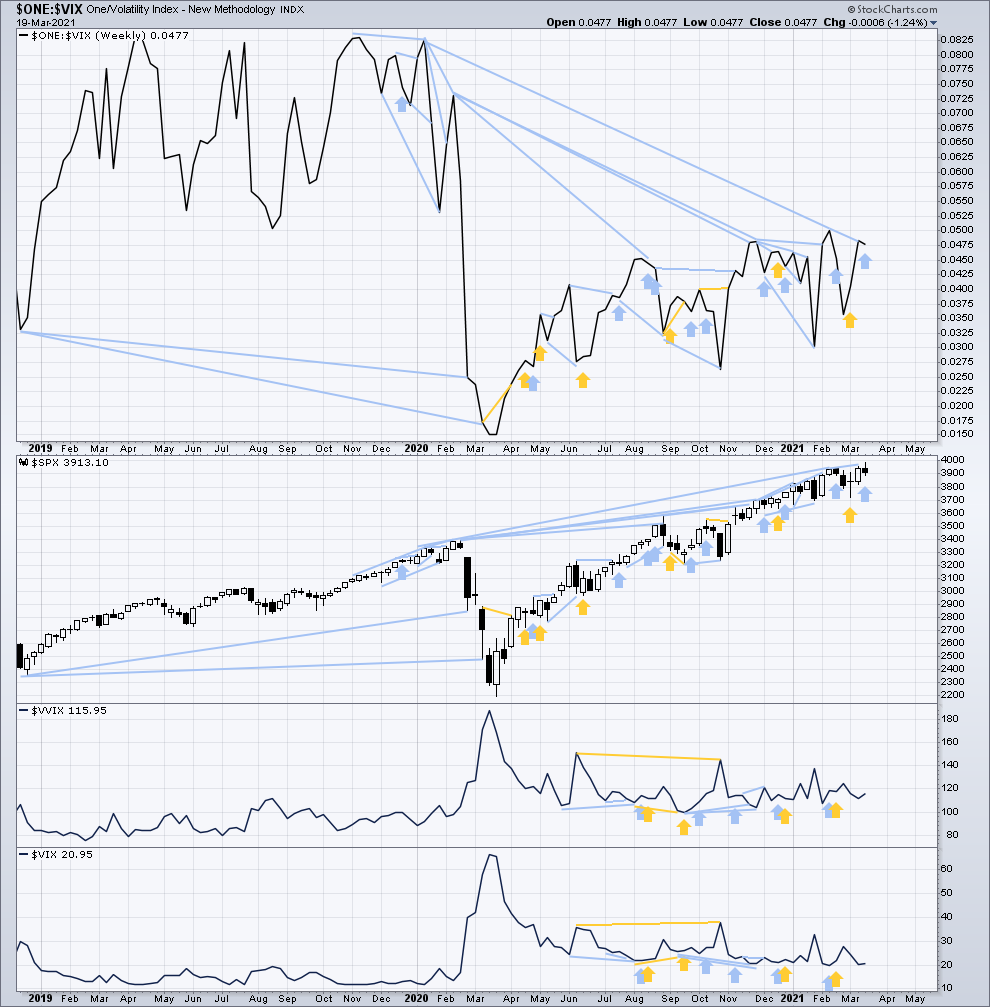
Click chart to enlarge. Chart courtesy of StockCharts.com. So that colour blind members are included, bearish signals will be noted with blue and bullish signals with yellow.
Inverted VIX remains well below all time highs. The all time high for inverted VIX was in the week beginning October 30, 2017. There is over 3 years of bearish divergence between price and inverted VIX. There is all of long, mid and short-term bearish divergence. This bearish divergence may develop further before the bull market ends. It may be a very early indicator of an upcoming bear market, but it is not proving to be useful in timing.
Last week price has moved higher (although the candlestick has closed red), but inverted VIX has moved lower. This divergence is bearish for the short term.
Comparing VIX and VVIX at the weekly chart level:
Both VIX and VVIX have moved higher last week. There is no new short-term divergence.
DAILY CHART
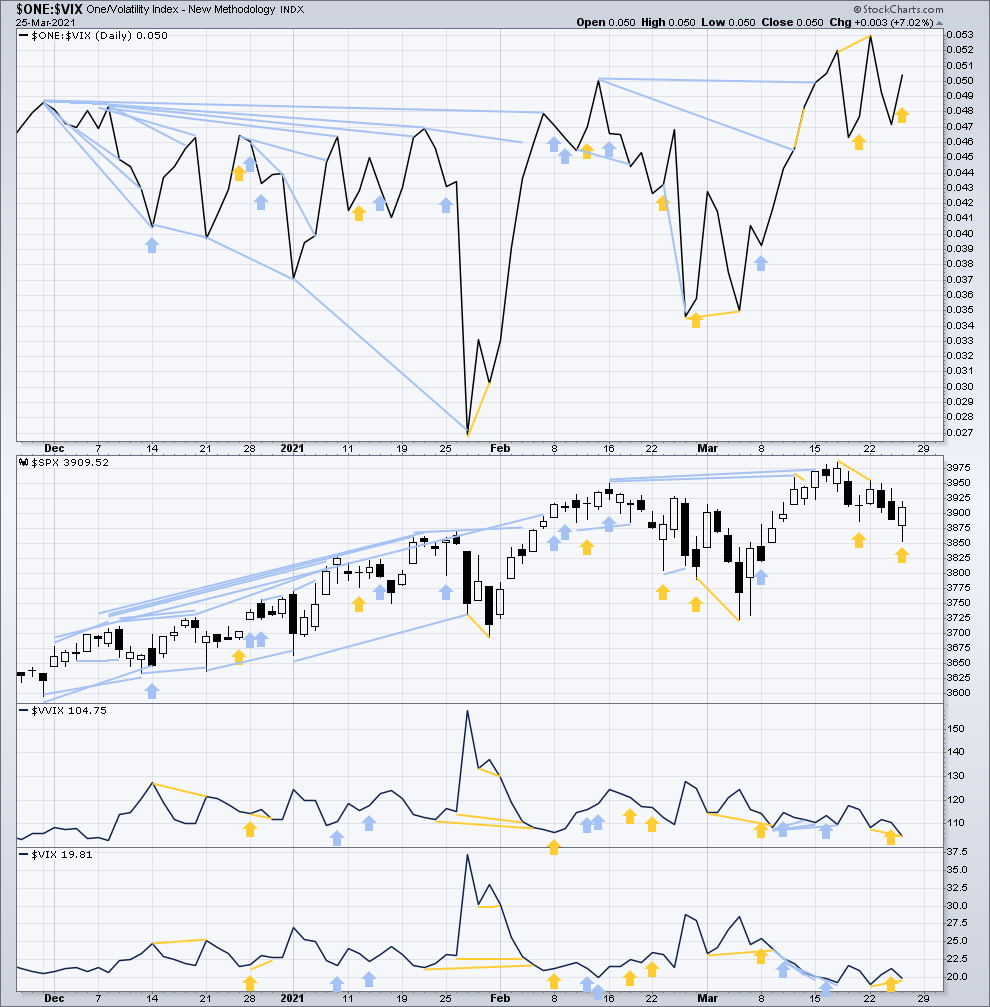
Click chart to enlarge. Chart courtesy of StockCharts.com. So that colour blind members are included, bearish signals will be noted with blue and bullish signals with yellow.
Today price has moved lower, but inverted VIX has moved higher. This divergence is bullish for the short term and supports the alternate hourly Elliott wave count.
Comparing VIX and VVIX at the daily chart level:
Today VVIX has made a new short-term swing low, but VIX has not. This divergence is bullish for the short term and supports the alternate hourly Elliott wave count.
DOW THEORY
Dow Theory confirms a new bull market with new highs made on a closing basis:
DJIA: 29,568.57 – closed above on 16th November 2020.
DJT: 11,623.58 – closed above on 7th October 2020.
Adding in the S&P and Nasdaq for an extended Dow Theory, confirmation of a bull market would require new highs made on a closing basis:
S&P500: 3,393.52 – closed above on 21st August 2020.
Nasdaq: 9,838.37 – closed above on June 8, 2020.
The following major swing lows would need to be seen on a closing basis for Dow Theory to confirm a change from bull to a bear market:
DJIA: 18,213.65
DJT: 6,481.20
Adding in the S&P and Nasdaq for an extended Dow Theory, confirmation of a new bear market would require new lows on a closing basis:
S&P500: 2,191.86
Nasdaq: 6,631.42
Published @ 06:42 p.m. ET.
—
Careful risk management protects your trading account(s).
Follow my two Golden Rules:
1. Always trade with stops.
2. Risk only 1-5% of equity on any one trade.
—
New updates to this analysis are in bold.