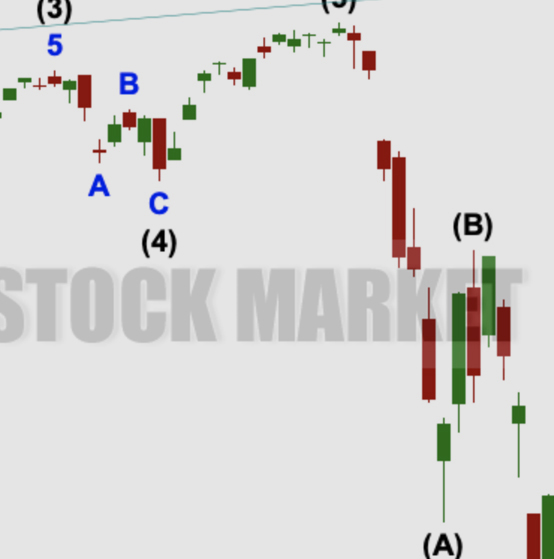
by Lara | Oct 30, 2020 | S&P 500, S&P 500 + DJIA
S&P 500: Elliott Wave and Technical Analysis | Charts – October 30, 2020 Last analysis expected more downwards movement as most likely, which is what has happened. A new main Elliott wave count is used this week. Summary: The main wave count expects downwards...
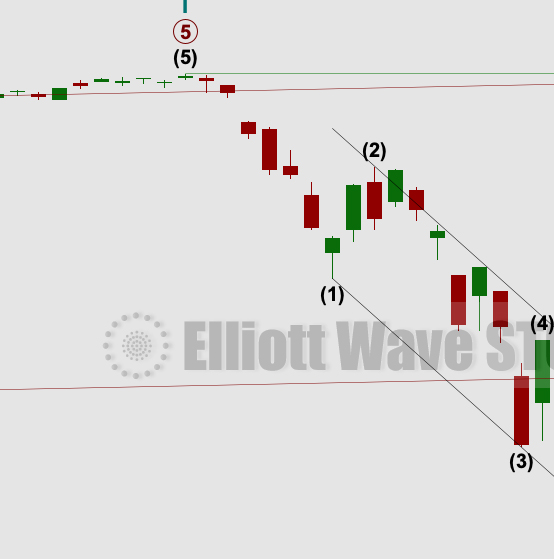
by Lara | Oct 7, 2020 | S&P 500, S&P 500 + DJIA
S&P 500: Elliott Wave and Technical Analysis | Charts – October 7, 2020 An upwards day remains below the prior high. Today the AD line has moved strongly higher. If it continues higher tomorrow, then that may offer support for the alternate Elliott wave count....
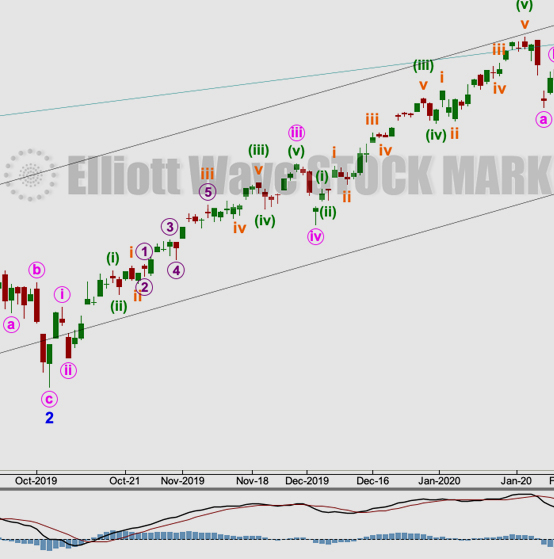
by Lara | Sep 14, 2020 | S&P 500, S&P 500 + DJIA
S&P 500: Elliott Wave and Technical Analysis | Charts – September 14, 2020 Again, VIX and the AD line both give signals for the direction of price tomorrow. The short-term target remains the same. Summary: For the very short term, this bounce may end about 3,481...
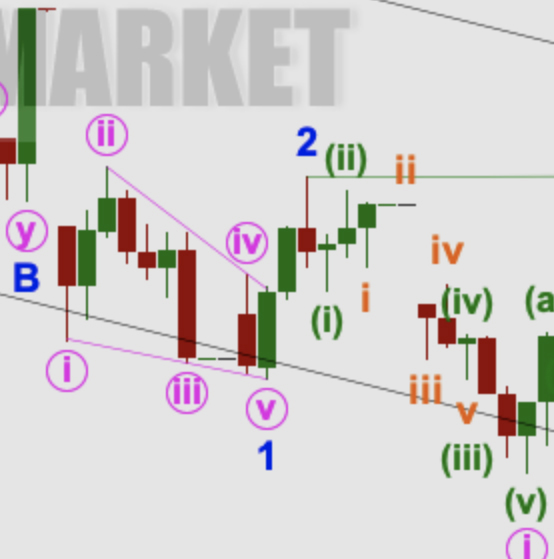
by Lara | Aug 19, 2020 | S&P 500, S&P 500 + DJIA
S&P 500: Elliott Wave and Technical Analysis | Charts – August 19, 2020 Downwards movement breaches the short-term invalidation point on the hourly chart. A new structure is considered for the fifth wave. Summary: It is possible that a mid or long-term high may...
by Lara | Jul 27, 2020 | S&P 500, S&P 500 + DJIA
S&P 500: Elliott Wave and Technical Analysis | Charts – July 27, 2020 Last analysis expected the new trading week to begin with a little upwards movement, which is what has happened. Summary: With the best fit channel breached, it is possible that the bounce is...

by Lara | Jul 1, 2020 | S&P 500, S&P 500 + DJIA
S&P 500: Elliott Wave and Technical Analysis | Charts – July 1, 2020 The last gap is closed, so it is now considered a pattern gap. Upwards movement remains below the invalidation point. The main wave count remains the same. Summary: The multi-week bounce that...
by Lara | Jun 8, 2020 | S&P 500, S&P 500 + DJIA
S&P 500: Elliott Wave and Technical Analysis | Charts – June 8, 2020 On Balance Volume and the AD line have both made new all time highs. All Elliott wave counts remain valid. Summary: The next target is at 3,238. Use the lower edge of the Elliott channel to...

by Lara | May 13, 2020 | S&P 500, S&P 500 + DJIA
S&P 500: Elliott Wave and Technical Analysis | Charts – May 13, 2020 Downwards movement to about 2,789 was expected. The low for this session at 2,793.15 has fallen 4.15 points short of the target. Summary: Upwards movement to a final target at 3,085 may begin....

by Lara | Apr 20, 2020 | S&P 500, S&P 500 + DJIA
S&P 500: Elliott Wave and Technical Analysis | Charts – April 20, 2020 Downwards movement remains above the short-term invalidation point and within the channel. Summary: The bounce may now end about 3,167 in another few weeks. This target is within a normal...


