
S&P 500: Elliott Wave and Technical Analysis | Charts – August 19, 2020
Downwards movement breaches the short-term invalidation point on the hourly chart. A new structure is considered for the fifth wave.
Summary: It is possible that a mid or long-term high may be in place today. If price continues higher, then a high should still be expected prior to 3,432.15. A new low below 3,326.44 and then 2,954.86 would add confidence to this view.
A pullback may find support about 2,938 or 2,653.
A new low below 2,191.86 would be extremely bearish.
The biggest picture, Grand Super Cycle analysis, is here.
Monthly charts are here, with video here.
ELLIOTT WAVE COUNTS
FIRST WAVE COUNT
WEEKLY CHART
Click chart to enlarge.
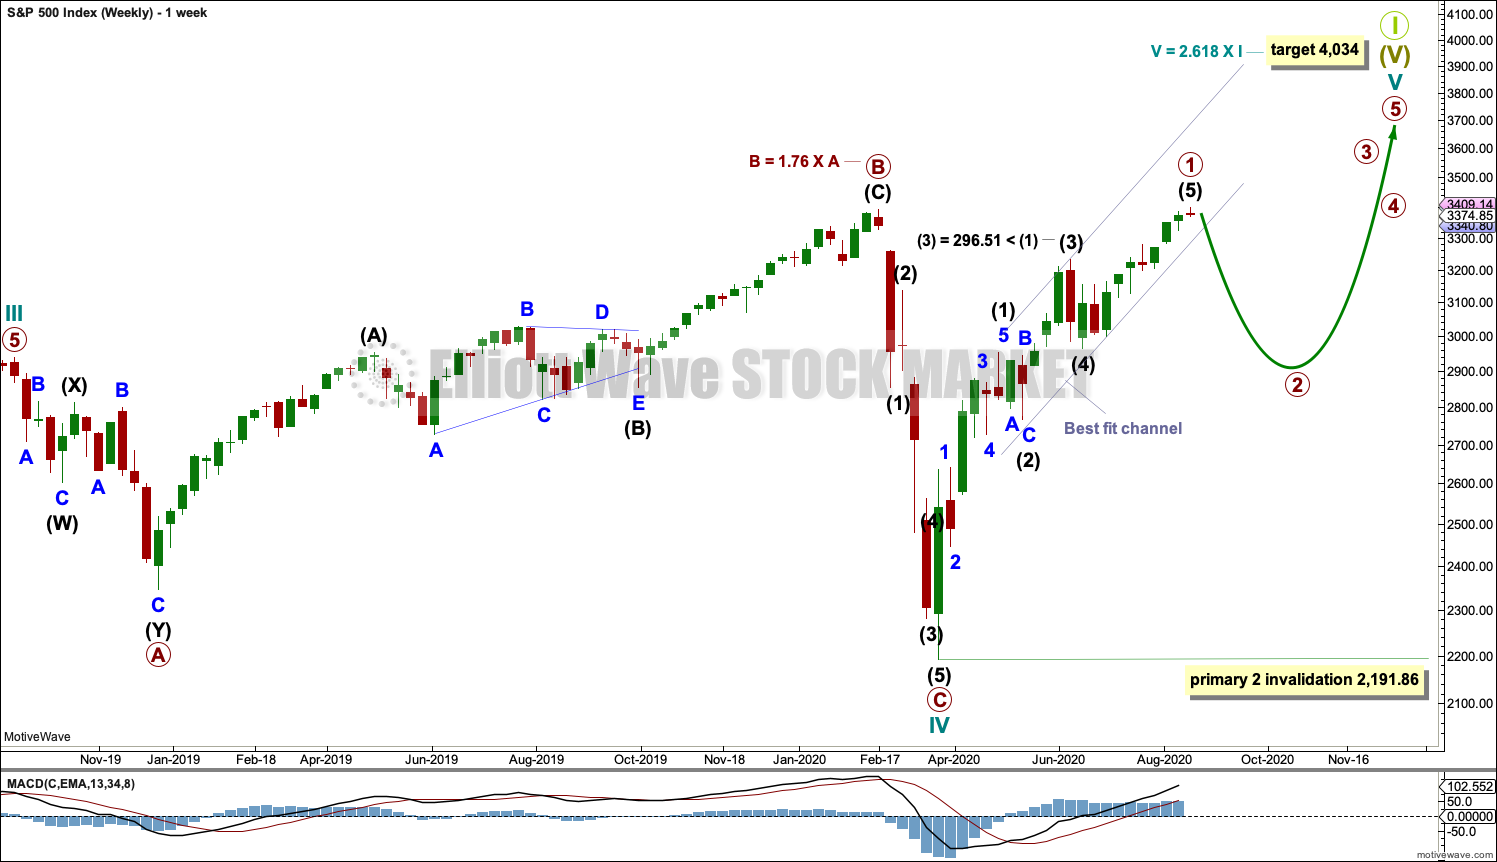
Cycle wave V may last from one to several years.
Cycle wave V may be underway and would most likely subdivide as an impulse. But if overlapping develops, then an ending diagonal should be considered. This chart considers the more common impulse.
Primary wave 1 may be complete. Primary wave 2 may not move beyond the start of primary wave 1 below 2,191.86.
DAILY CHART
Click chart to enlarge.
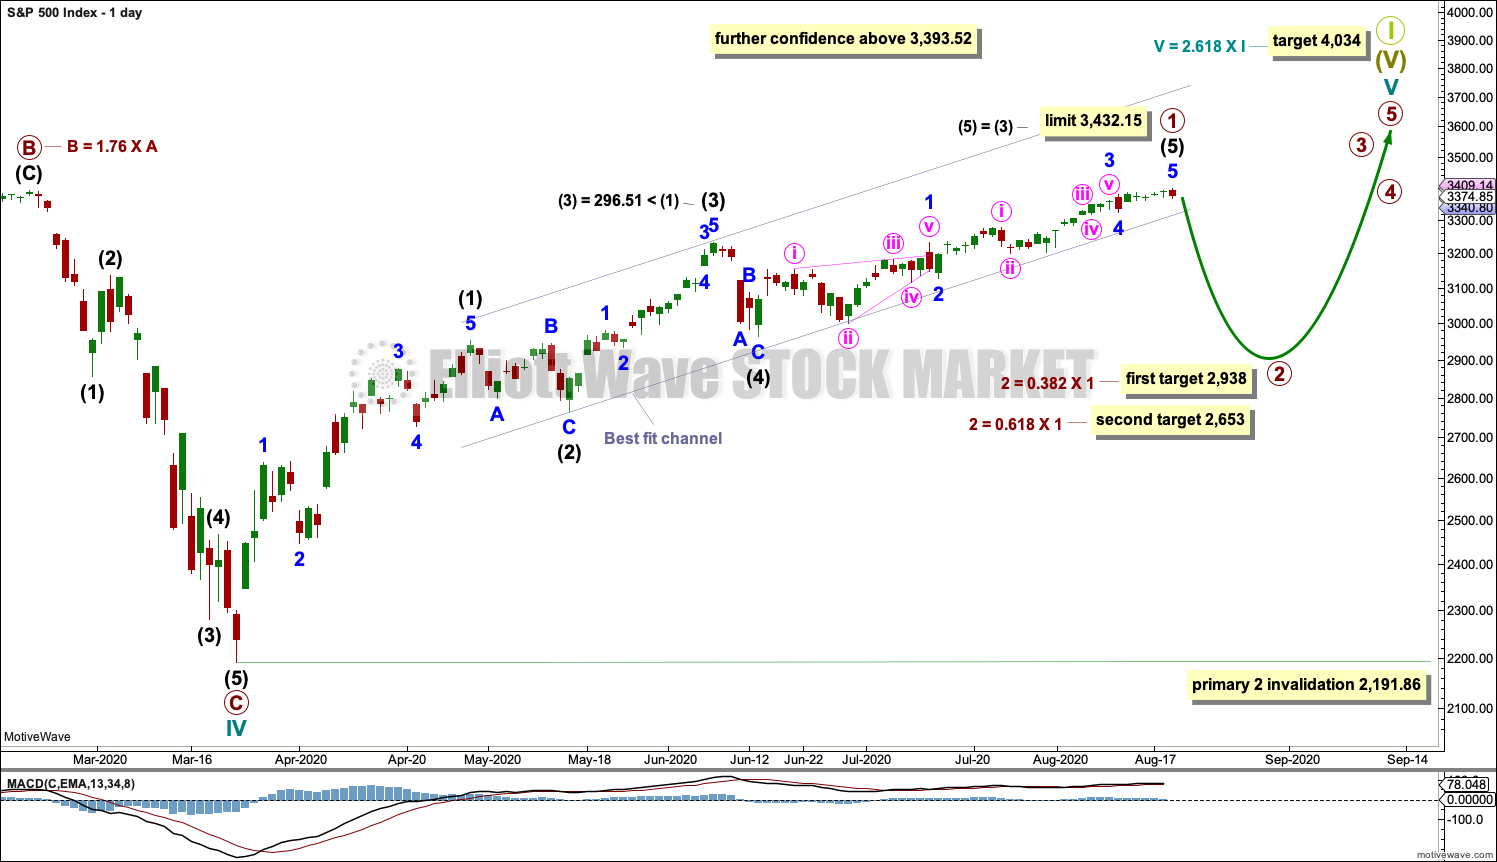
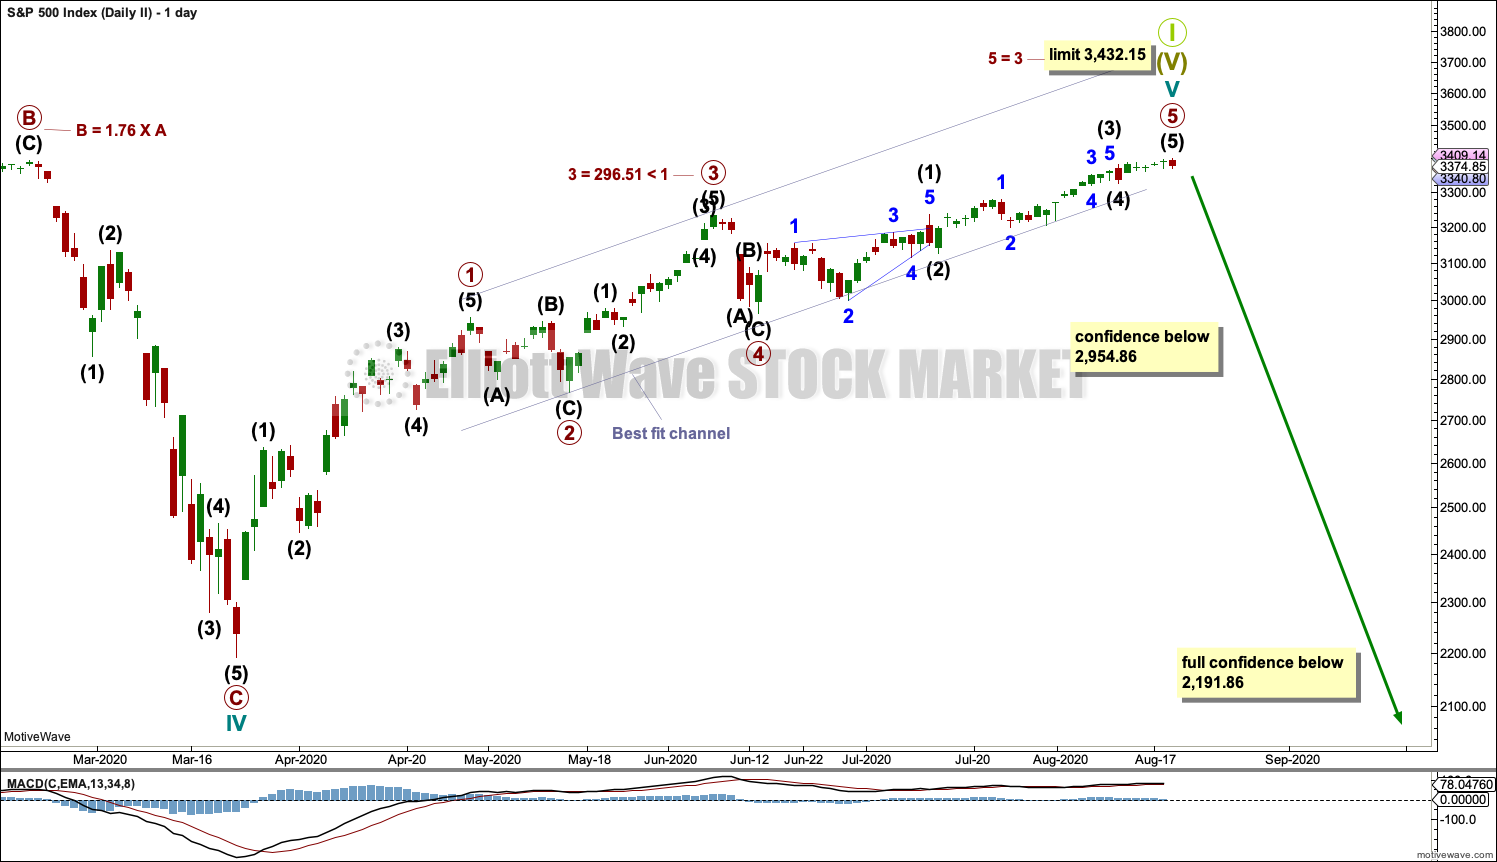
The target for the end of this bull market is provisional. It would best be calculated at primary degree, but that cannot be done until all of primary waves 1 through to 4 are complete. At that stage, the target will be recalculated and will very likely change.
Cycle wave V must subdivide as a five wave motive structure, most likely an impulse. Primary wave 1 within cycle wave V may be complete. Two short-term hourly charts are provided below. Technical analysis supports the first hourly chart by a small margin.
If primary wave 1 continues higher, then it must end before or at 3,432.15 where intermediate wave (5) would reach equality in length with intermediate wave (3). Intermediate wave (3) is shorter than intermediate wave (1), so it may not be the shortest actionary wave.
Primary wave 2 may unfold as a multi-week pullback and may not move beyond the start of primary wave 1 below 2,191.86.
HOURLY CHART
Click chart to enlarge.
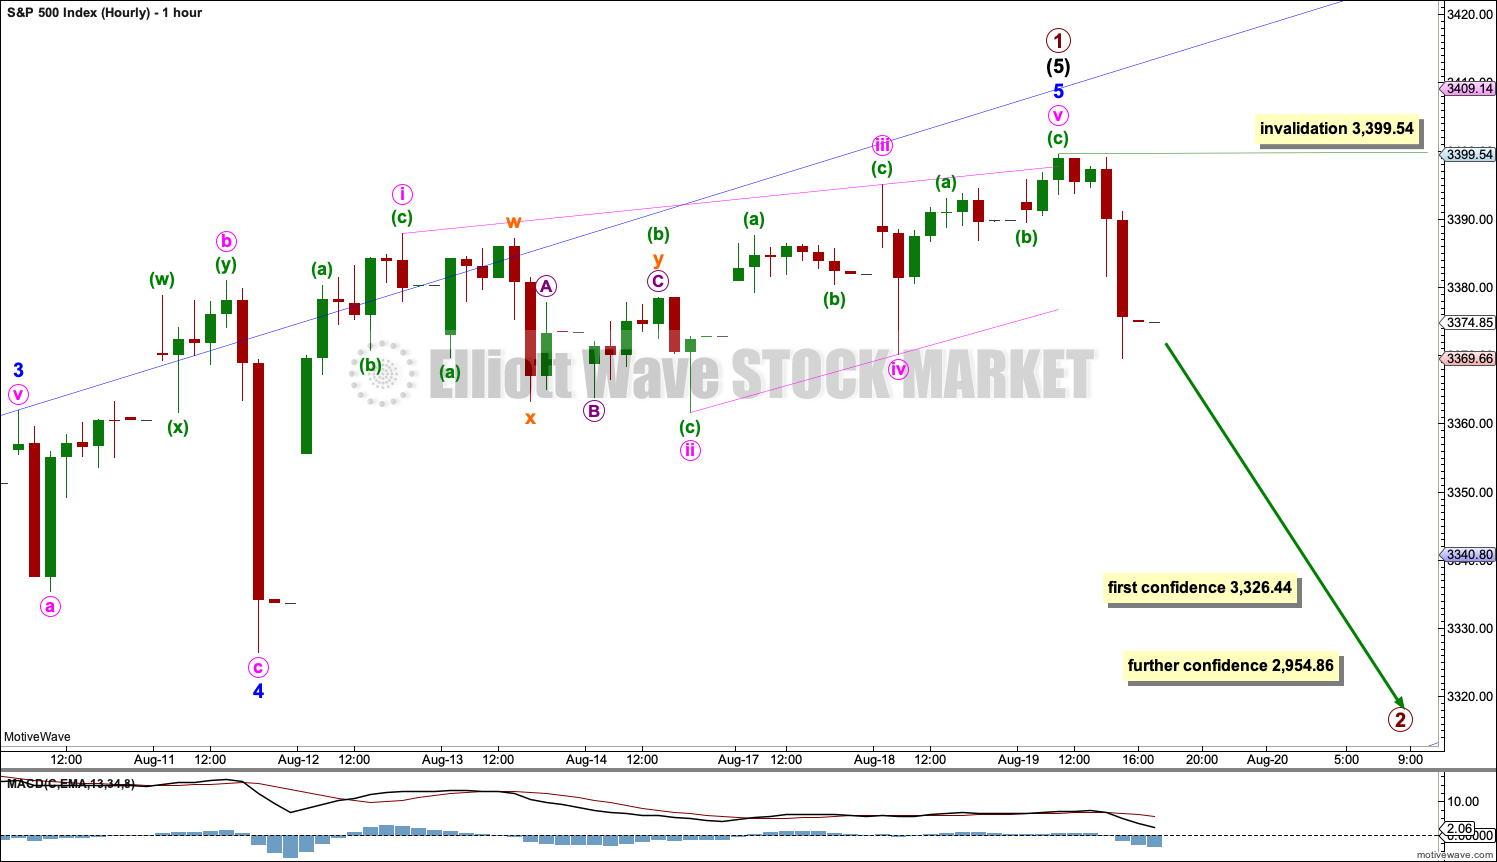
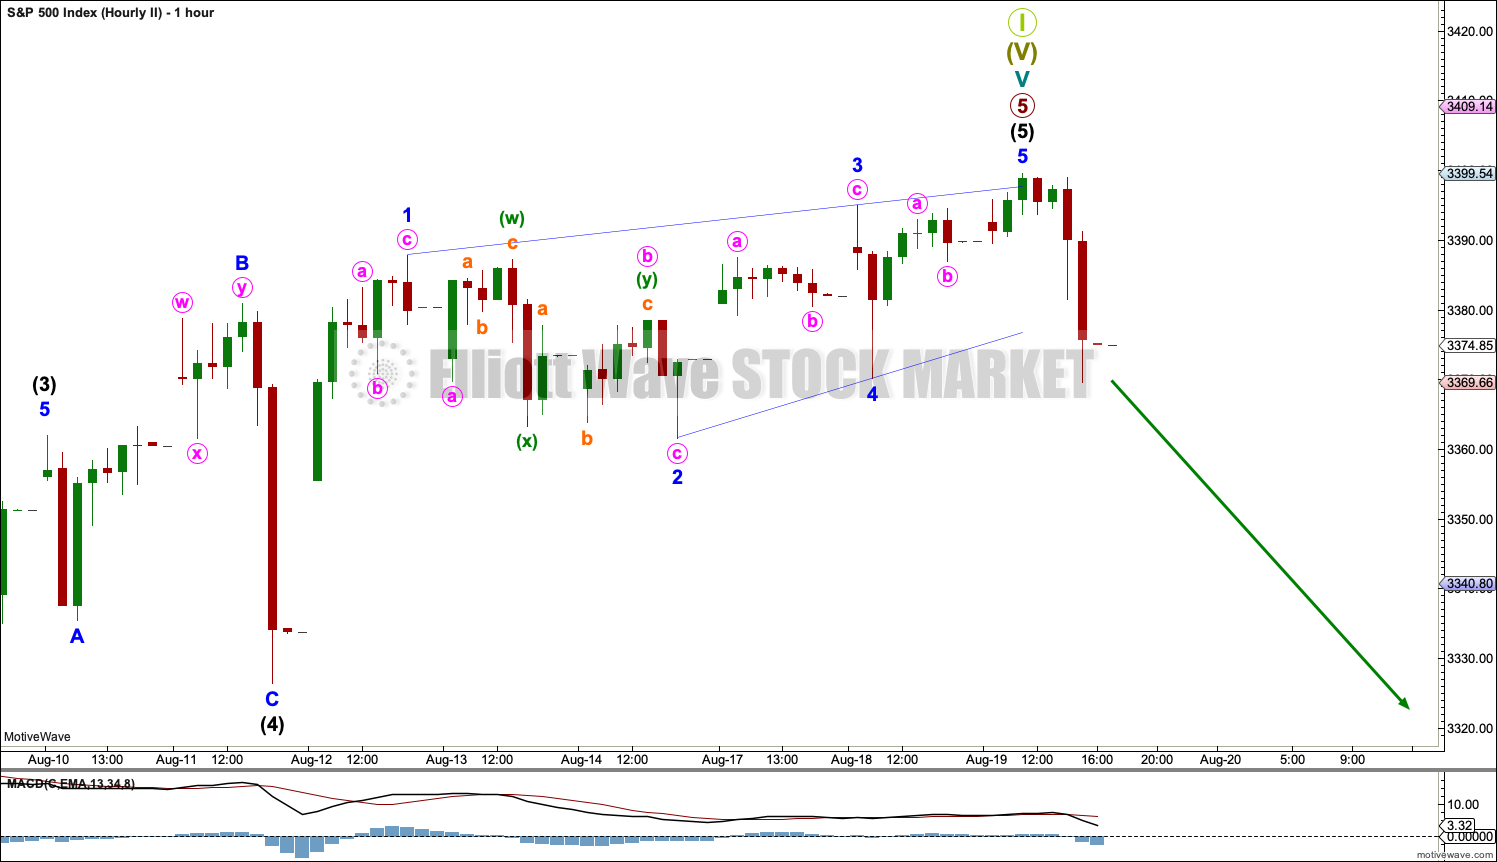
Downwards movement at the end of this session has overlapped back into minute wave i price territory. Downwards movement may not be a fourth wave correction within minor wave 5, so minor wave 5 looks likely to be over.
Minor wave 5 may have subdivided as an ending contracting diagonal. All sub-waves within an ending diagonal must subdivide as zigzags. Minute wave iv must overlap minute wave i price territory and the trend lines must converge. A small overshoot of the i-iii trend line at the end of minute wave v is typical. This structure meets all rules and guidelines for an ending contracting diagonal. The classic pattern equivalent is a rising wedge.
3,326.44 is the start of minor wave 5. A new low below this point may not be a second wave correction within minor wave 5, so at that stage it would add confidence that minor wave 5 should be over
2,954.86 is the price extreme of intermediate wave (1) (seen on the daily chart). A new low below this point may not be intermediate wave (4), so at that stage primary wave 1 should be over.
Primary wave 2 should continue for at least a few weeks. It may end about either the 0.382 or 0.618 Fibonacci ratios; neither is favoured as for this particular market second wave corrections are not often deep.
ALTERNATE HOURLY CHART
Click chart to enlarge.
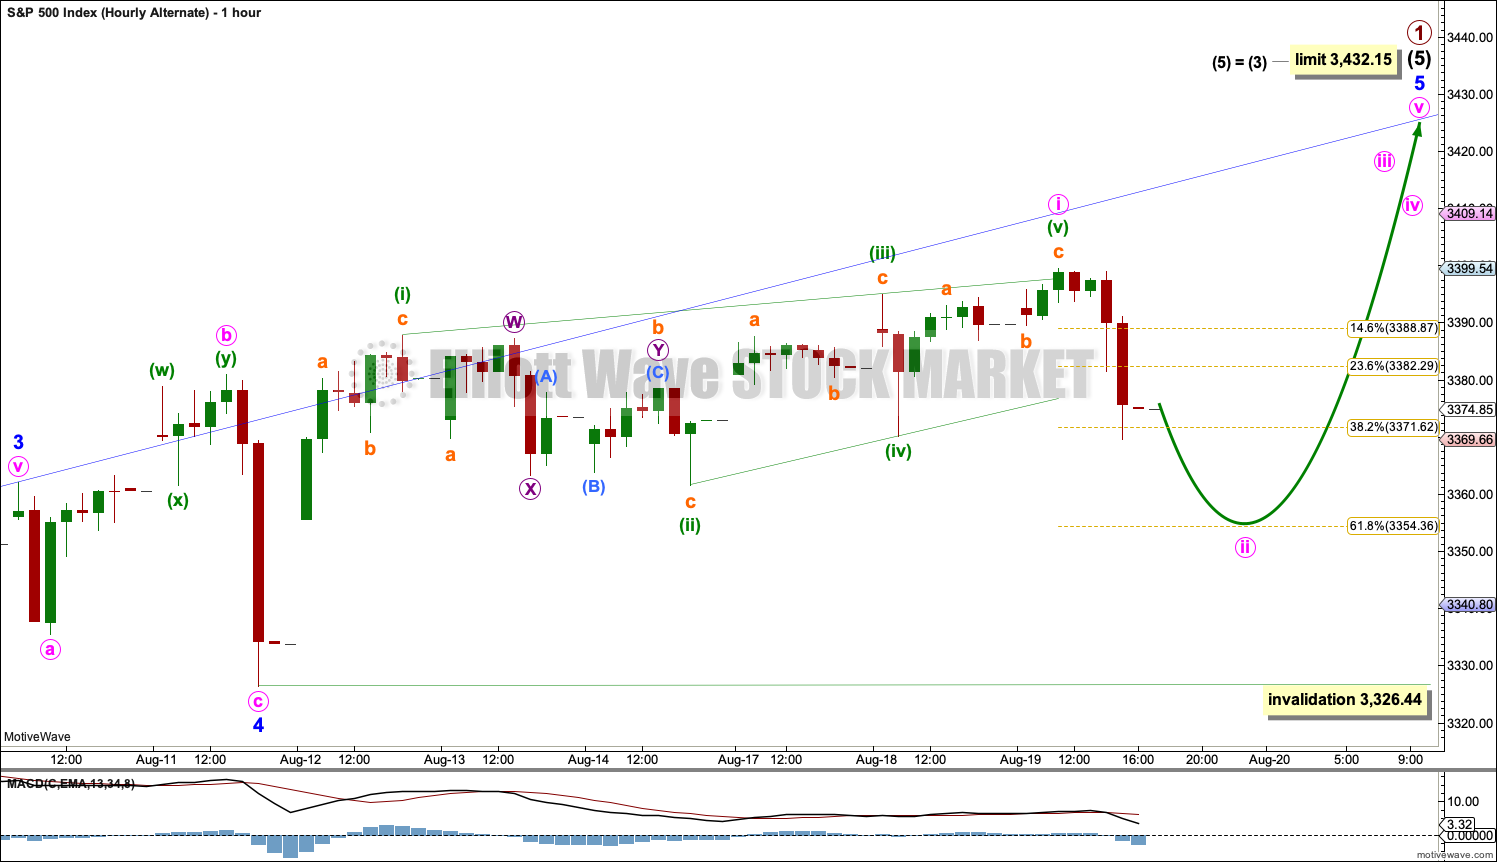
By simply moving the degree of labelling within minor wave 5 all down one degree, it is possible that only minute wave i was over at the last high and downwards movement may be minute wave ii.
Minute wave i may have completed as a leading contracting diagonal. The rules for a leading diagonal are almost the same as for an ending diagonal. Sub-waves (i), (iii) and (v) within a leading diagonal most commonly subdivide as zigzags, but may also appear as impulses.
Minute wave ii may not move beyond the start of minute wave i below 3,326.44.
SECOND WAVE COUNT
DAILY CHART
Click chart to enlarge.
This wave count is the same as the first wave count with the exception of the degree of labelling within cycle wave V. If the degree of labelling is moved up one degree, then it is possible that cycle wave V to end Super cycle wave (V) to end Grand Super Cycle wave I is very close to completion.
Primary waves 1 through to 4 within cycle wave V may be complete. Primary wave 5 may possibly be complete today.
A new low below 2,191.86 would invalidate the first wave count and provide full confidence in this second wave count.
Cycle wave V has moved above the end of cycle wave I at 2,940.91, avoiding a truncation. It has now also moved beyond the price territory of cycle wave IV to a new all time high above 3,393.52.
HOURLY CHART
Click chart to enlarge.
At the hourly chart level, this wave count is exactly the same as the first wave count with the sole exception being the degree of labelling. Here, the degree of labelling is one degree higher.
The alternate hourly chart provided for the first wave count also works in exactly the same way for this second wave count. The degree of labelling within intermediate wave (5) may be moved down one degree. Minor wave 1 may be complete as a leading contracting diagonal.
TECHNICAL ANALYSIS
WEEKLY CHART
Click chart to enlarge. Chart courtesy of StockCharts.com.
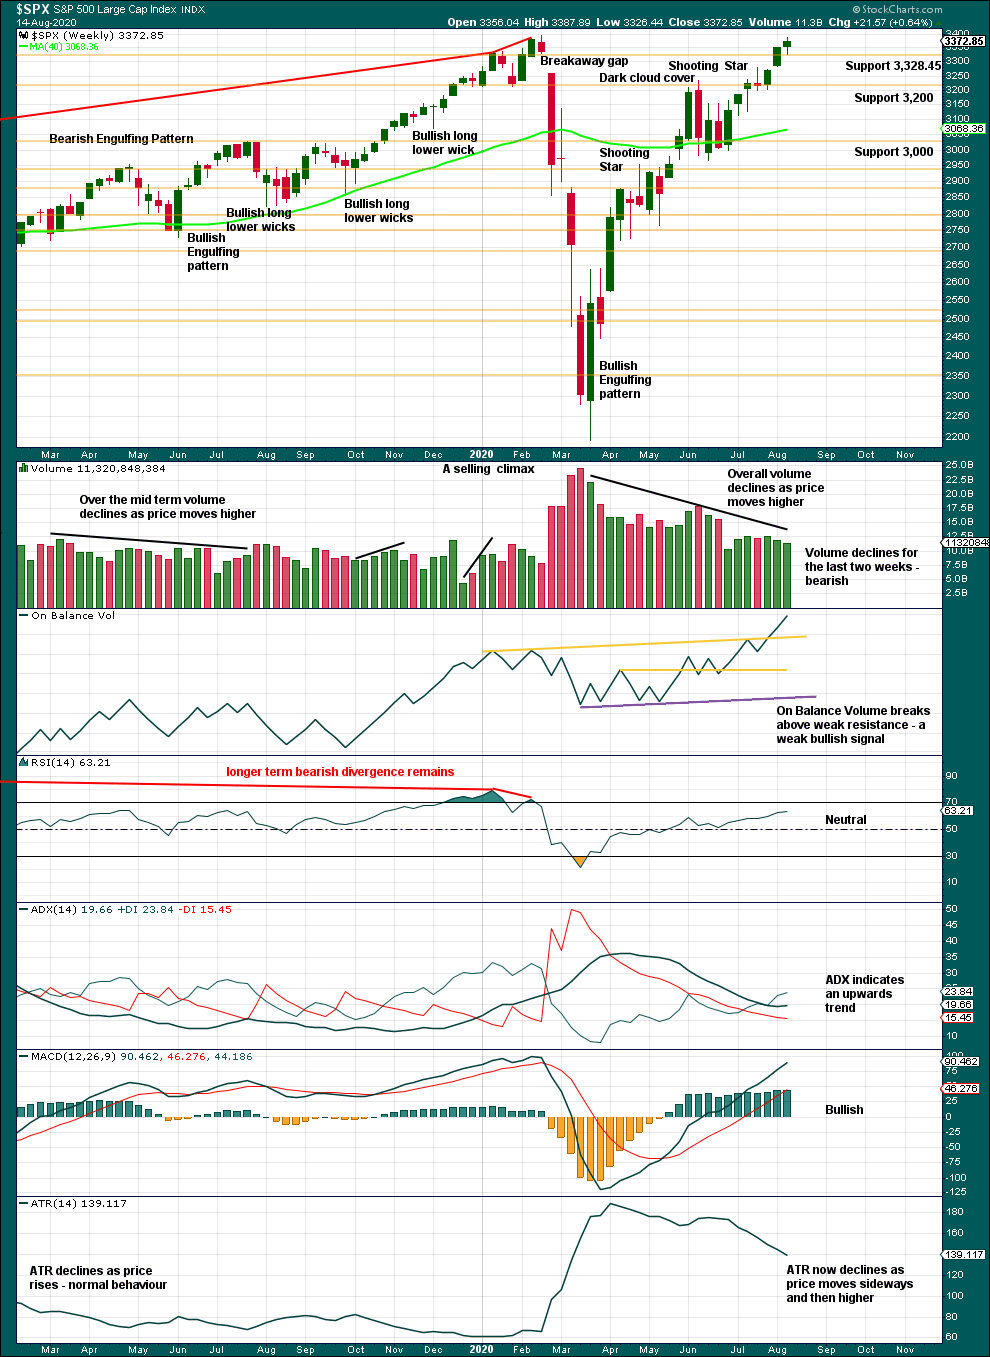
A decline in range and volume last week indicates weakness. There is strong resistance here at the last all time high at 3,393.52. If this can be overcome, then expect some energy to be released and to see price move up with a little more strength.
RSI is not overbought; there is room for upwards movement to continue.
DAILY CHART
Click chart to enlarge. Chart courtesy of StockCharts.com.
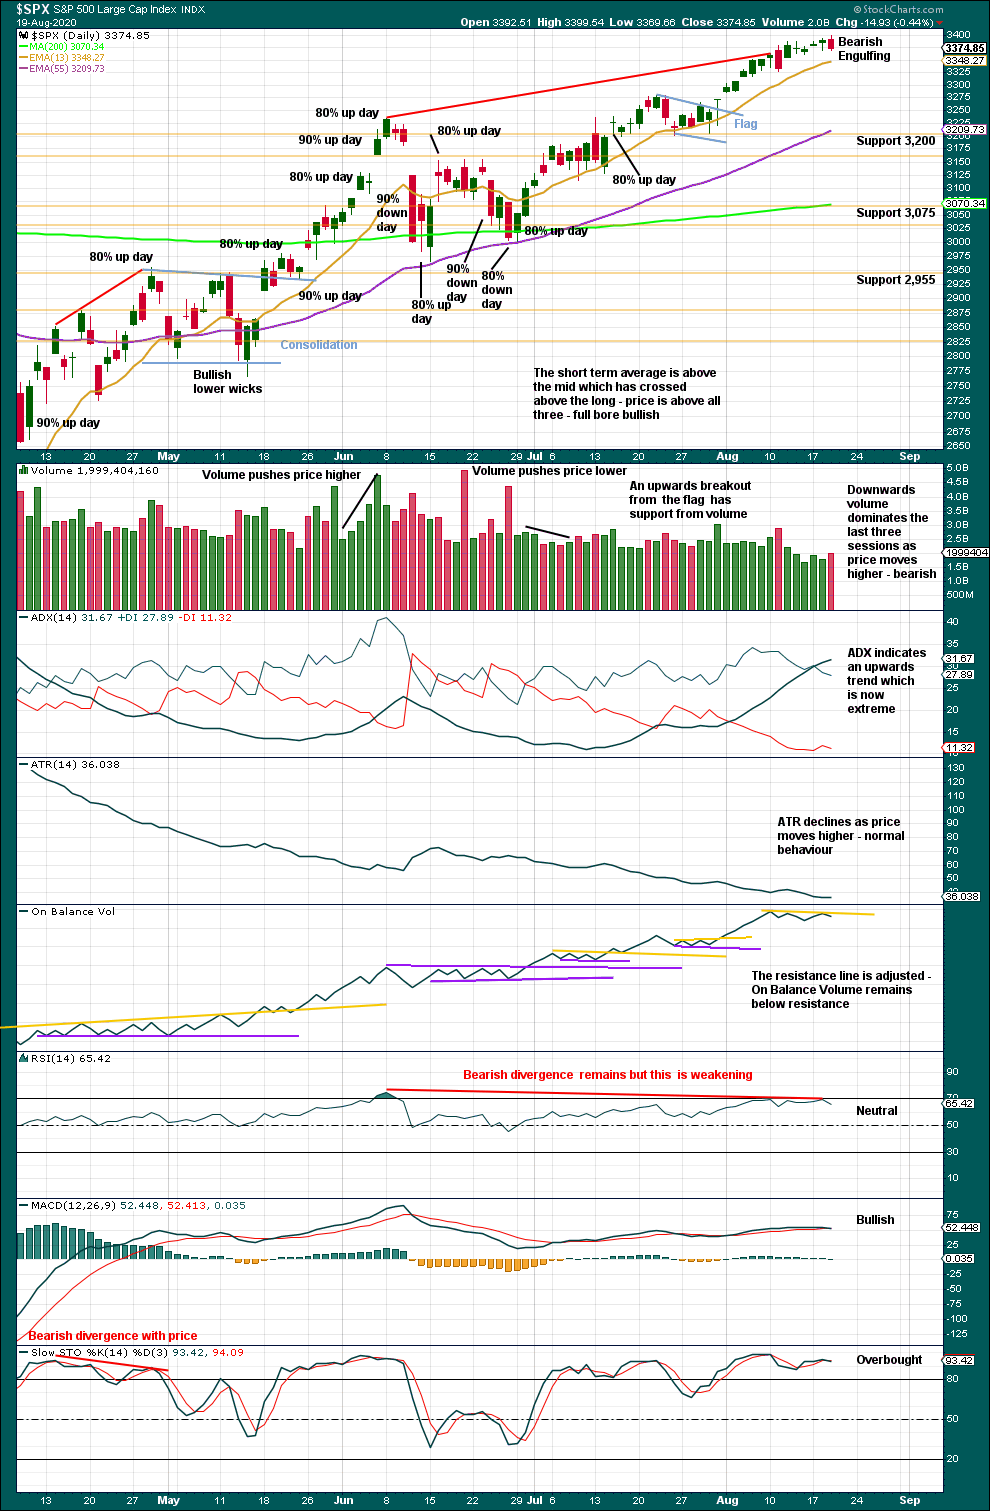
A target from the flag pole would be at 3,405. This has been almost met.
Now a bearish candlestick reversal pattern is completed. However, this happened six sessions prior yet price continued higher. In this instance though there is further bearishness.
For three sessions now price has moved higher, but down volume has dominated each session. On Balance Volume remains below resistance and has not confirmed the last two highs. Price has been unable to close above the prior all time high at 3,393.52. ADX is extreme and RSI exhibits bearish divergence.
There is risk here of a multi-week pullback or a more sustainable high.
BREADTH – AD LINE
WEEKLY CHART
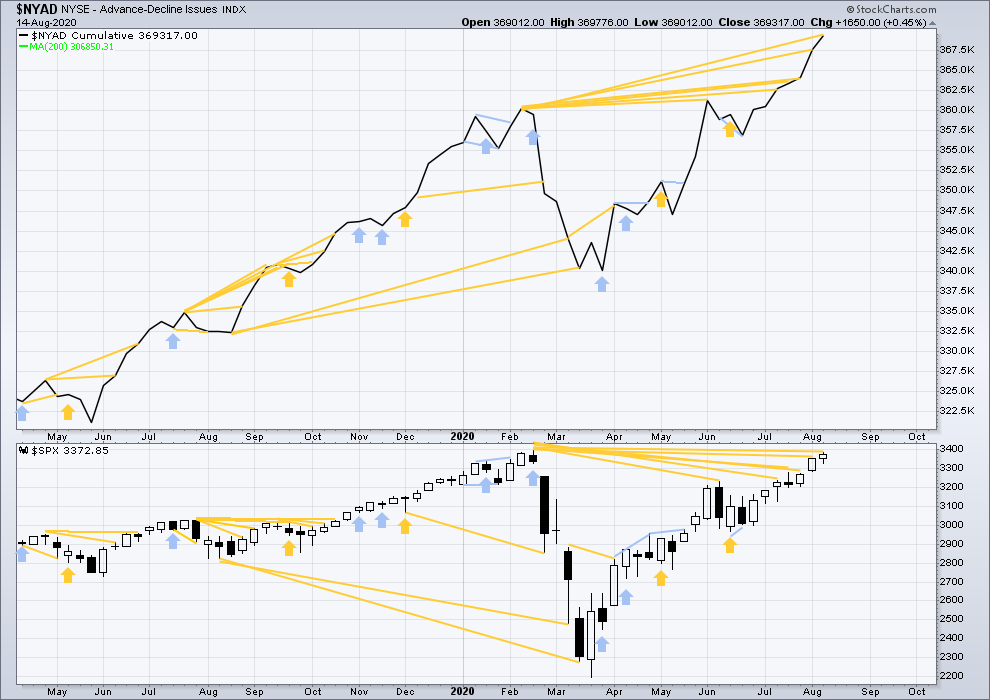
Click chart to enlarge. Chart courtesy of StockCharts.com. So that colour blind members are included, bearish signals will be noted with blue and bullish signals with yellow.
Breadth should be read as a leading indicator.
Last week the NYSE all issues AD line has made another new all time high, although Lowry’s Operating Companies Only AD line still has not. This divergence is bullish and noted on this chart, but failure of the OCO AD line to confirm this divergence reduces the strength of the signal.
Large caps all time high: 3,393.52 on 19th February 2020.
Mid caps all time high: 2,109.43 on 20th February 2020.
Small caps all time high: 1,100.58 on 27th August 2018.
All of small, mid and large caps have now made new swing highs above the prior highs of the 8th of June. This last rise was led by large caps, which is a feature of an aged bull market.
DAILY CHART
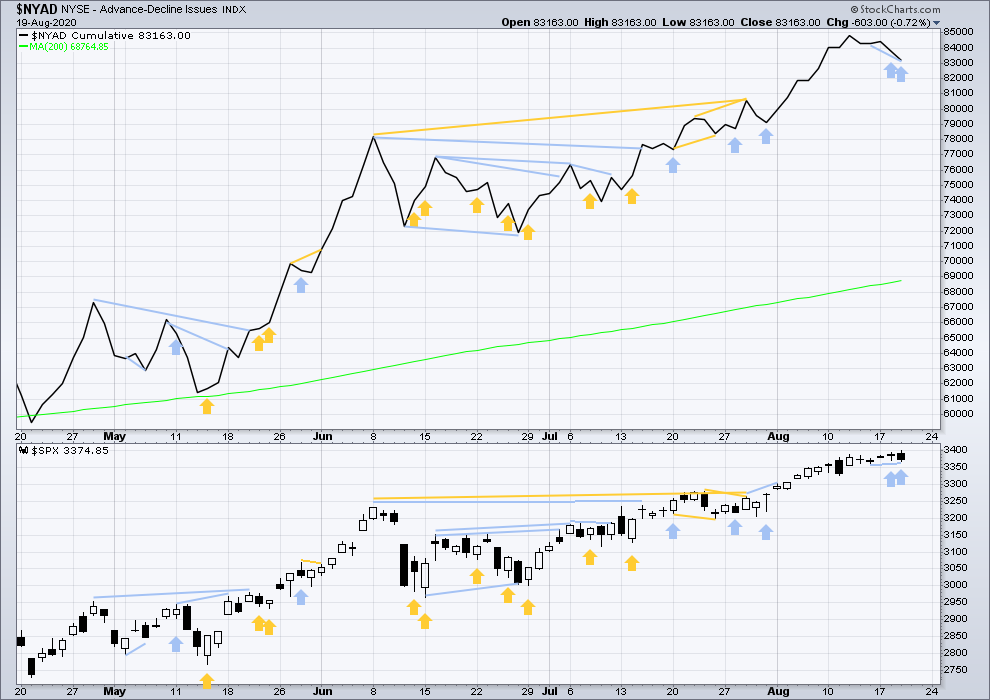
Click chart to enlarge. Chart courtesy of StockCharts.com. So that colour blind members are included, bearish signals will be noted with blue and bullish signals with yellow.
Price has moved higher for a second day in a row, but the AD line has moved lower. Today the AD line has made a new low below the low three sessions prior, but price has not. There is now a cluster of three bearish signals from the AD line.
VOLATILITY – INVERTED VIX CHART
WEEKLY CHART
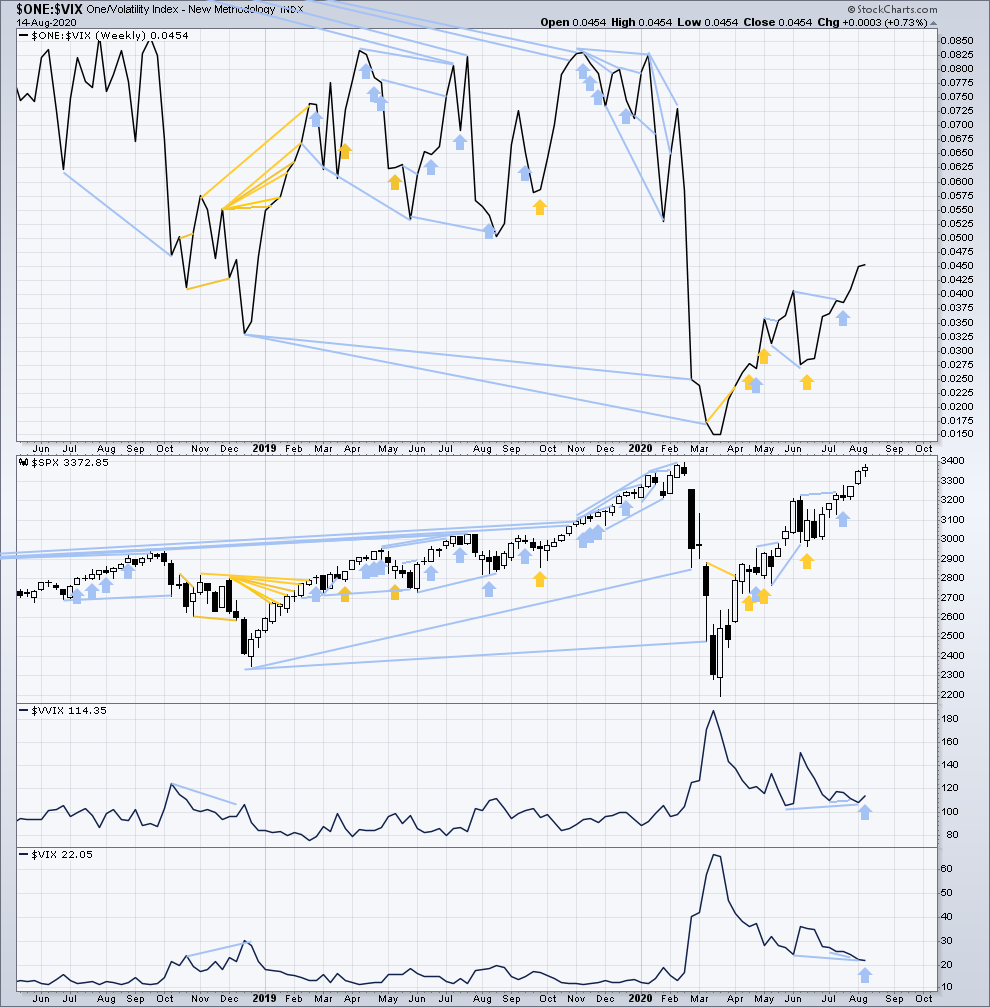
Click chart to enlarge. Chart courtesy of StockCharts.com. So that colour blind members are included, bearish signals will be noted with blue and bullish signals with yellow.
Inverted VIX remains well below all time highs. There remains over two years of strong bearish divergence between price and inverted VIX.
Last week both price and inverted VIX have moved higher. There is no new divergence.
Comparing VIX and VVIX: From weeks beginning 1st June to this last week, VIX has made new lows as price has made new highs, but VVIX has failed to make corresponding new lows with VIX. VVIX remains slightly elevated. This divergence is not strong, but it is bearish for price. VIX has moved slightly lower for last week, but VVIX has moved more sharply higher. This is a week of single instance divergence, which is bearish for price.
DAILY CHART
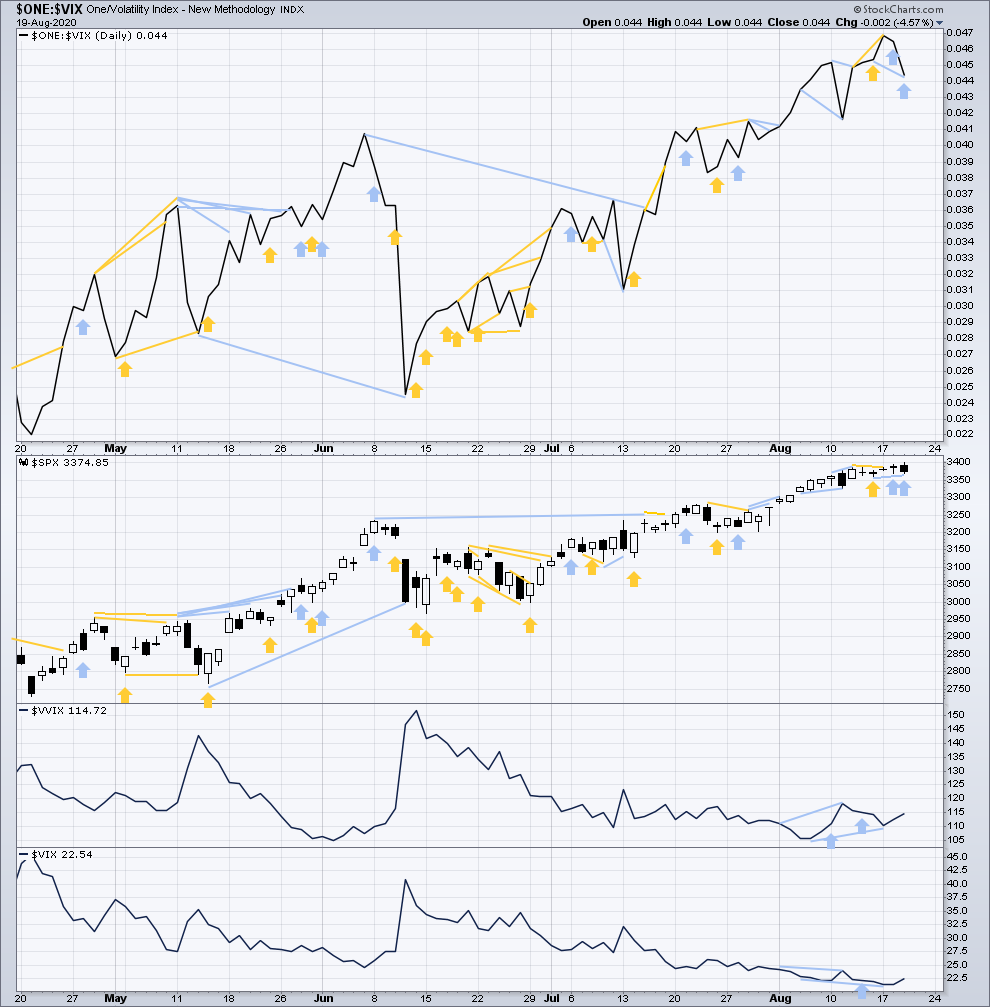
Click chart to enlarge. Chart courtesy of StockCharts.com. So that colour blind members are included, bearish signals will be noted with blue and bullish signals with yellow.
Price has moved higher for a second day in a row, but inverted VIX has moved lower. Inverted VIX has today made a new low below the low three sessions prior, but price has not. There is now a cluster of three bearish signals.
Comparing VIX and VVIX at the daily chart level: VIX is making new lows, but VVIX remains slightly elevated. This divergence is bearish.
DOW THEORY
Dow Theory has confirmed a bear market with the following lows made on a closing basis:
DJIA: 21,712.53 – a close below this point has been made on the March 12, 2020.
DJT: 8,636.79 – a close below this point has been made on March 9, 2020.
Adding in the S&P and Nasdaq for an extended Dow Theory, a bear market has now been confirmed:
S&P500: 2,346.58 – a close below this point has now been made on March 20, 2020.
Nasdaq: 7,292.22 – a close below this point was made on the March 12, 2020.
At this time, to shift Dow Theory from viewing a bear market to confirmation of a new bull market would require new highs made on a closing basis:
DJIA – 29,568.57
DJT – 11,623.58
Adding in the S&P and Nasdaq for an extended Dow Theory:
S&P500 – 3,393.52
Nasdaq – 9,838.37 – closed above on June 8, 2020.
All of Nasdaq, S&P500 and now DJT have made new swing highs above prior highs of the 8th of June, but DJIA has not.
Published @ 08:03 p.m. ET
—
Careful risk management protects your trading account(s).
Follow my two Golden Rules:
1. Always trade with stops.
2. Risk only 1-5% of equity on any one trade.
—
New updates to this analysis are in bold.