by Lara | Aug 18, 2021 | S&P 500, S&P 500 + DJIA
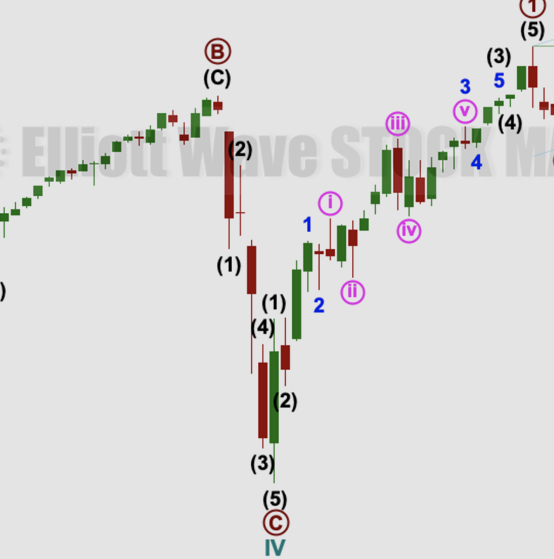
S&P 500: Elliott Wave and Technical Analysis | Charts – August 18, 2021 All three Elliott wave counts yesterday expected more downwards movement, which is what has happened. Summary: Bearish divergence between price and both of the AD line and inverted VIX...
by Lara | Jul 26, 2021 | S&P 500, S&P 500 + DJIA
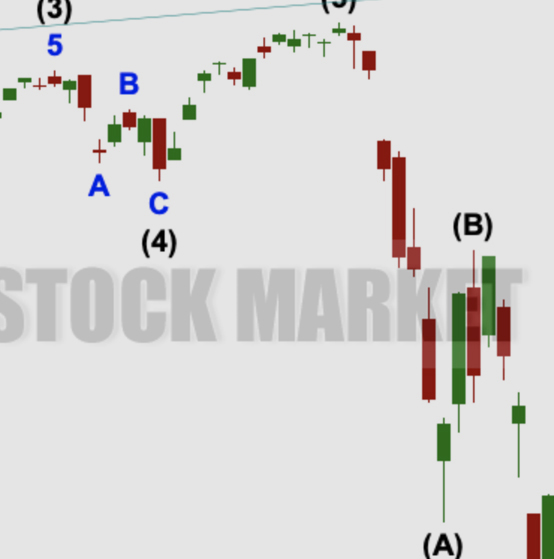
S&P 500: Elliott Wave and Technical Analysis | Charts – July 26, 2021 The AD line continues to support the main Elliott wave count. Today a new alternate Elliott wave count on the weekly chart is considered. Summary: There is a cluster of bearish signals from the...
by Lara | Jun 30, 2021 | S&P 500, S&P 500 + DJIA
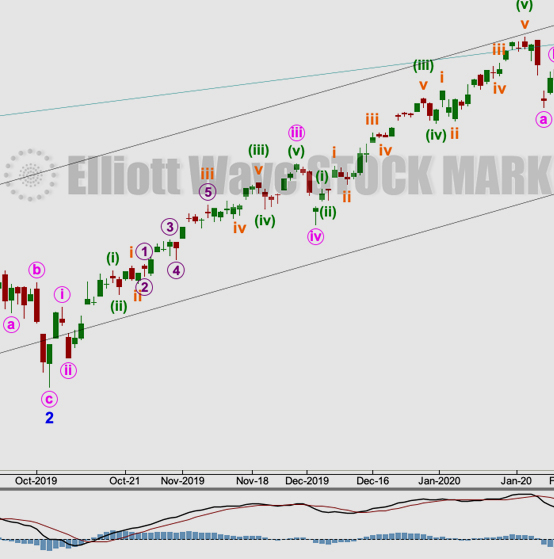
S&P 500: Elliott Wave and Technical Analysis | Charts – June 30, 2021 The S&P keeps making new all time highs, which is exactly what this analysis has long expected. Targets calculated from the main Elliott wave count remain the same. Summary: The primary...
by Lara | Jun 7, 2021 | S&P 500, S&P 500 + DJIA
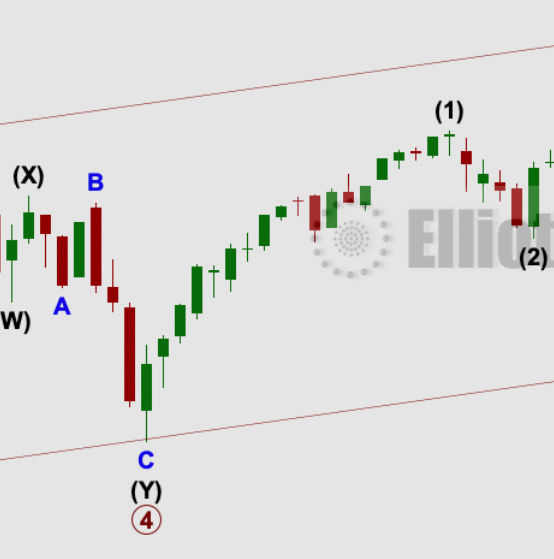
S&P 500: Elliott Wave and Technical Analysis | Charts – June 7, 2021 A small range inside day leaves the Elliott wave count unchanged. Another signal from the AD line supports the Elliott wave count. Summary: The trend is up. The next target for the next wave up...
by Lara | May 14, 2021 | S&P 500, S&P 500 + DJIA
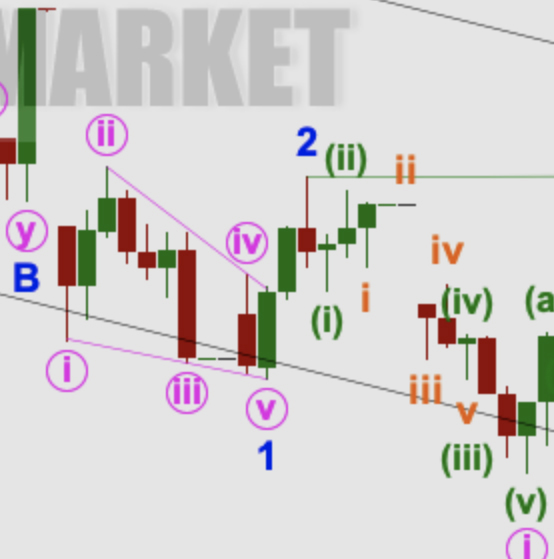
S&P 500: Elliott Wave and Technical Analysis | Charts – May 14, 2021 The main Elliott wave count expected more upwards movement to end the week, which is exactly what has happened. Summary: Friday completes a near 90% up day. This suggests the low may be...
by Lara | Apr 19, 2021 | S&P 500, S&P 500 + DJIA
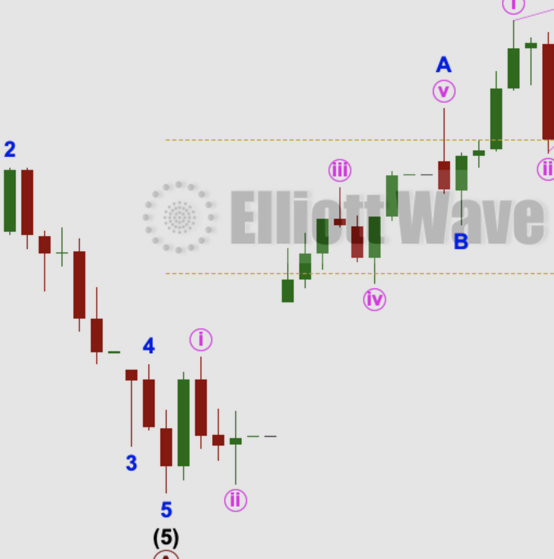
S&P 500: Elliott Wave and Technical Analysis | Charts – April 19, 2021 Downwards movement today breached a very short-term channel. Two hourly Elliott wave counts are used again today. Summary: The wave count expects a third wave at three large degrees may have...
by Lara | Mar 10, 2021 | S&P 500, S&P 500 + DJIA
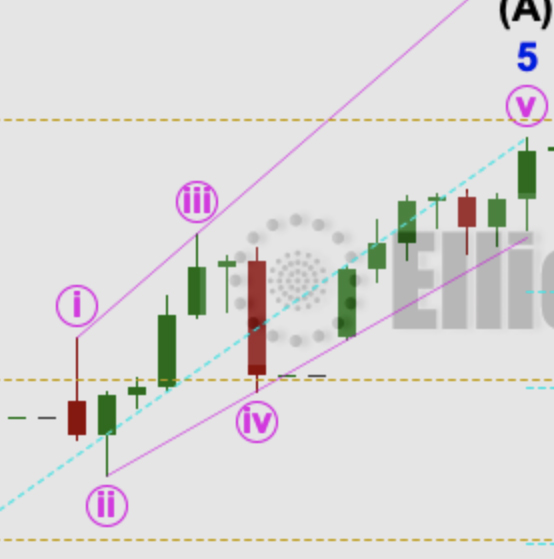
S&P 500: Elliott Wave and Technical Analysis | Charts – March 10, 2021 Price again has moved higher, which was overall expected. Summary: The pullback may now be complete; next support may be the 0.382 Fibonacci ratio at 3,667 if it continues lower. Another new...

by Lara | Jan 21, 2021 | S&P 500, S&P 500 + DJIA
S&P 500: Elliott Wave and Technical Analysis | Charts – January 21, 2021 A little more upwards movement completes a short-term Elliott wave structure and brings price to the upper edge of a channel. Summary: The wave count expects the low of the 30th of October...

by Lara | Dec 24, 2020 | S&P 500, S&P 500 + DJIA
S&P 500: Elliott Wave and Technical Analysis | Charts – December 24, 2020 Today’s session was quiet (markets closed early, at 1 p.m.) and leaves this analysis unchanged. Price continues to move overall higher, with higher highs and higher lows, as the...


