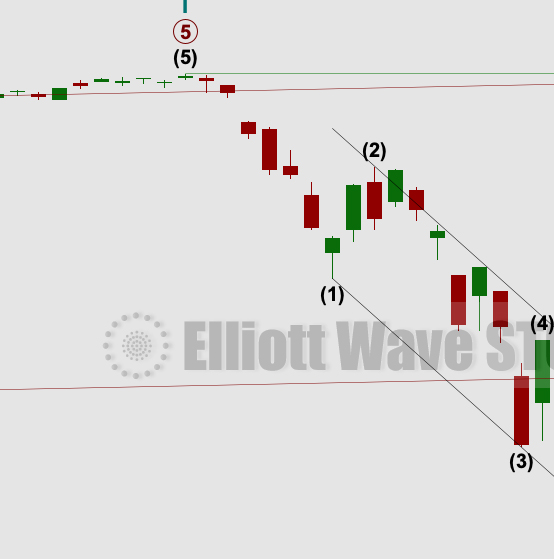
by Lara | Dec 21, 2020 | S&P 500, S&P 500 + DJIA
S&P 500: Elliott Wave and Technical Analysis | Charts – December 21, 2020 Downwards movement has bounced up strongly off the lower edge of a channel on the daily chart. The longer term Elliott wave count remains the same. Summary: The wave count expects the low...
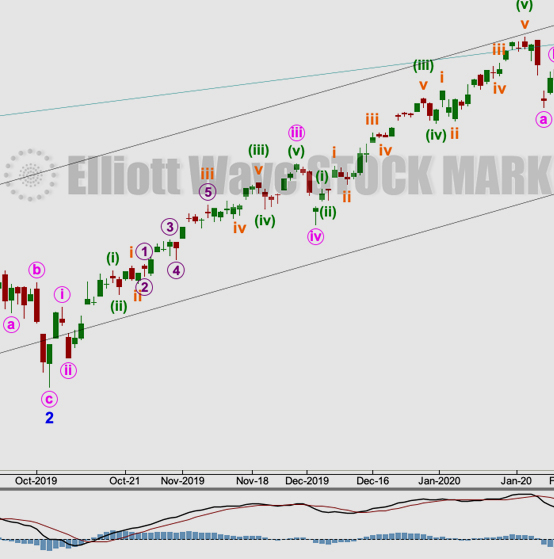
by Lara | Nov 3, 2020 | S&P 500, S&P 500 + DJIA
S&P 500: Elliott Wave and Technical Analysis | Charts – November 3, 2020 Upwards movement remains below the short-term invalidation point for the main Elliott wave count, which is used as a confidence point for an alternate Elliott wave count. All three Elliott...
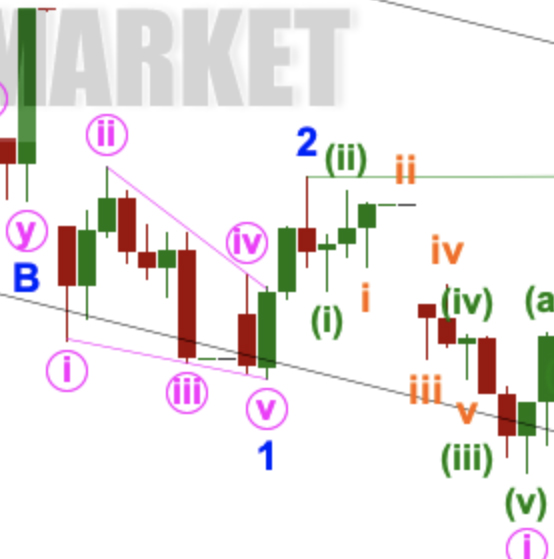
by Lara | Oct 9, 2020 | S&P 500, S&P 500 + DJIA
S&P 500: Elliott Wave and Technical Analysis | Charts – October 9, 2020 Upwards movement continues as the first Elliott wave count expects. The target remains the same. Summary: A target for primary wave 3 to end is now at 4,606. The invalidation point is moved...
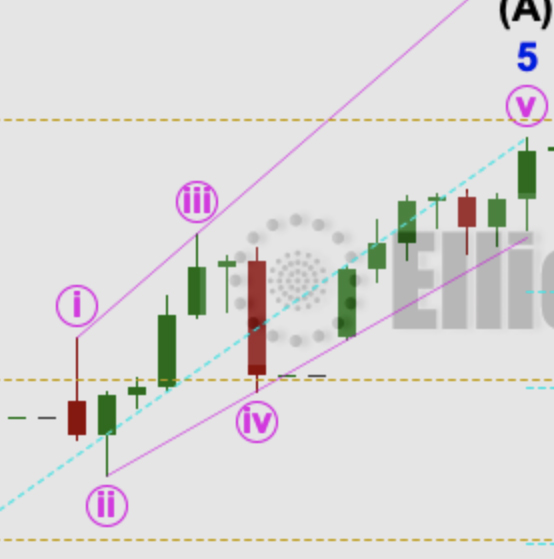
by Lara | Sep 16, 2020 | S&P 500, S&P 500 + DJIA
S&P 500: Elliott Wave and Technical Analysis | Charts – September 16, 2020 Today it is possible that the B wave may be over. Two short-term charts are provided. Summary: A triangle may continue sideways. Thereafter, downwards movement may continue. The first wave...
by Lara | Aug 21, 2020 | S&P 500, S&P 500 + DJIA
S&P 500: Elliott Wave and Technical Analysis | Charts – August 21, 2020 Upwards movement continues. A new alternate Elliott wave count is published this week. Summary: Upwards movement may still complete prior to 3,432.15. However, if price passes 3,432.15, then...
by Lara | Jul 29, 2020 | S&P 500, S&P 500 + DJIA
S&P 500: Elliott Wave and Technical Analysis | Charts – July 29, 2020 Upwards movement today remains below the short-term invalidation point on the hourly chart. Summary: With the best fit channel breached, it is possible that the bounce is over and the bear...

by Lara | Jul 6, 2020 | S&P 500, S&P 500 + DJIA
S&P 500: Elliott Wave and Technical Analysis | Charts – July 6, 2020 The Island Reversal pattern is negated with the second gap closed. Both bullish and bearish Elliott wave counts remain valid. Volume and breadth of this last session is analysed to indicate...

by Lara | Jun 10, 2020 | S&P 500, S&P 500 + DJIA
S&P 500: Elliott Wave and Technical Analysis | Charts – June 10, 2020 For the very short term, a small pullback was expected to end about 3,182. The low for the session at 3,181.49 was just 0.51 points below the short-term target. Summary: The next target is at...

by Lara | May 15, 2020 | S&P 500, S&P 500 + DJIA
S&P 500: Elliott Wave and Technical Analysis | Charts – May 15, 2020 Upwards movement was expected from both short-term Elliott wave counts yesterday, which is how the session has unfolded. Summary: Upwards movement to a final target at 3,058 or 3,238 may have...


