
S&P 500: Elliott Wave and Technical Analysis | Charts – November 3, 2020
Upwards movement remains below the short-term invalidation point for the main Elliott wave count, which is used as a confidence point for an alternate Elliott wave count.
All three Elliott wave counts remain valid.
Summary: The main wave count expects downwards movement to 3,171 and has a channel for support. The invalidation point for this wave count is at 2,191.86.
The first alternate wave count expects a low is now in and has a target at 4,606 and an invalidation point at 3,209.45. This wave count now has a little support from a breach of the prior channel on the hourly chart and now two back to back 80% up days. A new high above 3,419.93 would add further confidence.
At this stage, the main wave count and the first alternate wave count may now have a close to even probability.
If the main wave count is invalidated with a new low below 2,191.86, then the second alternate may be used. This wave count is extremely bearish. It expects a bear market to continue for several years and possibly over a decade. It has no lower final target at this stage, but a short-term target is at 2,937.
The biggest picture, Grand Super Cycle analysis, is here.
Monthly charts are here, with video here.
ELLIOTT WAVE COUNTS
FIRST WAVE COUNT
WEEKLY CHART
Click chart to enlarge.
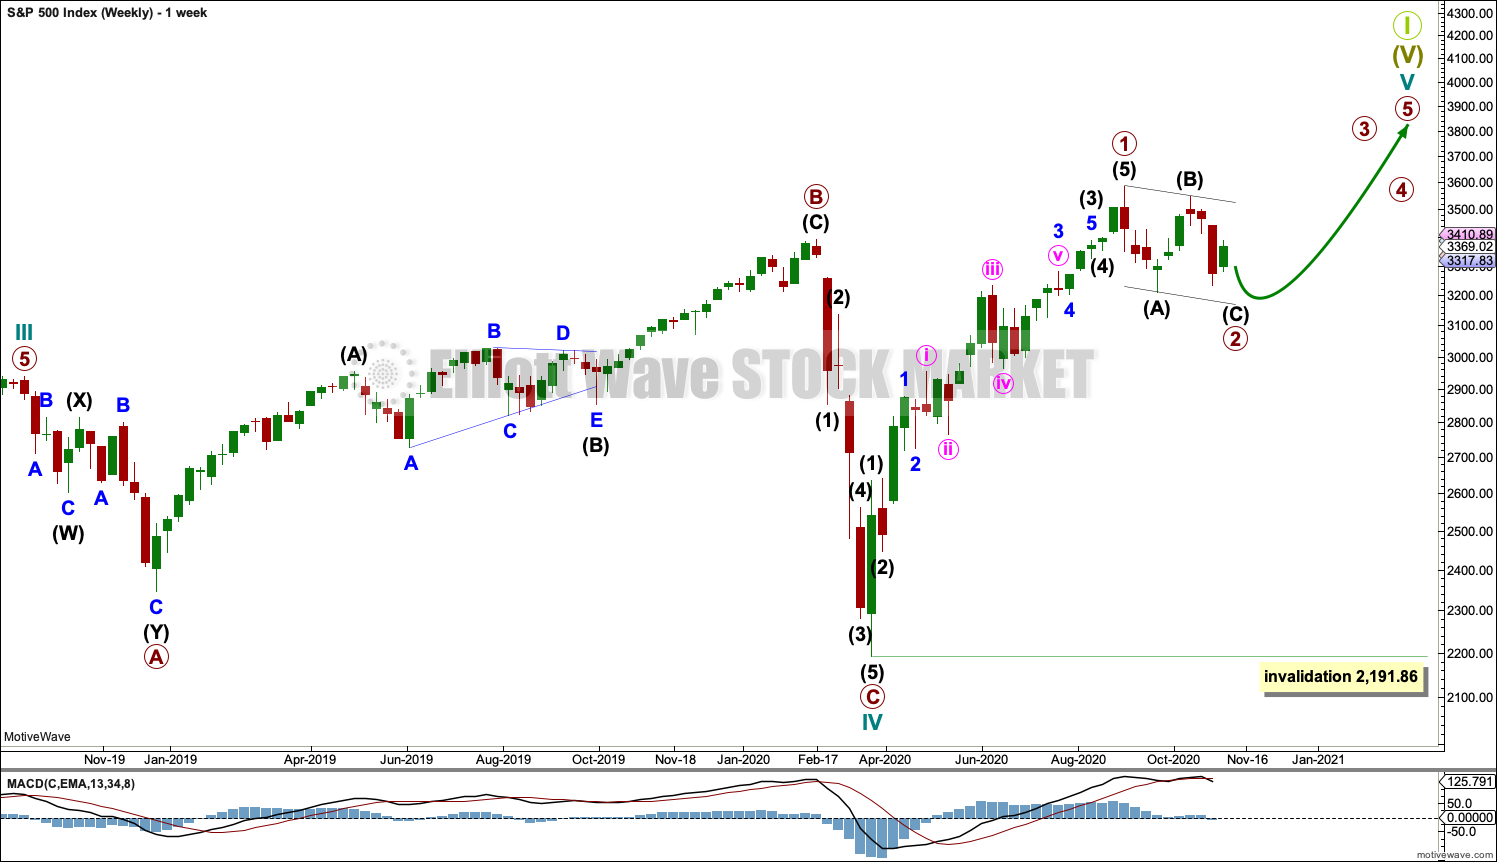
Cycle wave V may last from one to several years. So far it is in its seventh month.
Cycle wave V would most likely subdivide as an impulse. But if overlapping develops, then an ending diagonal should be considered. This chart considers the more common impulse.
Primary wave 1 may be complete. Primary wave 2 may continue a little lower to complete as a zigzag.
Primary wave 2 may not move beyond the start of primary wave 1 below 2,191.86.
There is already a Fibonacci ratio between cycle waves I and III within Super Cycle wave (V). The S&P500 often exhibits a Fibonacci ratio between two of its actionary waves but rarely between all three; it is less likely that cycle wave V would exhibit a Fibonacci ratio. The target for Super Cycle wave (V) to end would best be calculated at primary degree, but that cannot be done until all of primary waves 1, 2, 3 and 4 are complete.
DAILY CHART
Click chart to enlarge.
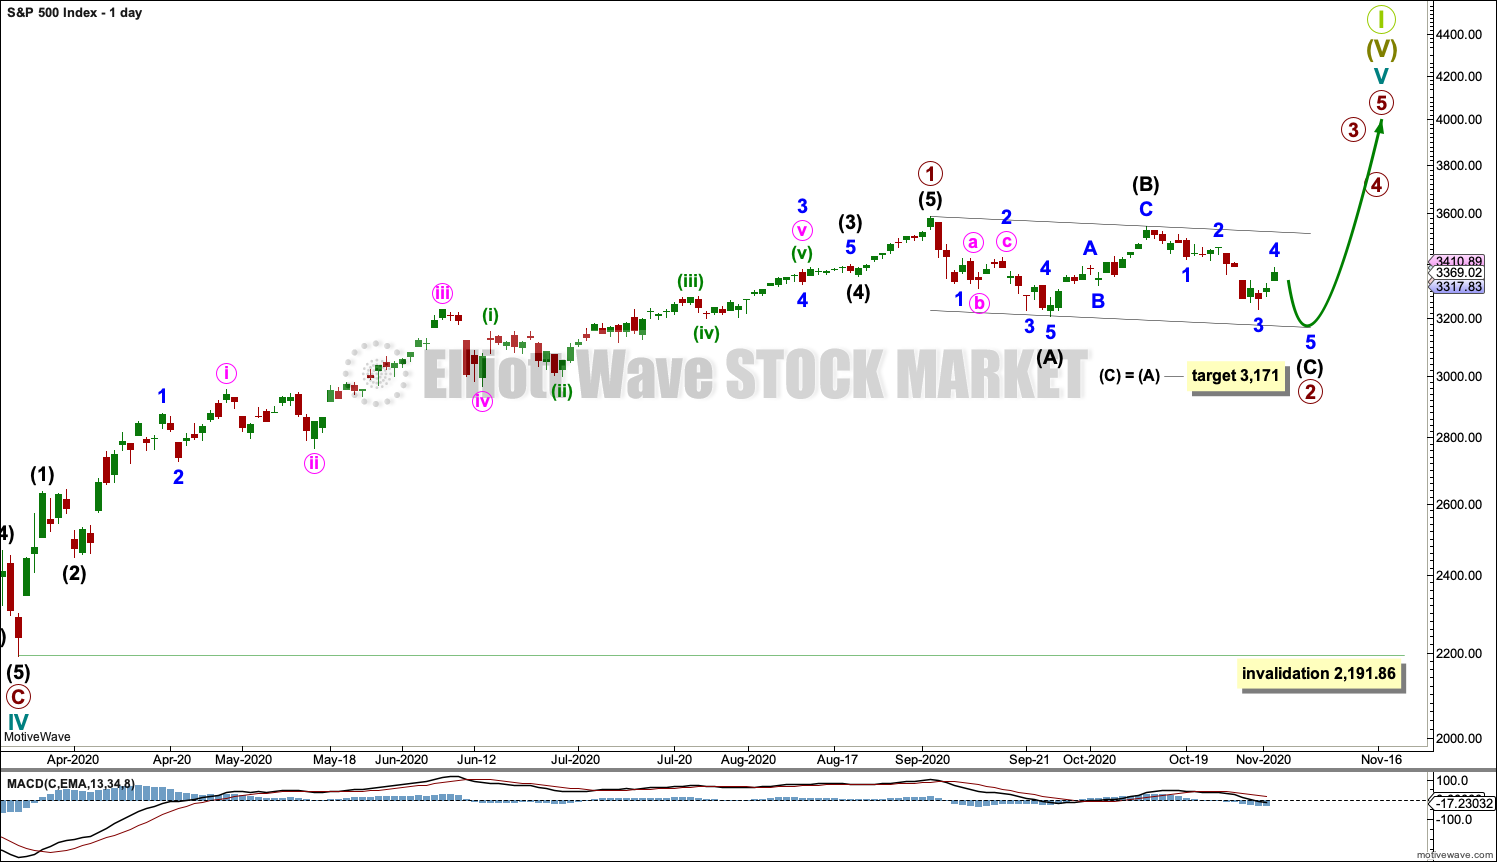
This is the new main wave count because at this stage it now has more support from classic technical analysis.
It is possible that primary wave 2 may be an incomplete zigzag. Within the flat: intermediate wave (A) subdivides as a five, intermediate wave (B) subdivides as a three, and intermediate wave (C) may be an incomplete five wave impulse.
Draw a channel about primary wave 2 using Elliott’s technique for a correction. Look for support at the lower edge of this channel. The target for intermediate wave (C) expects it to exhibit the most common Fibonacci ratio to intermediate wave (A).
If price breaches the lower edge of this Elliott channel with a full red candlestick below and not touching the lower edge of the channel, then the second alternate wave count below should be more seriously considered.
Primary wave 2 may not move beyond the start of primary wave 1 below 2,191.86.
Within intermediate wave (B) are two back to back 80% up days, on the 7th and 8th of October. This is an uncommon feature of B waves; they most commonly exhibit weakness. However, the balance of technical analysis now leans towards this main wave count.
HOURLY CHART
Click chart to enlarge.
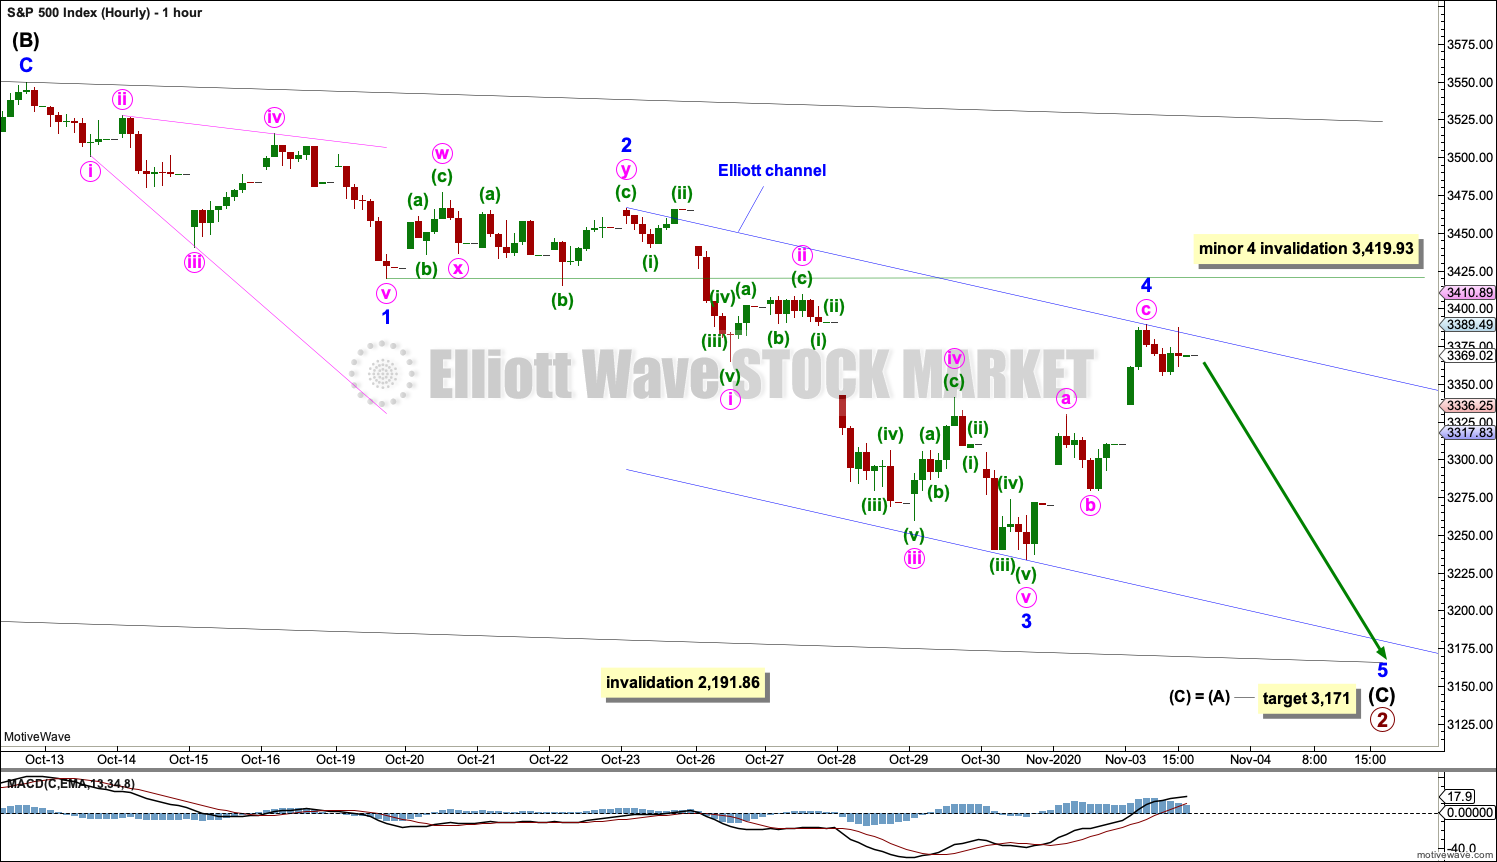
The hourly chart focusses on the five wave impulse of intermediate wave (C).
Minor waves 1 through to 4 within intermediate wave (C) may be complete. Minor wave 3 would be 15.90 points short of 1.618 times the length of minor wave 1.
If minor wave 4 continues any higher, then it may not move into minor wave 1 price territory above 3,419.93.
Minor wave 5 may be underway.
An Elliott channel drawn using Elliott’s first technique (in yesterday’s hourly charts) has been breached by upwards movement today. Fourth waves are not always contained within a channel drawn using the first technique, so Elliott developed a second technique to redraw the channel when it was breached. Draw the channel now from the ends of minor waves 2 to 4, then place a parallel copy on the end of minor wave 3. Minor wave 5 may end mid way within the new channel or about the lower edge.
The target expects intermediate wave (C) to exhibit the most common Fibonacci ratio to intermediate wave (A) and to find support at the lower edge of the black channel. As soon as price makes a new low below the end of intermediate wave (A) at 3,209.45, then intermediate wave (C) would have avoided a truncation; it may end at any time after that.
FIRST ALTERNATE WAVE COUNT
DAILY CHART
Click chart to enlarge.
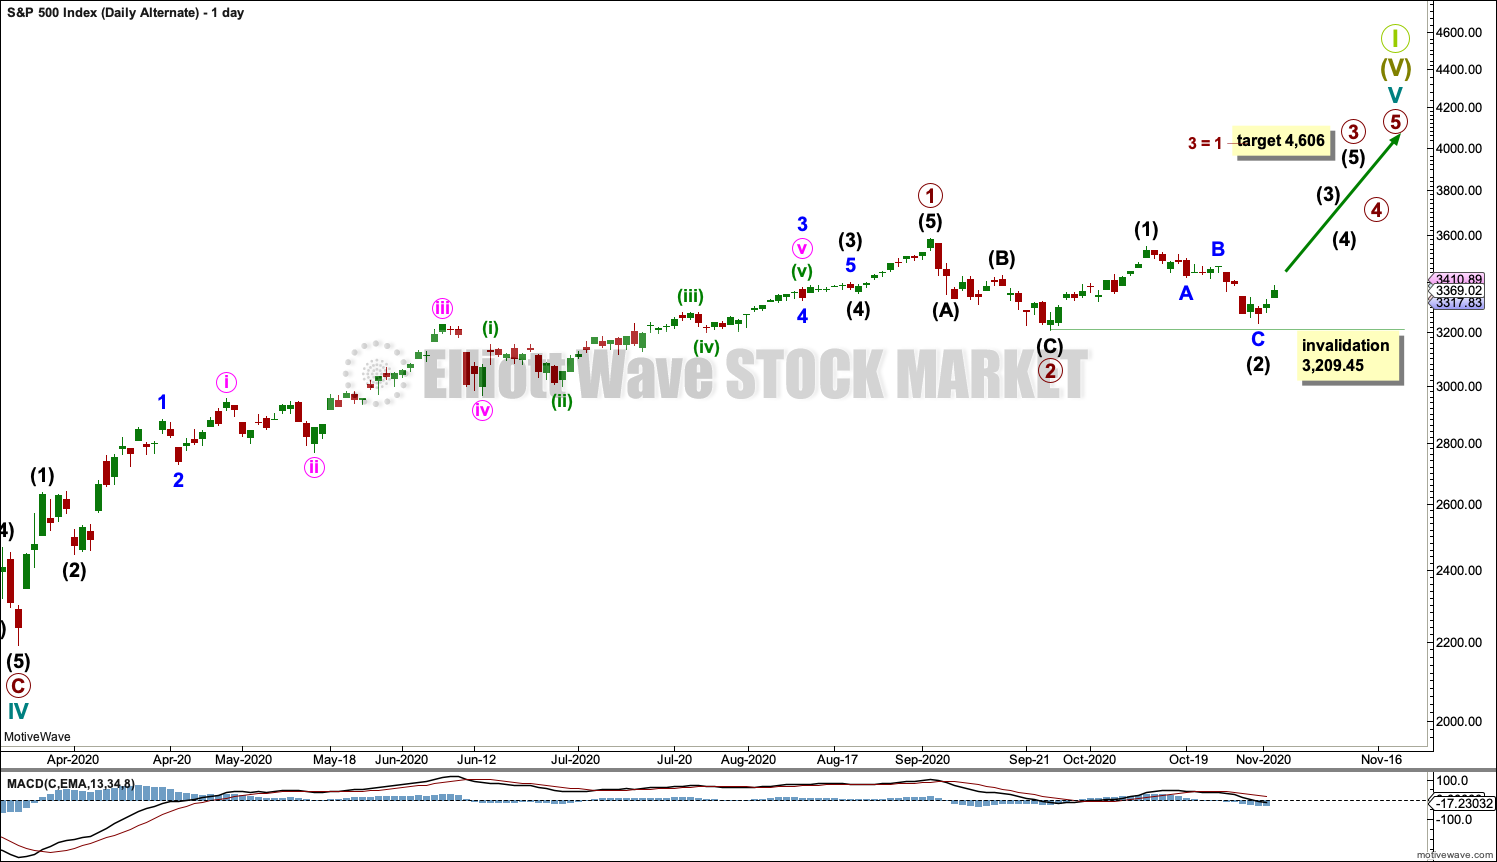
Primary waves 1 and 2 may both be complete. Primary wave 3 may now be underway.
Primary wave 3 may only subdivide as an impulse. Intermediate wave (2) within primary wave 3 may not move beyond the start of intermediate wave (1) below 3,209.45.
Primary wave 1 looks extended. The target for primary wave 3 expects it to also be extended.
HOURLY CHART
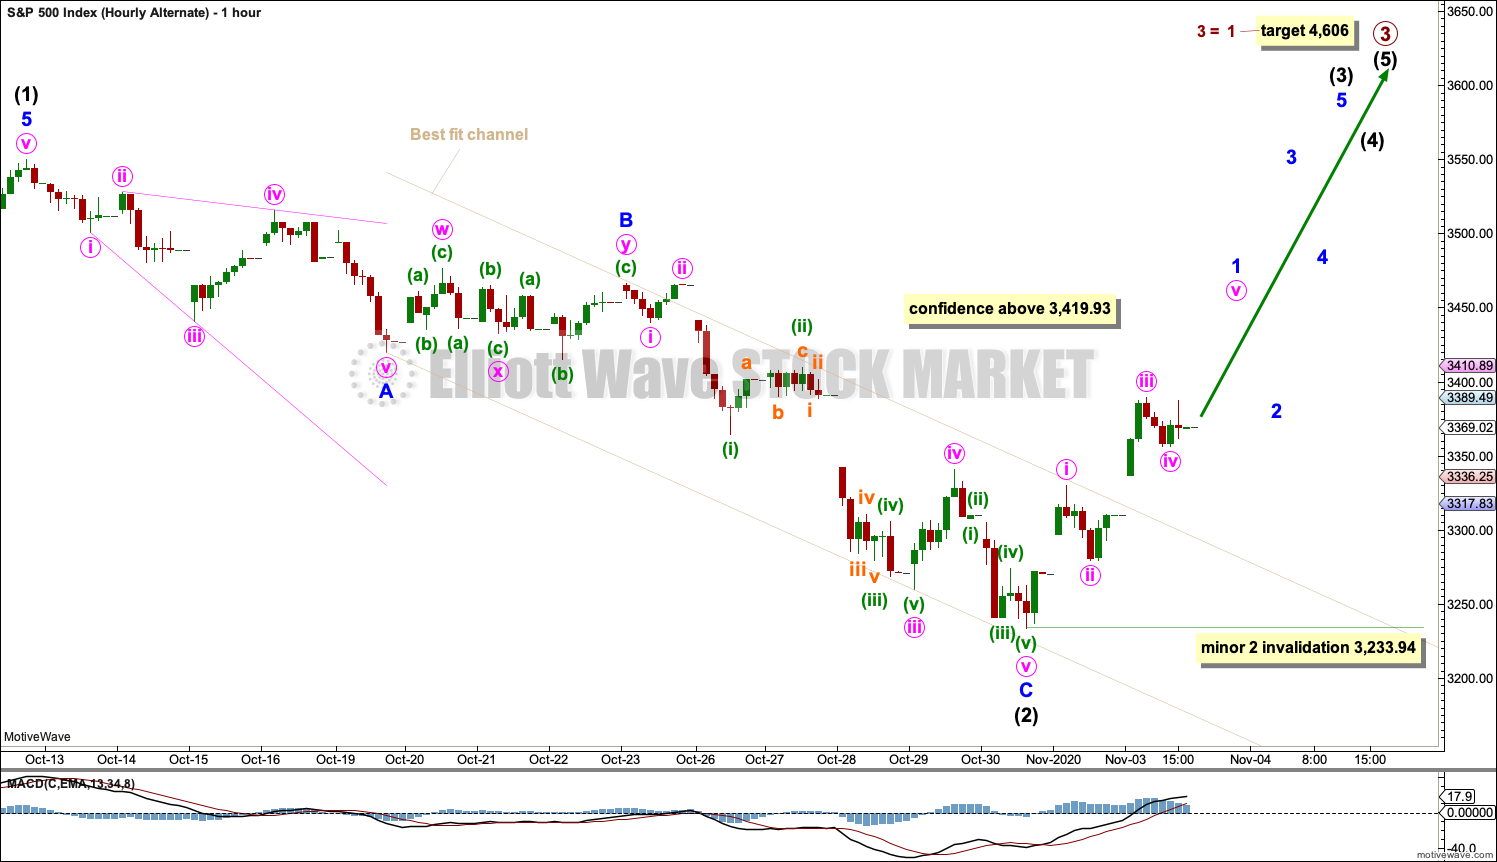
Click chart to enlarge.
Intermediate wave (2) may be complete as a single zigzag.
Intermediate wave (3) may only subdivide as an impulse. Minor wave 2 within intermediate wave (3) may not move beyond the start of minor wave 1 below 3,233.94.
For the short term, this alternate wave count now has a little support from classic technical analysis in two back to back 80% up days. It may have a close to even probability with the main wave count now.
SECOND ALTERNATE WAVE COUNT
DAILY CHART
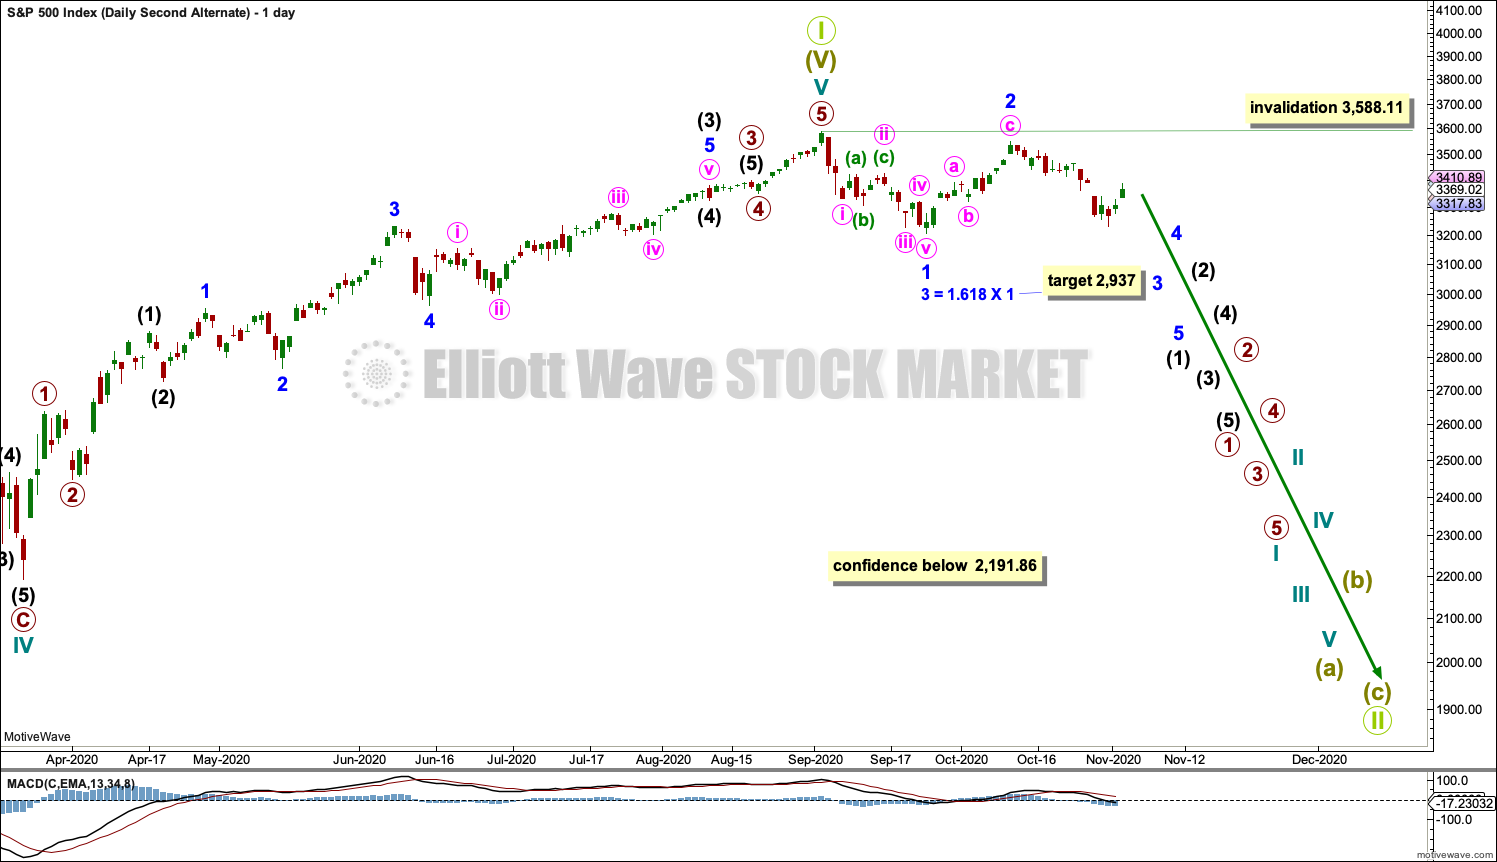
Click chart to enlarge.
This wave count is the same as the first wave count with the exception of the degree of labelling within cycle wave V. If the degree of labelling is moved up one degree, then it is possible that cycle wave V to end Super cycle wave (V) to end Grand Super Cycle wave I is complete.
A new low below 2,191.86 would add confidence in this wave count. At that stage, the first wave count would be invalidated.
A new bear market at Grand Super Cycle degree may be expected to last over a decade. It may take price below the start of Super Cycle wave (V) at 666.79 in March 2009.
A first five down, labelled minor wave 1, may be complete. Minor wave 2 now also may be complete. A third wave down at minor degree may just have begun. It should exhibit strength if this wave count is correct. So far it has not. This wave count does not have support from technical analysis.
Major new downwards trends for this market usually begin with strength. The 26th of October is a 90% down day, and the session for the 28th of October completes as an 80% downwards day; this may offer very small support to this wave count. However, recent new all time highs in both NYSE AD line and Lowry’s OCO AD line suggest this wave count has a very low probability.
The last bear market of February to March 2020 (a 35% drop in market value, meeting the technical definition of a bear market as it was over 20%) came after no bearish divergence between price and market breadth. This was the third instance of a bear market formed following zero divergence between price and market breadth; the first was in 1946 and the second was in 1976. Bear markets forming following zero divergence between price and breadth are positively correlated with being more shallow.
This very bearish wave count requires a new low below 2,191.86 for confidence.
HOURLY CHART
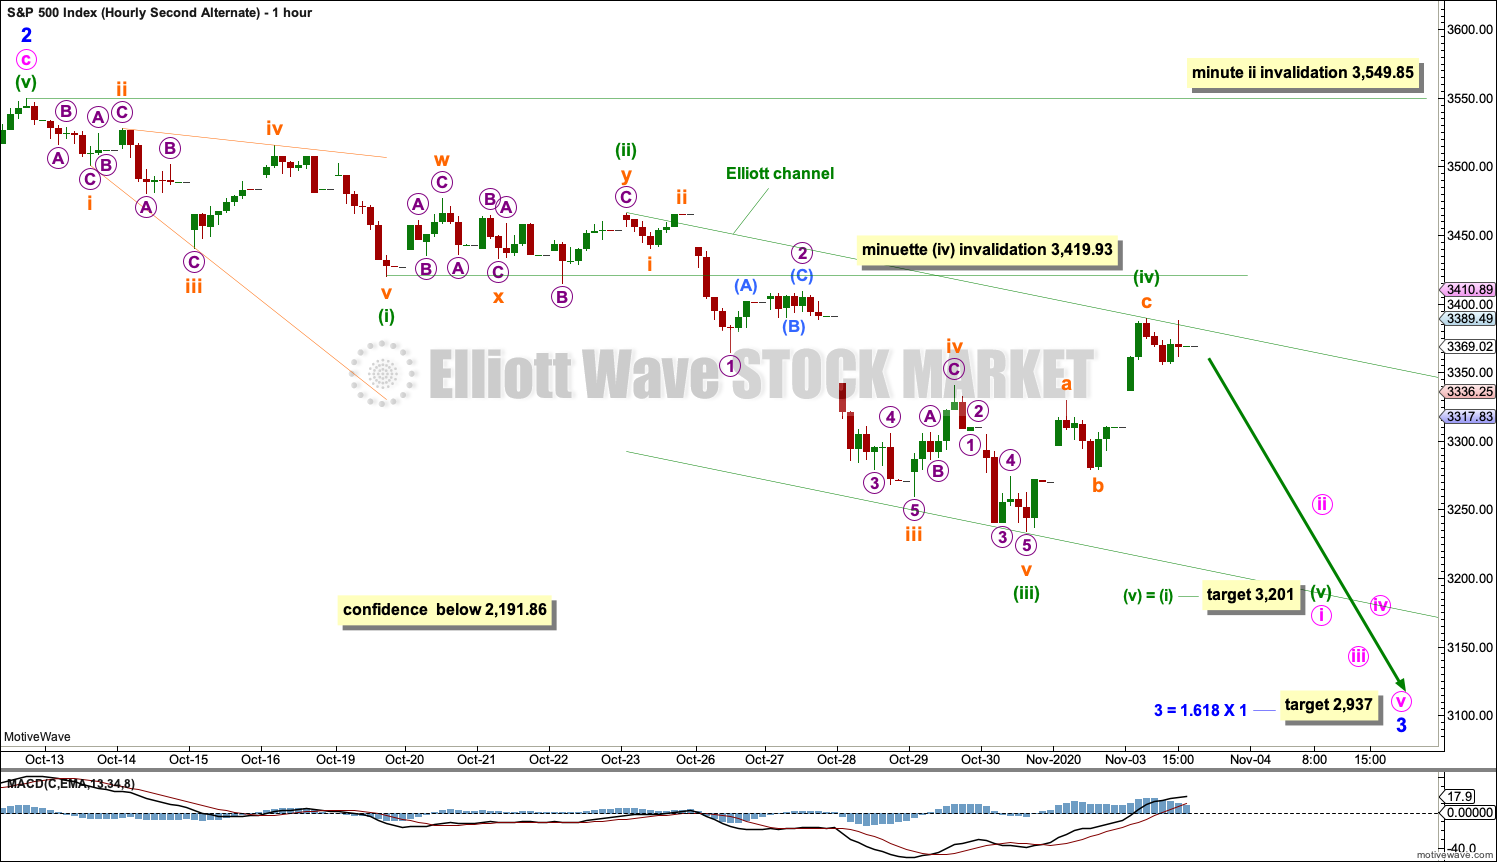
Click chart to enlarge.
Minor wave 3 downwards may be underway. Minute wave i within minor wave 3 may be an incomplete impulse. Minuette waves (i), (ii) and (iii) within minute wave I may be complete. Minuette wave (iv) may not move into minuette wave (i) price territory above 3,419.93.
If price makes a new high above 3,419.93 prior to making a new low, then minute wave i may be complete and this bounce may be minute wave ii.
When minute wave i may be a complete five wave impulse, then the invalidation point must move back up to its start at 3,549.85. A following bounce for minute wave ii may not move beyond the start of minute wave i.
TECHNICAL ANALYSIS
WEEKLY CHART
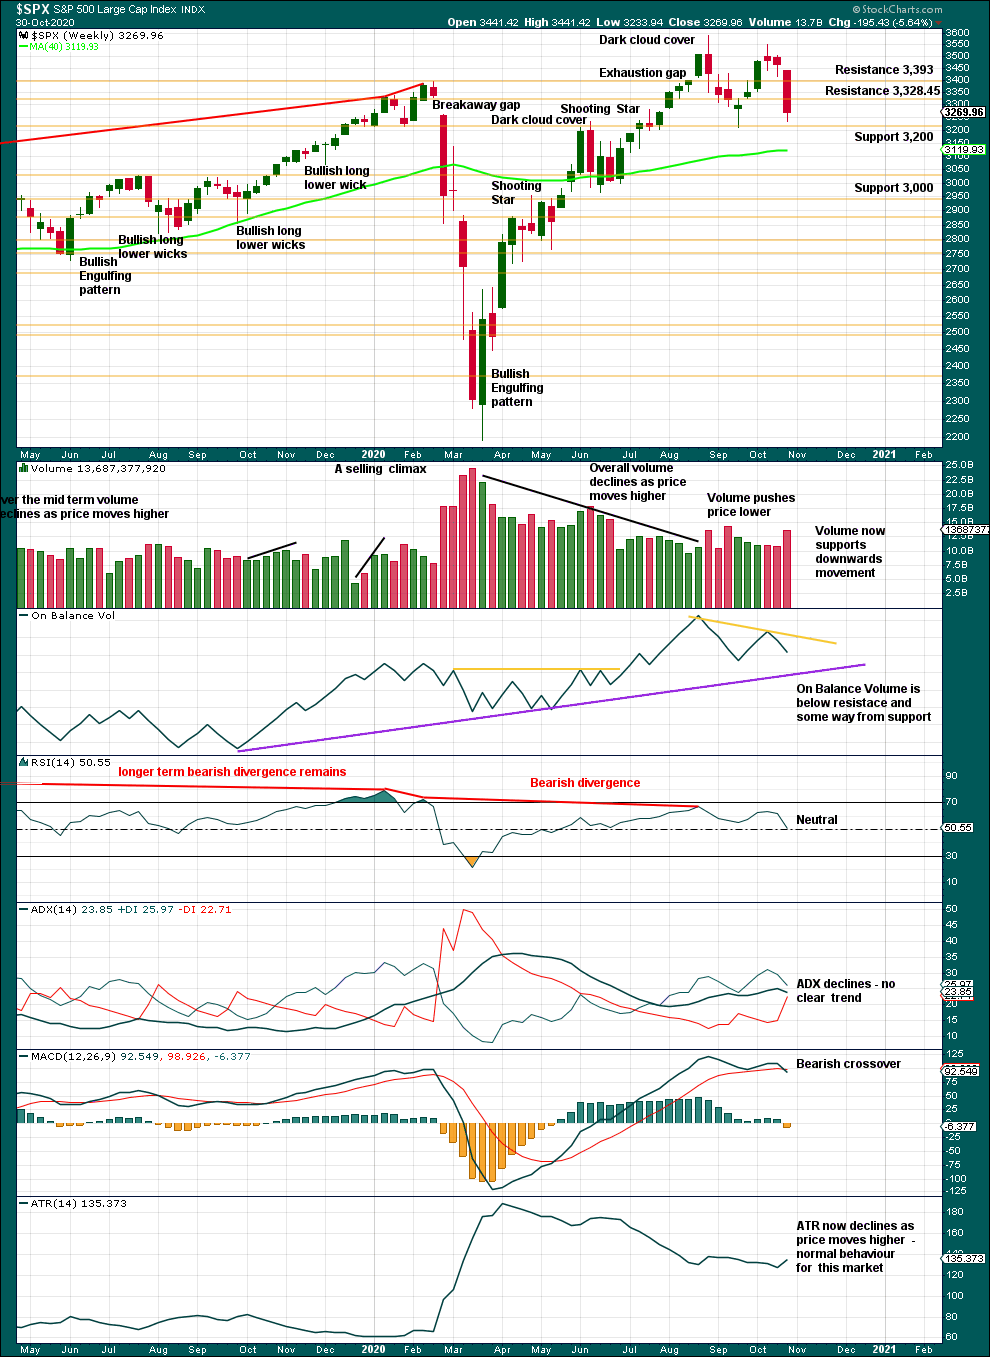
Click chart to enlarge. Chart courtesy of StockCharts.com.
A pullback may be an interruption within an upwards trend. Volume suggests more downwards movement this week, which supports the main Elliott wave count.
DAILY CHART
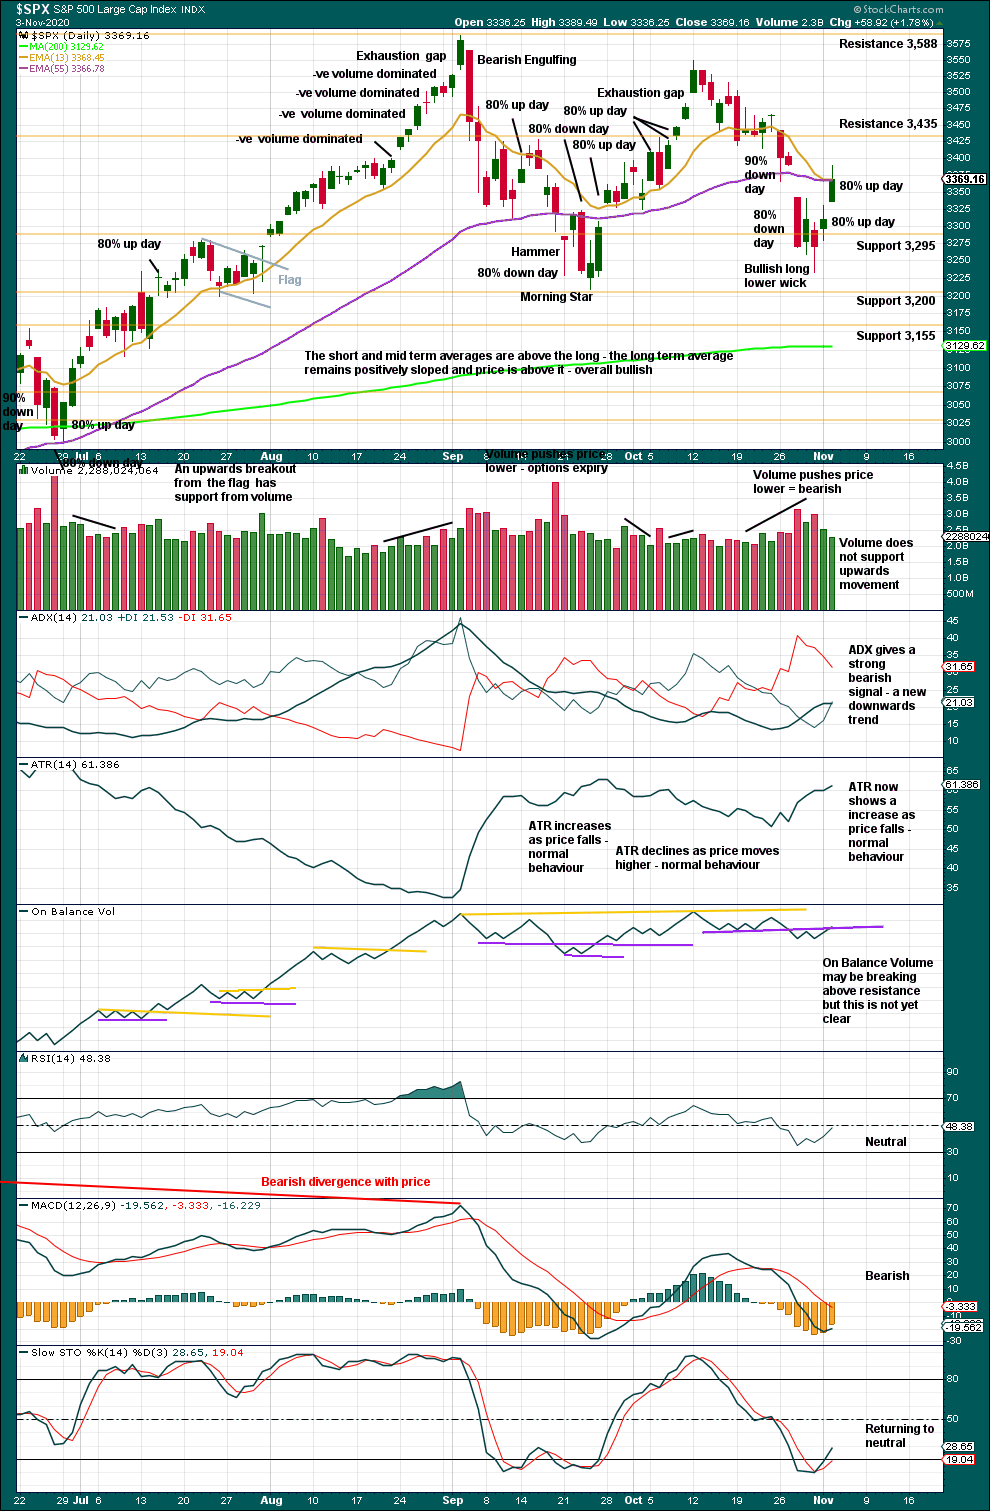
Click chart to enlarge. Chart courtesy of StockCharts.com.
This particular market commonly forms V bottoms. It will at its lows often exhibit one 90% down day or two back to back 80% down days, followed quickly (within four sessions) by one 90% up day or two back to back 80% up days.
The current set up is not perfect to indicate a V bottom because there was no 90% down day nor two back to back 80% down days within four sessions of the now two 80% up days. However, two back to back 80% up days straight after a low does indicate strength in buying power. This offers some support now to the first alternate Elliott wave count. If tomorrow closes green, then On Balance Volume may give a bullish signal, and that may be enough to tilt the balance of probability in favour of the first alternate Elliott wave count.
Commonly, selling intensifies towards the end of a bearish movement as illustrated in 90% and 80% down days.
BREADTH – AD LINE
WEEKLY CHART
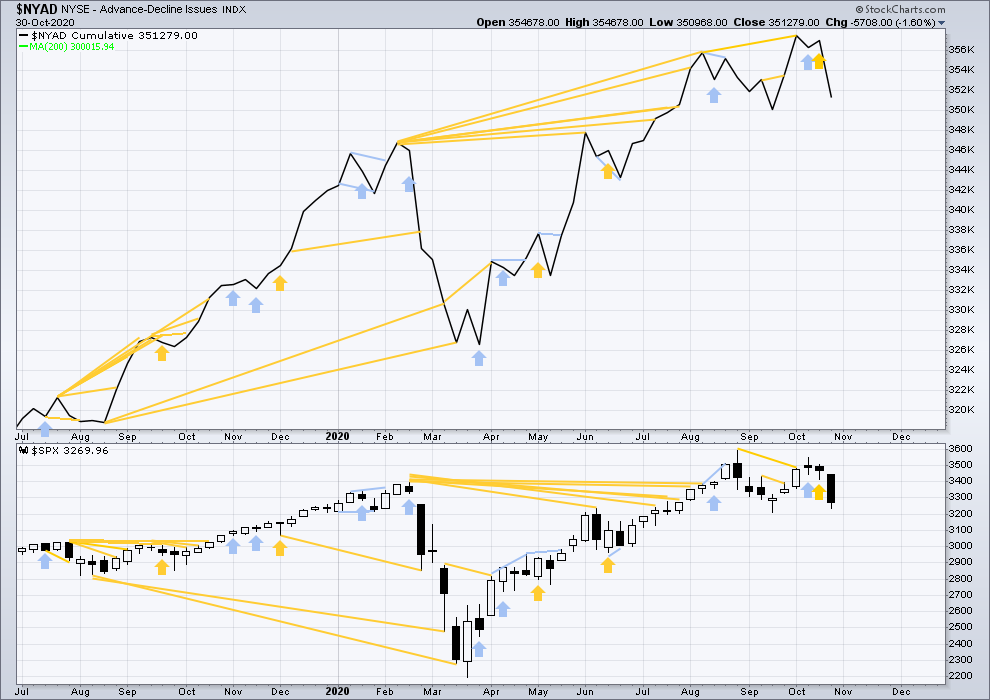
Click chart to enlarge. Chart courtesy of StockCharts.com. So that colour blind members are included, bearish signals will be noted with blue and bullish signals with yellow.
Breadth should be read as a leading indicator.
Lowry’s Operating Companies Only AD line has made a new all time high on the 12th of October. This erases prior bearish divergence with the last all time high in January 2020. With both the NYSE and OCO AD lines making new all time highs, breadth is leading price. This is a strong bullish signal and supports the first Elliott wave count.
Large caps all time high: 3,588.11 on September 2, 2020.
Mid caps all time high: 2,109.43 on February 20, 2020.
Small caps all time high: 1,100.58 on August 27, 2018.
Last week both price and the AD line have moved lower. Neither has made new lows below the prior low of the 21st of September. There is no new divergence.
DAILY CHART
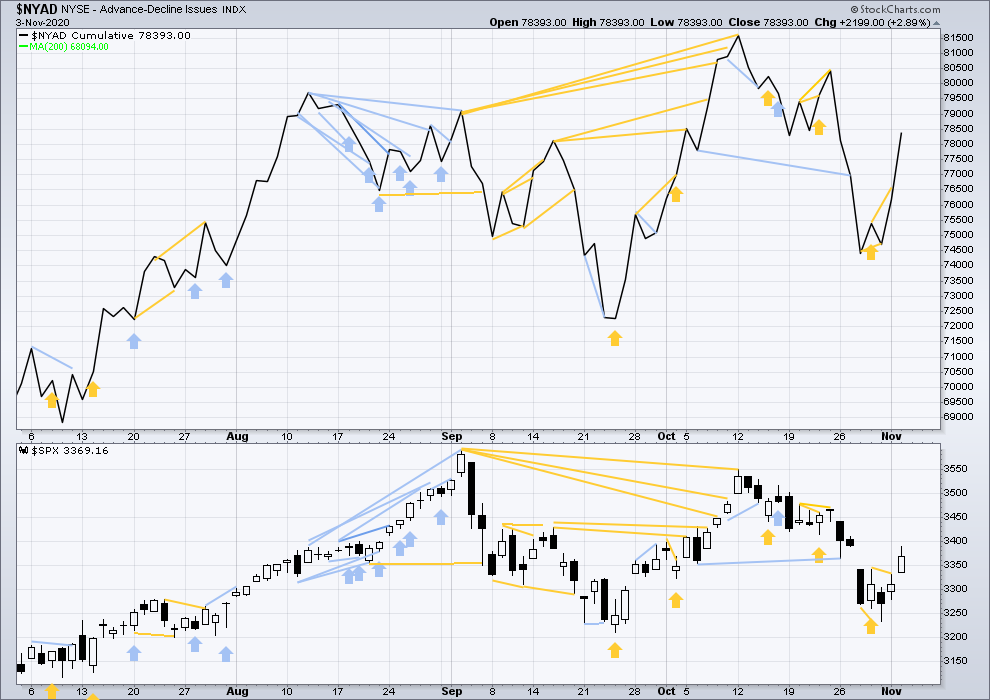
Click chart to enlarge. Chart courtesy of StockCharts.com. So that colour blind members are included, bearish signals will be noted with blue and bullish signals with yellow.
Following short-term bullish divergence yesterday, today price and the AD line have moved higher. There is no new short-term divergence.
VOLATILITY – INVERTED VIX CHART
WEEKLY CHART
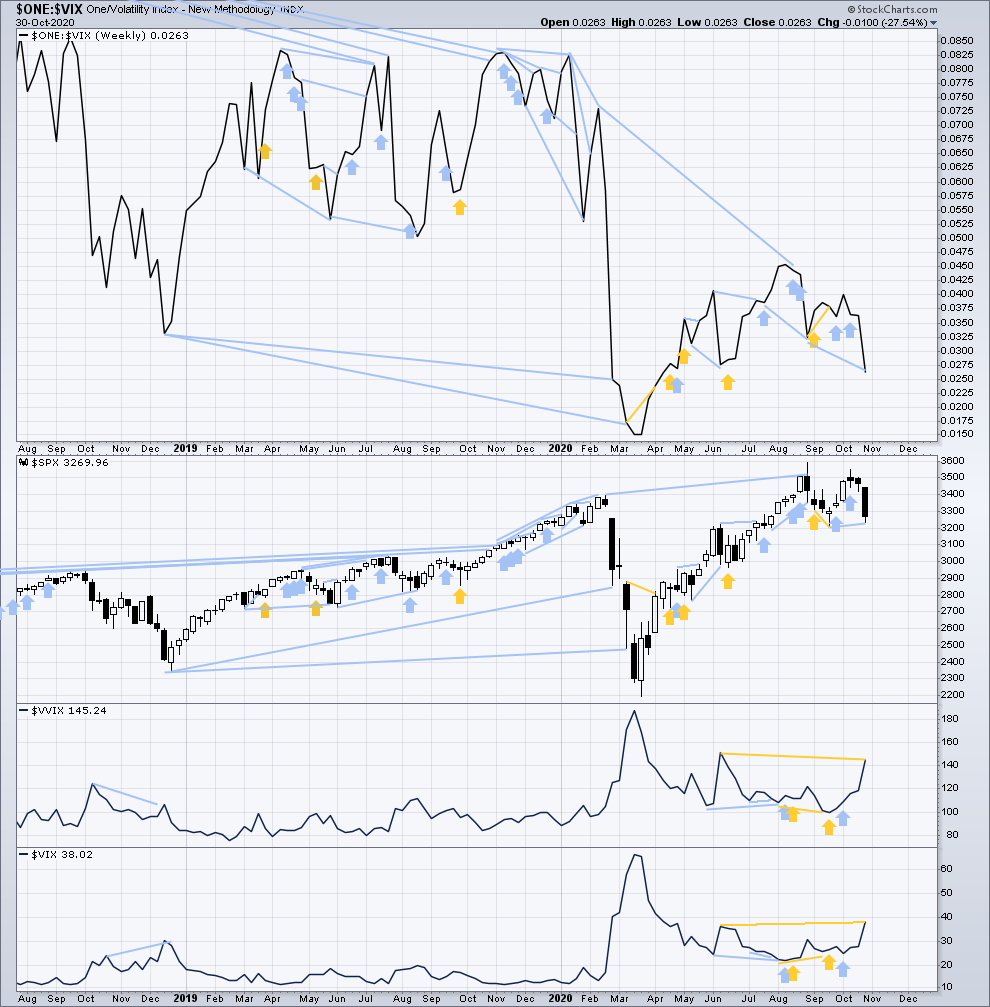
Click chart to enlarge. Chart courtesy of StockCharts.com. So that colour blind members are included, bearish signals will be noted with blue and bullish signals with yellow.
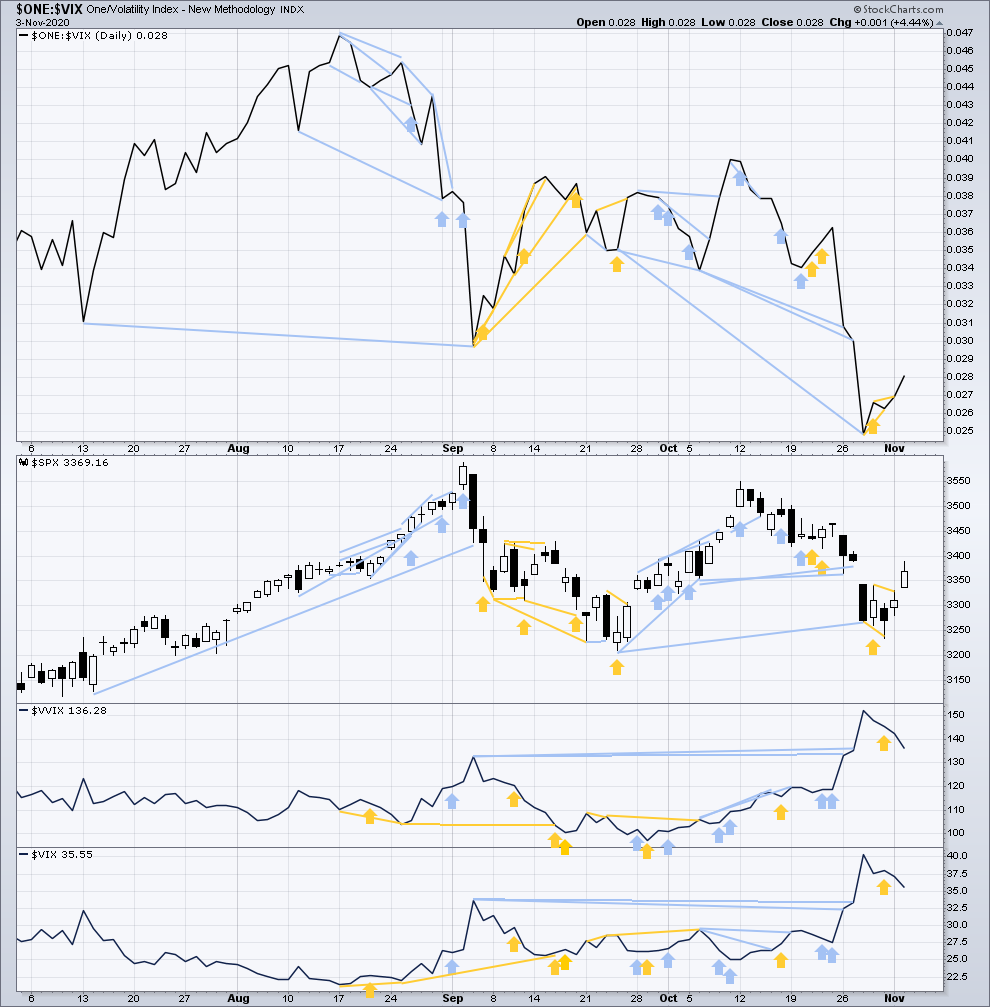
Inverted VIX remains well below all time highs. The all time high for inverted VIX was in the week beginning October 30, 2017. There is nearly 3 years of bearish divergence between price and inverted VIX. There is all of long, mid and short-term bearish divergence. This supports the second alternate Elliott wave count.
Last week price and inverted VIX have moved lower. Inverted VIX has made a new swing low, but price has not. This divergence is bearish and supports the main Elliott wave count.
Comparing VIX and VVIX: Last week both VIX and VVIX have moved higher. VIX has made a new high above the prior high of the 8th of June, but VVIX has not. This divergence is bullish for price and may support either the main or first alternate Elliott wave counts.
DAILY CHART
Click chart to enlarge. Chart courtesy of StockCharts.com. So that colour blind members are included, bearish signals will be noted with blue and bullish signals with yellow.
Following short-term bullish divergence yesterday, today price and inverted VIX have moved higher. There is no new short-term divergence.
Comparing VIX and VVIX at the daily chart level: Today both VIX and VVIX have moved lower. There is no new divergence.
DOW THEORY
Dow Theory still concludes a bear market is in place.
Dow Theory confirmed a bear market with the following lows made on a closing basis:
DJIA: 21,712.53 – a close below this point was been made on the March 12, 2020.
DJT: 8,636.79 – a close below this point was been made on March 9, 2020.
Adding in the S&P and Nasdaq for an extended Dow Theory, a bear market was confirmed:
S&P500: 2,346.58 – a close below this point was made on March 20, 2020.
Nasdaq: 7,292.22 – a close below this point was made on the March 12, 2020.
At this time, to shift Dow Theory from viewing a bear market to confirmation of a new bull market would require new highs made on a closing basis:
DJIA: 29,568.57
DJT: 11,623.58 – closed above on 7th October 2020.
Adding in the S&P and Nasdaq for an extended Dow Theory, confirmation of a bull market would require new highs made on a closing basis:
S&P500: 3,393.52 – closed above on 21st August 2020.
Nasdaq: 9,838.37 – closed above on June 8, 2020.
Published @ 06:58 p.m. ET.
—
Careful risk management protects your trading account(s).
Follow my two Golden Rules:
1. Always trade with stops.
2. Risk only 1-5% of equity on any one trade.
—
New updates to this analysis are in bold.