by Lara | Dec 4, 2020 | S&P 500, S&P 500 + DJIA
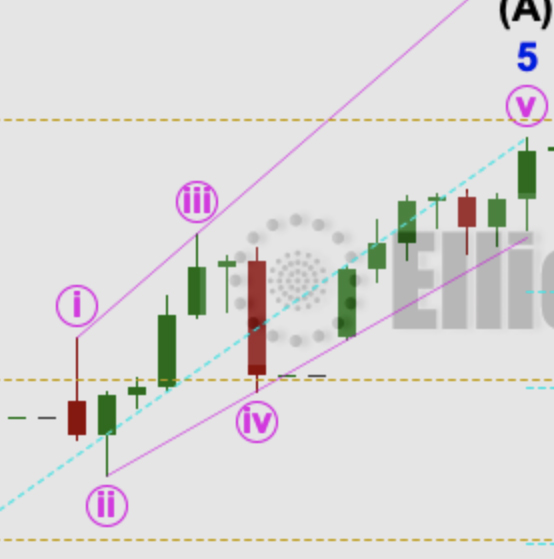
S&P 500: Elliott Wave and Technical Analysis | Charts – December 4, 2020 An expected short-term pullback did not happen. The larger picture expected more upwards movement, which is how the week ended. Summary: The wave count expects the low of the 30th of October...
by Lara | Oct 23, 2013 | S&P 500, S&P 500 + DJIA |
Wednesday’s session saw price move lower and complete as a red candlestick, which is what was expected. The wave count remains the same. Click on the charts below to enlarge. Intermediate wave (4) lasted 14 days, just one more than a Fibonacci 13. If...


