
Wednesday’s session saw price move lower and complete as a red candlestick, which is what was expected.
The wave count remains the same.
Click on the charts below to enlarge.
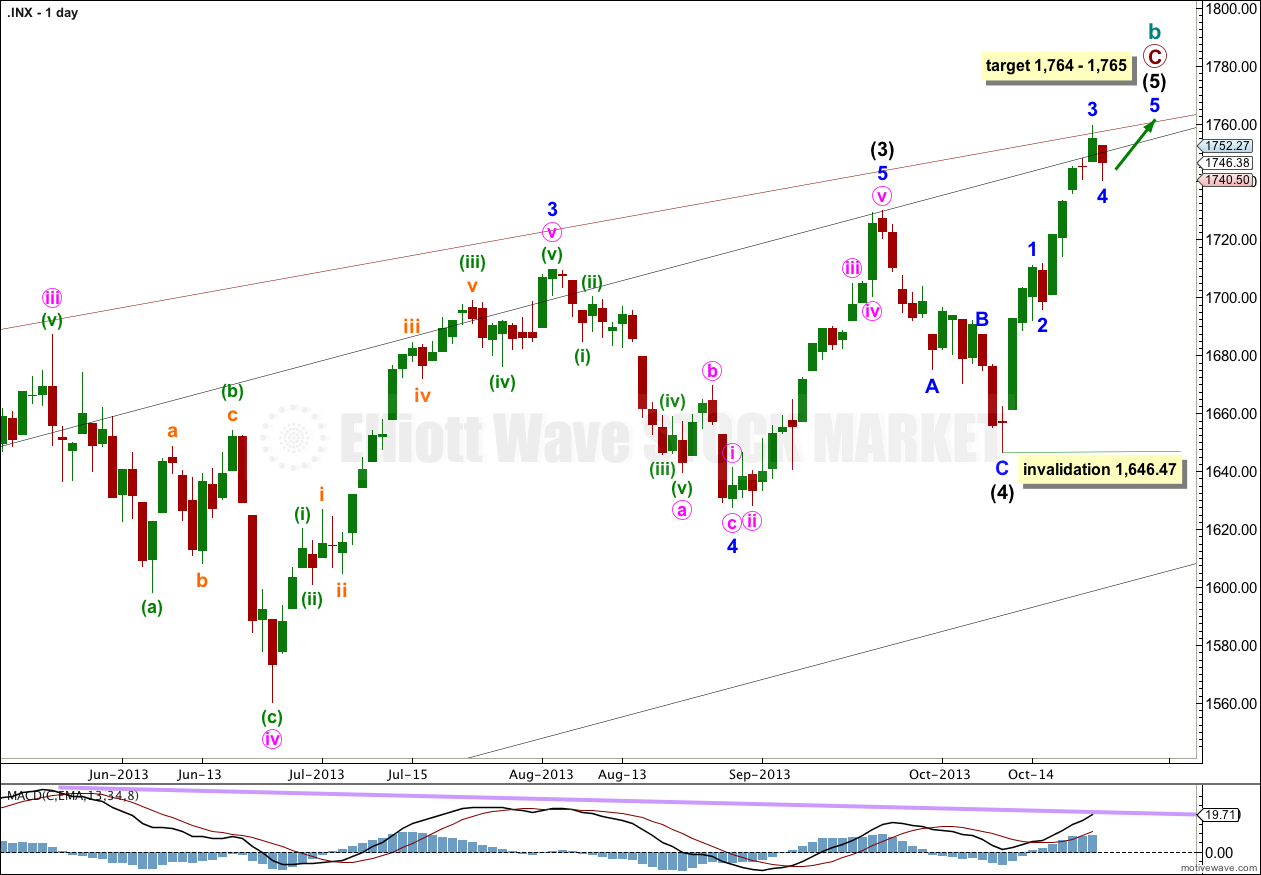
Intermediate wave (4) lasted 14 days, just one more than a Fibonacci 13.
If intermediate wave (5) exhibits a Fibonacci time relationship it may end in a Fibonacci 13 days (or sessions) on 28th October. Please note: this is a rough guideline only. Within this wave count there are few Fibonacci time relationships at primary or intermediate degree. Sometimes this happens, but not often enough to be reliable.
October is a common month for big trend changes with the S&P 500. This wave count could very well complete the structure for intermediate wave (5) this month, and maybe even this week.
Within primary wave C intermediate wave (3) was just 0.76 points longer than 2.618 the length of intermediate wave (1).
Ratios within intermediate wave (3) are: minor wave 3 was 16.23 points longer than 1.618 the length of minor wave 1, and minor wave 5 was just 2.14 points short of 0.236 the length of minor wave 3.
Ratios within minor wave 3 are: minute wave iii was just 7.66 points longer than 1.618 the length of minute wave i, and minute wave v has no Fibonacci ratio to either of minute waves iii or i.
At 1,764 primary wave C would reach equality with primary wave A. If price continues through this first target then the next target would be at 1,781 where intermediate wave (5) would reach 0.236 the length of intermediate wave (3).
Within intermediate wave (5) no second wave correction may move beyond the start of the first wave. This wave count is invalidated with movement below 1,646.47.
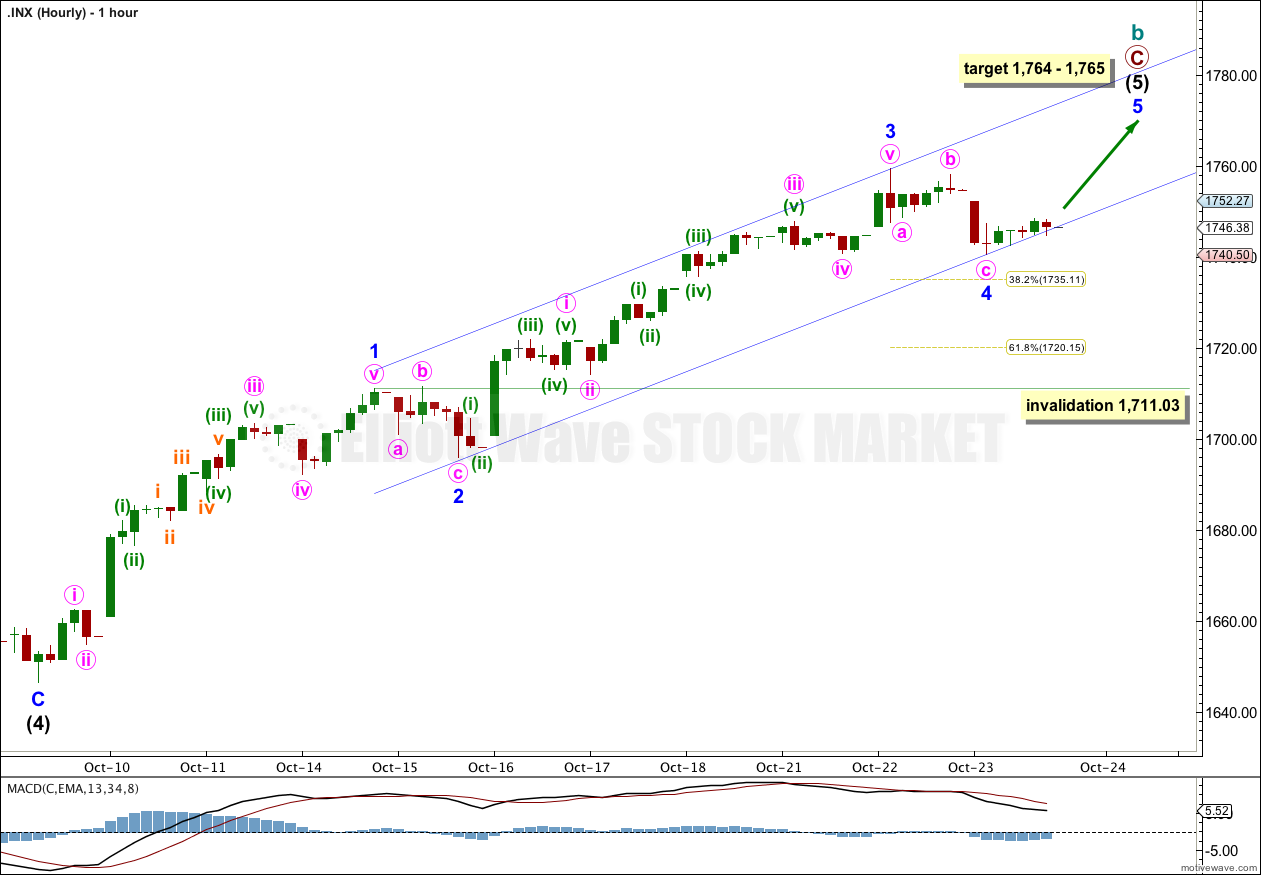
Minor wave 4 is now very likely to be complete. If minor wave 5 lasts three days then intermediate wave (5) would complete in a Fibonacci 13 days (or sessions).
Within minor wave 4 showing up on the daily chart this impulsive structure for intermediate wave (5) has a very typical look.
Importantly, within intermediate wave (5) minor wave 3 is very slightly shorter than minor wave 1. This limits minor wave 5 to no longer than equality with minor wave 3. If minor wave 5 begins at 1,740.50 this limit is at 1,803.90.
At 1,765 minor wave 5 would reach 0.382 the length of minor waves 1 and 3. Minor wave 5 should show a decrease in momentum from that seen for minor wave 3.
I have redrawn the parallel channel about intermediate wave (5) impulse because the fourth wave overshot the previously drawn channel. Draw this channel first with a trend line from the lows of minor waves 2 to 4, then place a parallel copy upon the high of minor wave 3. I would expect minor wave 5 to most likely end mid way within this channel, or slightly less likely to find resistance at the upper edge.
If minor wave 4 were to continue further as a double (unlikely but possible) then it may not move into minor wave 1 price territory. This wave count is invalidated with movement below 1,711.03.
Here We Go: SocGen Warns There Is “Possibility” Fed May Hike QE Next Week http://www.zerohedge.com/news/2013-10-24/here-we-go-socgen-warns-there-possibility-fed-may-hike-qe-next-week
Yep. The whole mess has “giant bubble” written all over it.
Something’s wrong here…
Lara,
With the DJIA……….Is it possible that what you have labelled intermediate wave 3 is actually intermediate wave 5 and the DOW has topped already ?
This would mean the DOW is currently nearing the end of a minuette wave 2 in the first impulse down………….which would tie-in well with the S&P analysis.
Many thanks
Craig
Yes, that is entirely possible. The downwards wave I have labeled intermediate wave (4) for the Dow on the daily chart can actually be counted as an impulse. It is ambiguous.
It could also have a truncated fifth wave.
Although, if you “squish” the daily chart up to show all bars from the start of primary wave C at 10,404.49 on 4th Oct, 2011, then you will see a series of big obvious first and second waves at the start, and now we have a corresponding series of big obvious fourth wave corrections at the end. The structure of primary wave C strongly suggests a final fifth wave is necessary to complete it.
Dear Karen,
My first question regards your SPX and DJIA analysis. You state the SPX could complete its structure any day now. However, the DJIA forecast requires quite a bit more upside movement. I am suspicious that they both cannot be correct. Any insight is appreciated. Thanks.
My second question is this: For a couple of years we have been looking for the top of this bull market off the 2009 low. Several times the structure was complete followed by a break in the trendlines as first confirmation the top was in. Each time, however, that conclusion was wrong and we continued upward to a significant degree. Throughout all of that, we remembered “The trend remains the same until proven otherwise.” What do you think is going to make this time different?
Thanks for all your great analysis and beautiful banners of New Zealand.
Rodney Mruk
Your first question; since 11th October the DJIA wave count is almost identical to the S&P. I expect both to be near completion.
Your second question: you are absolutely right, I should remember “the trend remains the same, until proven otherwise”.
We are getting to the crux of the difference between the main monthly wave count and the bullish alternate. For this main monthly wave count this has to be it for cycle wave b. Cycle wave b is already at 126% the length of cycle wave a, and within cycle wave b the structure for primary wave C subdivides so perfectly as a completed impulse. For the wave count to have a good probability (for cycle wave b to remain below 138% of cycle wave a) and for primary wave C to have a typical look, the “right look”, it has to end with this impulse ending.
My first confirmation point will be 1,646.47. While price remains above that point my main wave count will expect more upwards movement, I will retain the mantra “the trend remains the same until proven otherwise”.
When price breaches 1,646.47 then the main wave count will be analysed right alongside the bullish alternate. The main wave count would expect cycle wave c has begun, the bullish alternate would expect downwards movement to be a fourth wave correction. The point of differentiation would be at 1,370.58.
Eventually if price breaches 1,370.58 then there would be only one wave count which would expect a big market crash is underway.
Thanks Rodney, most excellent questions.
Thanks Lara. And I am sorry for calling you Karen. I am learning as I age that brain lapses do come!
NYMO 10+ YEARS 1st TRUE ‘Breadth Thrust’ on 10-18-2013 http://scharts.co/1cYWT18
[From -63.09% to +64.35% 9 days]
Definition of ‘Breadth Thrust Indicator’
A technical indicator used to ascertain market momentum. The breadth thrust indicator is computed by calculating the number of advancing issues on an exchange such as the NYSE divided by the total number of issues (advancing + declining) on it, and generating a 10-day moving average of this percentage. The indicator signals the start of a potential new bull market when it moves from a level of below 40% (indicating an oversold market) to above 61.5% within any 10-day period, a sentiment shift that occurs only rarely.
I would think we have a LOT more upside and could this current wave from 1646.47 just be Wave 1??