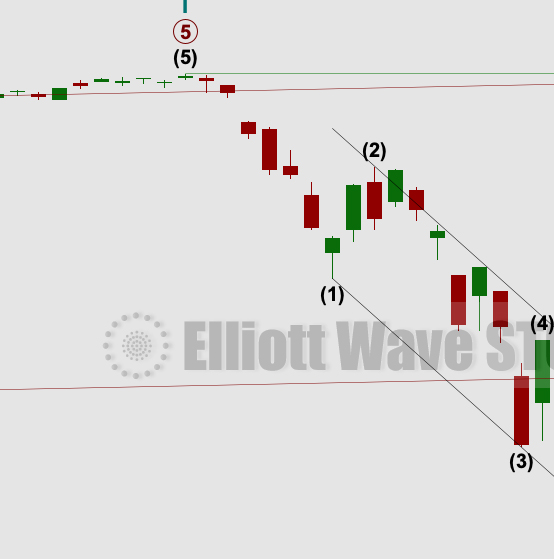
by Lara | Jan 25, 2021 | S&P 500, S&P 500 + DJIA
S&P 500: Elliott Wave and Technical Analysis | Charts – January 25, 2021 A target for a pullback to end was at 3,819. The low for Monday was at 3,797.16. Thereafter, the session ended with a strong bounce. Summary: The wave count expects the low of the 30th of...

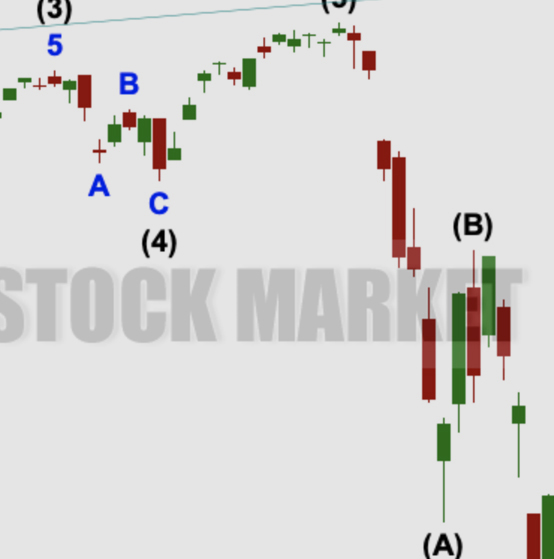
by Lara | Jan 5, 2021 | S&P 500, S&P 500 + DJIA
S&P 500: Elliott Wave and Technical Analysis | Charts – January 5, 2021 Four daily charts are presented today to consider various possibilities. They are ranked in order of probability. Summary: The wave count expects the low of the 30th of October to not be...

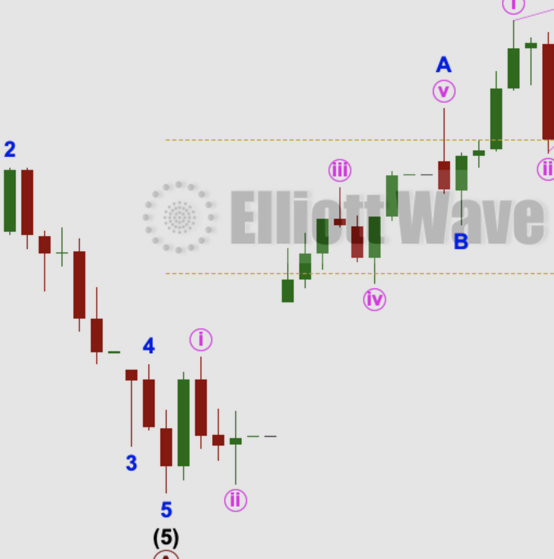
by Lara | Dec 29, 2020 | S&P 500, S&P 500 + DJIA
S&P 500: Elliott Wave and Technical Analysis | Charts – December 29, 2020 A higher high and a higher low complete another upwards session. However, a strong close lower completes a bearish candlestick pattern. Summary: The wave count expects the low of the 30th...

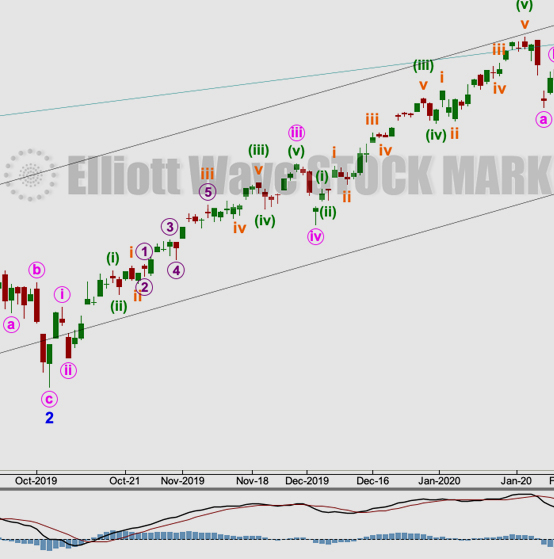
by Lara | Dec 9, 2020 | S&P 500, S&P 500 + DJIA
S&P 500: Elliott Wave and Technical Analysis | Charts – December 9, 2020 A little downwards movement was expected. Price has remained above the short-term invalidation point. Summary: The wave count expects the low of the 30th of October to not be breached for...

by Lara | Dec 3, 2020 | S&P 500, S&P 500 + DJIA
S&P 500: Elliott Wave and Technical Analysis | Charts – December 3, 2020 Another new all time high today has support again from a corresponding high in the AD line. The Elliott wave count remains mostly the same. Only the very short-term count has a change....

by Lara | Nov 16, 2020 | S&P 500, S&P 500 + DJIA
S&P 500: Elliott Wave and Technical Analysis | Charts – November 16, 2020 Upwards movement continues as the main short and long-term Elliott wave counts expect. Today all of On Balance Volume, ADX, the AD line and, for the short term, VIX support the main Elliott...

by Lara | Nov 10, 2020 | S&P 500, S&P 500 + DJIA
S&P 500: Elliott Wave and Technical Analysis | Charts – November 10, 2020 A small downwards day sees price remain above the short-term invalidation point. Two short-term hourly charts are included in today’s analysis. Summary: The main wave count expects a...

by Lara | Oct 22, 2020 | S&P 500, S&P 500 + DJIA
S&P 500: Elliott Wave and Technical Analysis | Charts – October 22, 2020 For the very short term, a little more downwards movement to a target at 3,418 was expected before a reversal and upwards movement. Today the session began with downwards movement to a low...

by Lara | Oct 16, 2020 | S&P 500, S&P 500 + DJIA
S&P 500: Elliott Wave and Technical Analysis | Charts – October 16, 2020 An upwards week closes as a red doji candlestick. The short-term invalidation point is moved higher this week. Summary: The invalidation point is moved up to 3,209.45. For the very short...


