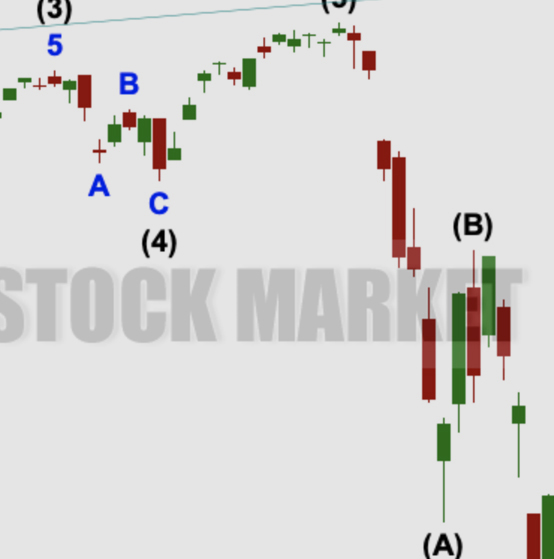
by Lara | May 20, 2021 | S&P 500, S&P 500 + DJIA
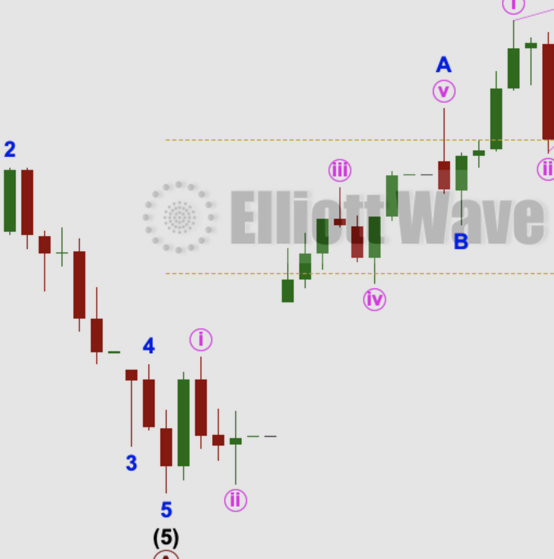
S&P 500: Elliott Wave and Technical Analysis | Charts – May 20, 2021 Yesterday’s analysis expected upwards movement to resume, which is exactly what has happened. The main Elliott wave count still has a higher probability than the alternate Elliott wave...
by Lara | May 18, 2021 | S&P 500, S&P 500 + DJIA
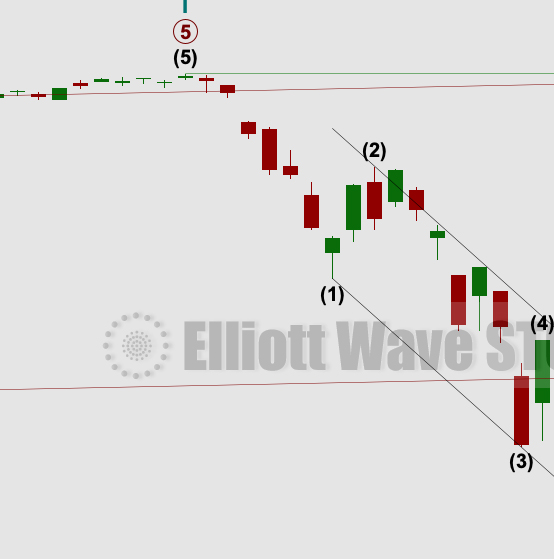
S&P 500: Elliott Wave and Technical Analysis | Charts – May 18, 2021 Today ended with strong downwards movement at the end of the session. A cluster of signals from the AD line remains in support of the main Elliott wave count, which still has a higher...
by Lara | Apr 23, 2021 | S&P 500, S&P 500 + DJIA
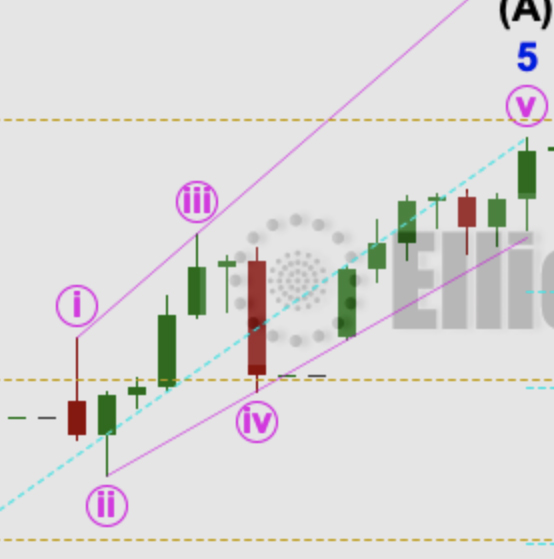
S&P 500: Elliott Wave and Technical Analysis | Charts – April 23, 2021 This week a short-term correction may have begun. The first Elliott wave count remains essentially the same. Summary: The wave count expects a third wave at three large degrees may have moved...
by Lara | Apr 21, 2021 | S&P 500, S&P 500 + DJIA
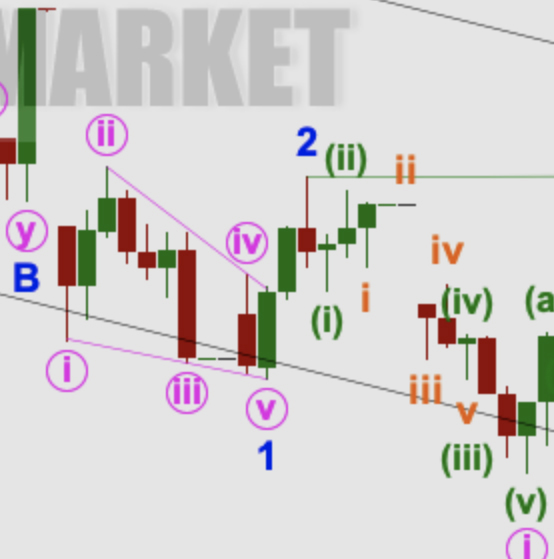
S&P 500: Elliott Wave and Technical Analysis | Charts – April 21, 2021 Upwards movement has not made a new all time high. Two short-term Elliott wave counts are used today. Summary: The wave count expects a third wave at three large degrees may have moved through...
by Lara | Mar 16, 2021 | S&P 500, S&P 500 + DJIA
S&P 500: Elliott Wave and Technical Analysis | Charts – March 16, 2021 A little more upwards movement today with a session that closed red overall fits the expectations for the Elliott wave count, but a small decline in breadth and an increase in VVIX suggest...
by Lara | Mar 12, 2021 | S&P 500, S&P 500 + DJIA
S&P 500: Elliott Wave and Technical Analysis | Charts – March 12, 2021 Upwards movement this week fits expectations for the Elliott wave counts. Summary: The pullback may now be complete; the alternate hourly wave count, which looks at the possibility of the...
by Lara | Feb 19, 2021 | S&P 500, S&P 500 + DJIA
S&P 500: Elliott Wave and Technical Analysis | Charts – February 19, 2021 A small range upwards week closes red. Overall, price continues to move higher towards targets, with normal corrections along the way. Summary: The current pullback is still expected to be...
by Lara | Feb 17, 2021 | S&P 500, S&P 500 + DJIA
S&P 500: Elliott Wave and Technical Analysis | Charts – February 17, 2021 A little downwards movement today fits yesterday’s short-term alternate Elliott wave count. Summary: For the very short term, price remains just below a resistance line (the beige...
by Lara | Jan 27, 2021 | S&P 500, S&P 500 + DJIA
S&P 500: Elliott Wave and Technical Analysis | Charts – January 27, 2021 A little more downwards movement was expected, but the main Elliott wave count was invalidated. Downwards movement leaves the alternate Elliott wave count valid today. Summary: Both main and...
