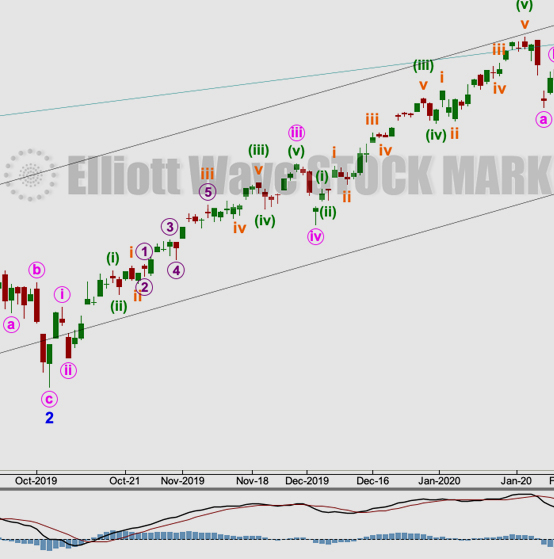
by Lara | Feb 23, 2021 | S&P 500, S&P 500 + DJIA
S&P 500: Elliott Wave and Technical Analysis | Charts – February 23, 2021 Another downwards day ends with a strong bounce to close green. The opening gap is closed and the daily candlestick has a long lower wick. This supports the main hourly wave count. Summary:...
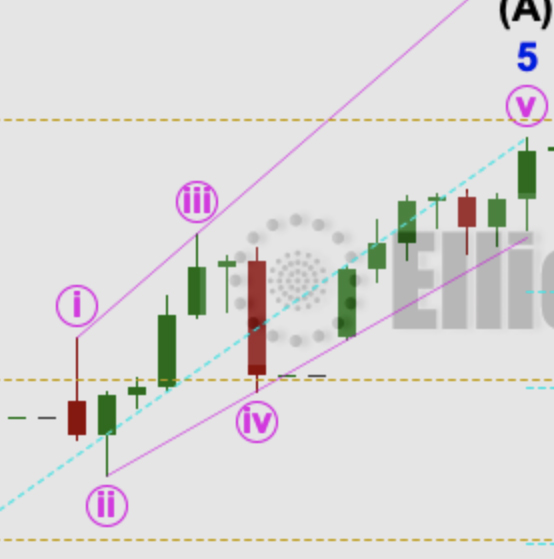
by Lara | Feb 22, 2021 | S&P 500, S&P 500 + DJIA
S&P 500: Elliott Wave and Technical Analysis | Charts – February 22, 2021 Another downwards day sees price fit the second alternate hourly Elliott wave count, one of three possible short-term outcomes for the session. At the daily chart level, price remains well...
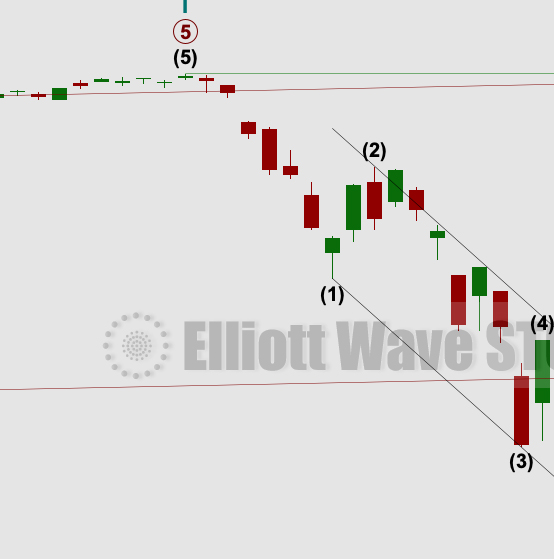
by Lara | Feb 19, 2021 | S&P 500, S&P 500 + DJIA
S&P 500: Elliott Wave and Technical Analysis | Charts – February 19, 2021 A small range upwards week closes red. Overall, price continues to move higher towards targets, with normal corrections along the way. Summary: The current pullback is still expected to be...
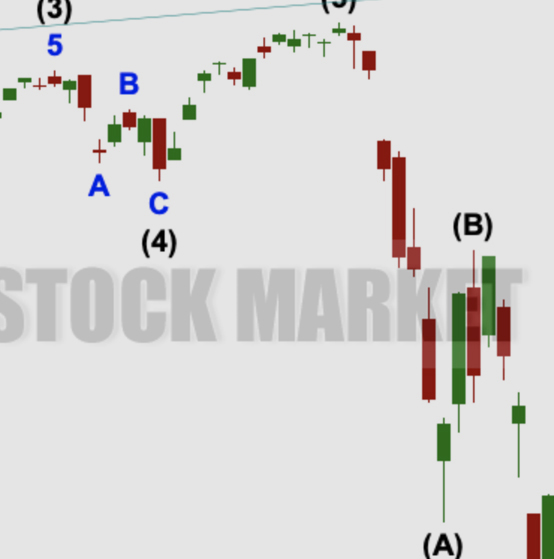
by Lara | Feb 18, 2021 | S&P 500, S&P 500 + DJIA
S&P 500: Elliott Wave and Technical Analysis | Charts – February 18, 2021 A little more downwards movement remains above support and above the short-term Elliott wave invalidation point. Summary: The current pullback is still expected to be short term in nature....
by Lara | Feb 17, 2021 | S&P 500, S&P 500 + DJIA
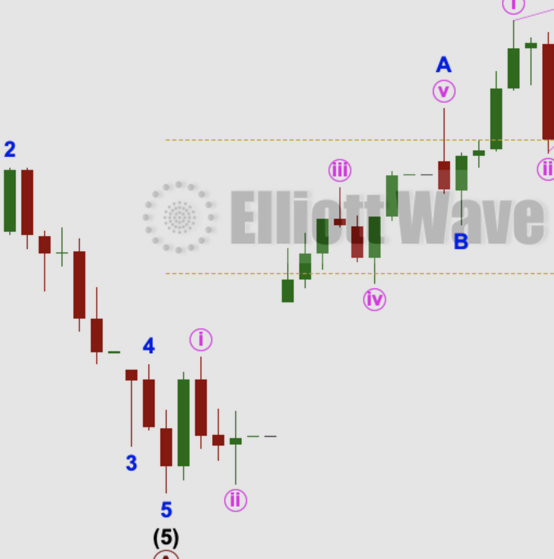
S&P 500: Elliott Wave and Technical Analysis | Charts – February 17, 2021 A little downwards movement today fits yesterday’s short-term alternate Elliott wave count. Summary: For the very short term, price remains just below a resistance line (the beige...
by Lara | Feb 16, 2021 | S&P 500, S&P 500 + DJIA
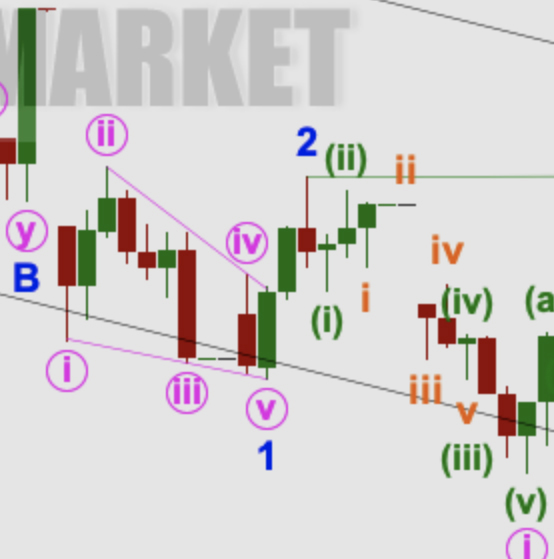
S&P 500: Elliott Wave and Technical Analysis | Charts – February 16, 2021 A higher high and a higher low continues the expectation of upwards movement. Price has slowed down at a strong resistance line. Summary: For the very short term, price is still at a...

by Lara | Feb 12, 2021 | S&P 500, S&P 500 + DJIA
S&P 500: Elliott Wave and Technical Analysis | Charts – February 12, 2021 Since October 8, 2020, this analysis has been bullish for the main Elliott wave count. Since that date the S&P 500 has added another 488 points. Price continues to move higher towards...

by Lara | Feb 11, 2021 | S&P 500, S&P 500 + DJIA
S&P 500: Elliott Wave and Technical Analysis | Charts – February 11, 2021 A small range inside day closes as a red doji. The market spent the day essentially consolidating. Price remains above the short-term Elliott wave invalidation point. The target remains the...

by Lara | Feb 10, 2021 | S&P 500, S&P 500 + DJIA
S&P 500: Elliott Wave and Technical Analysis | Charts – February 10, 2021 An outside day with a new all time high fits expectations for further upwards movement. Downwards movement at the end of the session remains above the short-term invalidation point....


