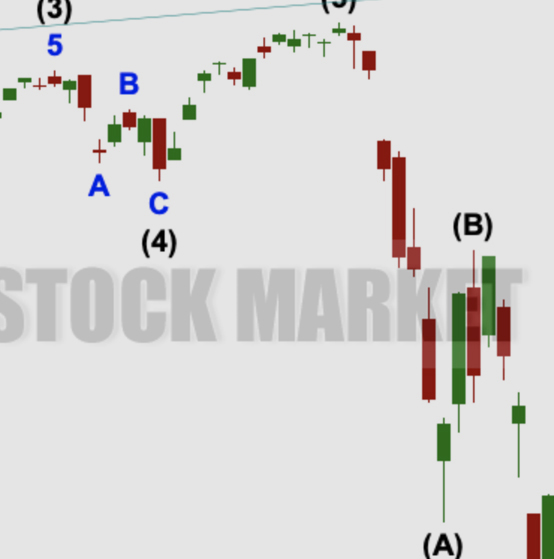
by Lara | Mar 8, 2021 | S&P 500, S&P 500 + DJIA
S&P 500: Elliott Wave and Technical Analysis | Charts – March 8, 2021 The main short-term hourly Elliott wave count expected upwards movement to begin the week, which is how Monday has completed with a higher high and a higher low, although the session closed...
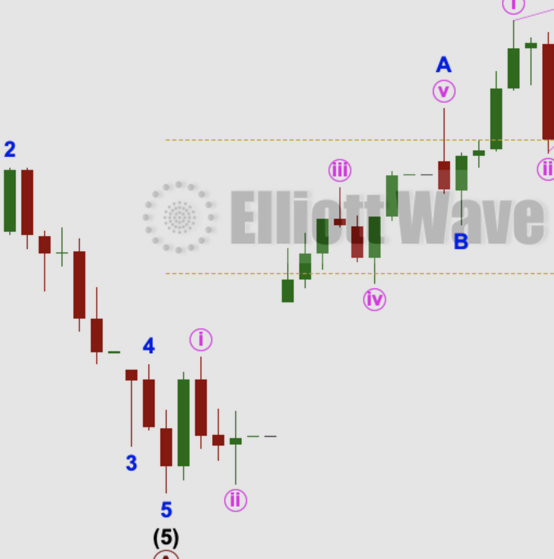
by Lara | Mar 5, 2021 | S&P 500, S&P 500 + DJIA
S&P 500: Elliott Wave and Technical Analysis | Charts – March 5, 2021 An upwards day was expected from the main Elliott wave count in last analysis. Summary: The pullback may have continued lower as a triple zigzag. The structure may now be complete; next support...
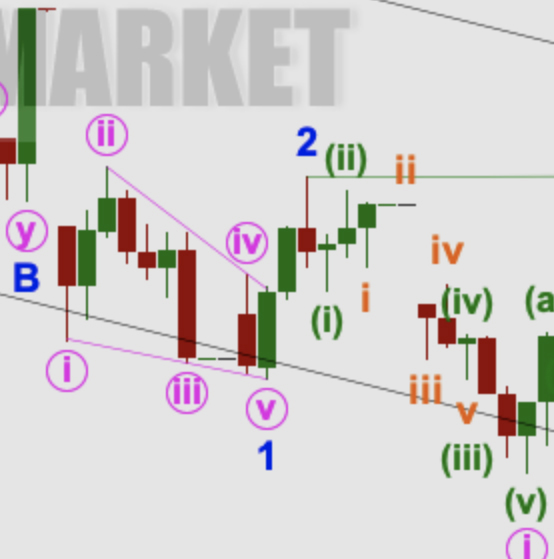
by Lara | Mar 4, 2021 | S&P 500, S&P 500 + DJIA
S&P 500: Elliott Wave and Technical Analysis | Charts – March 4, 2021 Another downwards day has invalidated the main short-term hourly Elliott wave count, leaving the alternate Elliott wave count valid. Summary: The pullback may have continued lower as a triple...
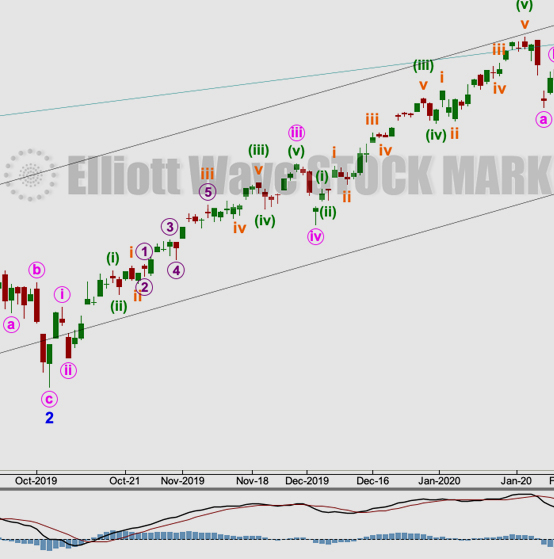
by Lara | Mar 3, 2021 | S&P 500, S&P 500 + DJIA
S&P 500: Elliott Wave and Technical Analysis | Charts – March 3, 2021 A downwards day closes with price still above the short-term invalidation point on the main hourly chart. All three short-term hourly charts remain valid. Technical analysis supports the main...
by Lara | Mar 2, 2021 | S&P 500, S&P 500 + DJIA
S&P 500: Elliott Wave and Technical Analysis | Charts – March 2, 2021 A small range inside day leaves price above the invalidation point on the main hourly Elliott wave count. All three short-term hourly Elliott wave counts remain valid. Summary: The pullback may...
by Lara | Mar 1, 2021 | S&P 500, S&P 500 + DJIA
S&P 500: Elliott Wave and Technical Analysis | Charts – March 1, 2021 An upwards day fits the short-term expectation for both hourly Elliott wave counts. Summary: The pullback may be over at last week’s low, or it may continue sideways as a triangle or flat...

by Lara | Feb 26, 2021 | S&P 500, S&P 500 + DJIA
S&P 500: Elliott Wave and Technical Analysis | Charts – February 26, 2021 In yesterday’s analysis members were warned that an 80% down day and bearish signals from the AD line and VIX suggested more downwards movement was possible for Friday, which is what...

by Lara | Feb 25, 2021 | S&P 500, S&P 500 + DJIA
S&P 500: Elliott Wave and Technical Analysis | Charts – February 25, 2021 A strong downwards day completes an 80% down day. This fits the alternate Elliott wave count for the short term. Summary: The last pullback may still be over. If it continues further, then...
by Lara | Feb 24, 2021 | S&P 500, S&P 500 + DJIA
S&P 500: Elliott Wave and Technical Analysis | Charts – February 24, 2021 Last analysis stated that the pullback was expected to be over at yesterday’s low. A strong upwards day today fits this expectation. Summary: The last pullback is expected most likely...


