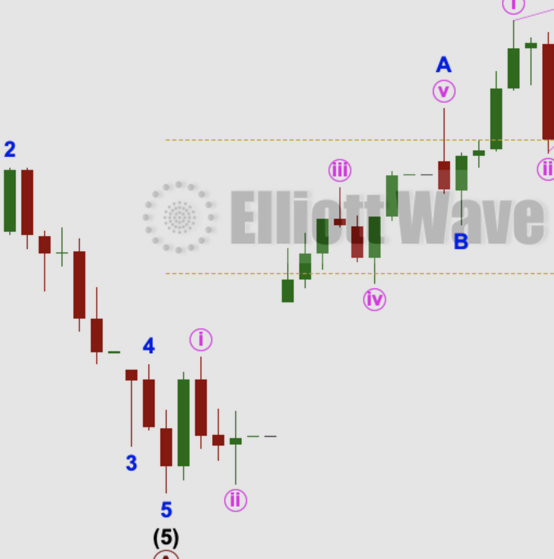
by Lara | Sep 18, 2020 | S&P 500, S&P 500 + DJIA
S&P 500: Elliott Wave and Technical Analysis | Charts – September 18, 2020 Overall, for this week the first wave count has expected a pullback or consolidation to continue. A downwards week fits this expectation. Summary: Downwards movement may continue next...
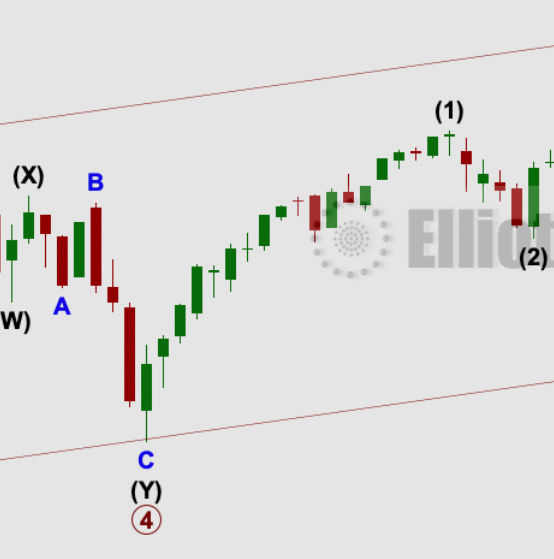
by Lara | Sep 17, 2020 | S&P 500, S&P 500 + DJIA
S&P 500: Elliott Wave and Technical Analysis | Charts – September 17, 2020 Downwards movement was expected for the short term by all short-term hourly charts for this session. A lower low and a lower high fits the expectation of downwards movement, although the...
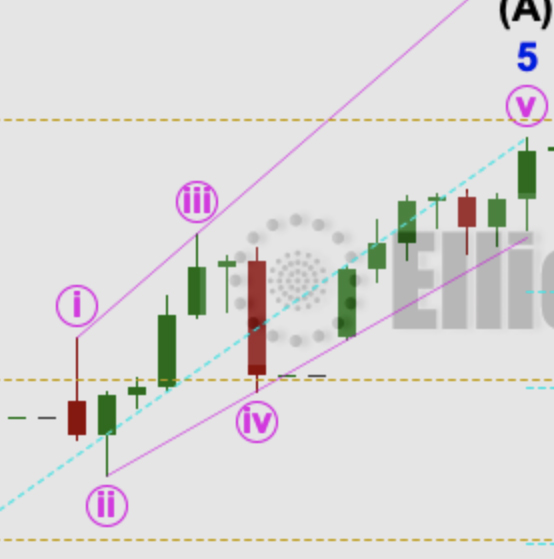
by Lara | Sep 16, 2020 | S&P 500, S&P 500 + DJIA
S&P 500: Elliott Wave and Technical Analysis | Charts – September 16, 2020 Today it is possible that the B wave may be over. Two short-term charts are provided. Summary: A triangle may continue sideways. Thereafter, downwards movement may continue. The first wave...
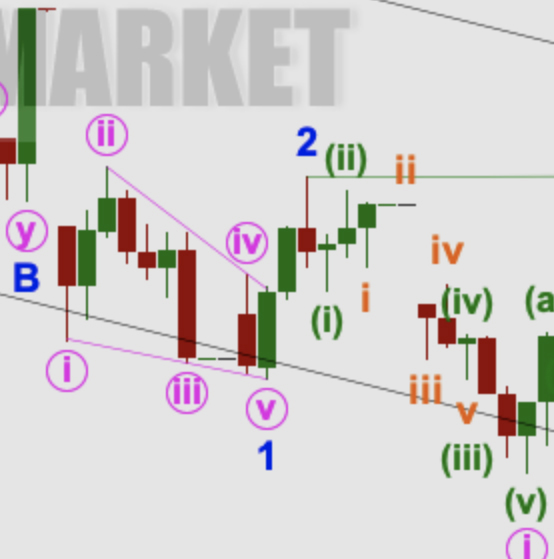
by Lara | Sep 15, 2020 | S&P 500, S&P 500 + DJIA
S&P 500: Elliott Wave and Technical Analysis | Charts – September 15, 2020 A triangle may be continuing sideways. The first hourly chart for both Elliott wave counts expects the breakout to be in the same direction. Summary: A triangle may continue sideways....

by Lara | Sep 14, 2020 | S&P 500, S&P 500 + DJIA
S&P 500: Elliott Wave and Technical Analysis | Charts – September 14, 2020 Again, VIX and the AD line both give signals for the direction of price tomorrow. The short-term target remains the same. Summary: For the very short term, this bounce may end about 3,481...

by Lara | Sep 11, 2020 | Gold, Lara's Weekly, S&P 500, US Oil
Lara’s Weekly: Elliott Wave and Technical Analysis of S&P500 and Gold and US Oil | Charts – September 11, 2020 Commentary and charts of Lara’s Weekly, an end of week Elliott Wave and Technical Analysis of the S&P 500 and GOLD and USOIL, for week...
by Lara | Sep 11, 2020 | S&P 500, S&P 500 + DJIA
S&P 500: Elliott Wave and Technical Analysis | Charts – September 11, 2020 At the end of the week, signals from VIX and the AD line suggest the direction for price when markets open next week. Summary: For the very short term, this bounce may end about 3,481 but...

by Lara | Sep 10, 2020 | S&P 500, S&P 500 + DJIA
S&P 500: Elliott Wave and Technical Analysis | Charts – September 10, 2020 At the end of this session, three different short-term pathways are considered for tomorrow. Summary: For the very short term, this bounce may end about 3,425 or a little lower. This view...

by Lara | Sep 9, 2020 | S&P 500, S&P 500 + DJIA
S&P 500: Elliott Wave and Technical Analysis | Charts – September 9, 2020 A short-term bounce did finally eventuate this session. A short-term target is calculated for it to end. Summary: For the very short term, this bounce may end about 3,497 – 3,500....


