
S&P 500: Elliott Wave and Technical Analysis | Charts – September 17, 2020
Downwards movement was expected for the short term by all short-term hourly charts for this session. A lower low and a lower high fits the expectation of downwards movement, although the candlestick closed green.
Summary: A triangle may continue sideways. Thereafter, downwards movement may continue.
The first wave count expects that a pullback or consolidation to last a few weeks is about two thirds complete. It may find support about 3,259, 3,055 or 2,725.
The second wave count considers the possibility that a once in multi-generations trend change may have occurred. Some confidence in this wave count would come with invalidation of the first wave count below 2,191.86.
At this stage, a new all time high above 3,588.11 would be bullish. The next target would then be at 4,706.
The biggest picture, Grand Super Cycle analysis, is here.
Monthly charts are here, with video here.
ELLIOTT WAVE COUNTS
FIRST WAVE COUNT
WEEKLY CHART
Click chart to enlarge.
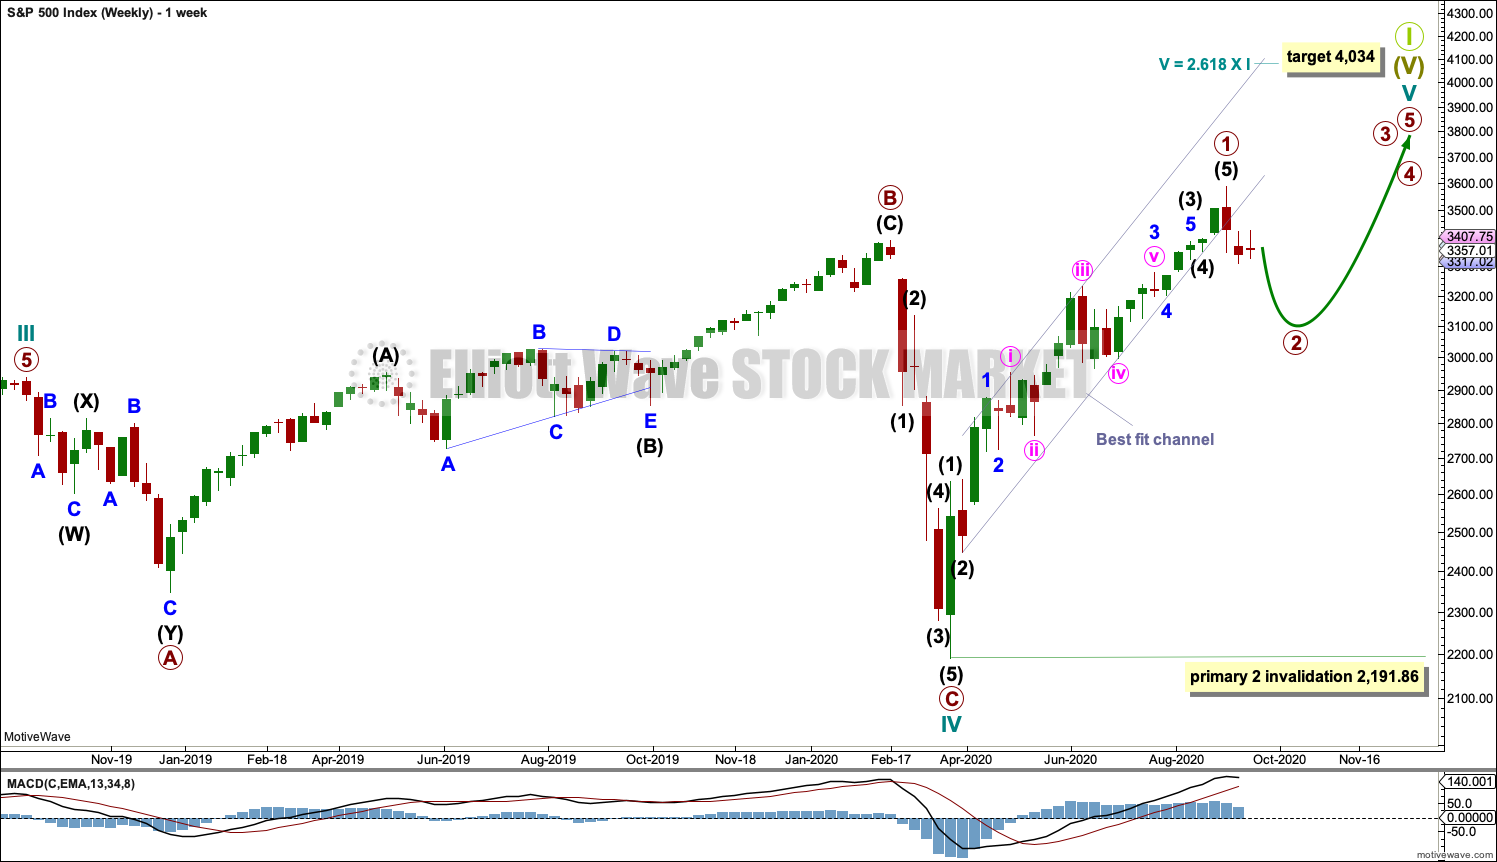
Cycle wave V may last from one to several years. So far it has lasted 6 months.
Cycle wave V would most likely subdivide as an impulse. But if overlapping develops, then an ending diagonal should be considered. This chart considers the more common impulse.
Primary wave 1 may be complete. Primary wave 2 may not move beyond the start of primary wave 1 below 2,191.86.
There is already a Fibonacci ratio between cycle waves I and III within Super Cycle wave (V). The S&P500 often exhibits a Fibonacci ratio between two of its actionary waves but rarely between all three; it is less likely that cycle wave V would exhibit a Fibonacci ratio. The target for Super Cycle wave (V) to end would best be calculated at primary degree, but that cannot be done until all of primary waves 1, 2, 3 and 4 are complete. The target at 4,034 is provisional, so it may change.
DAILY CHART
Click chart to enlarge.
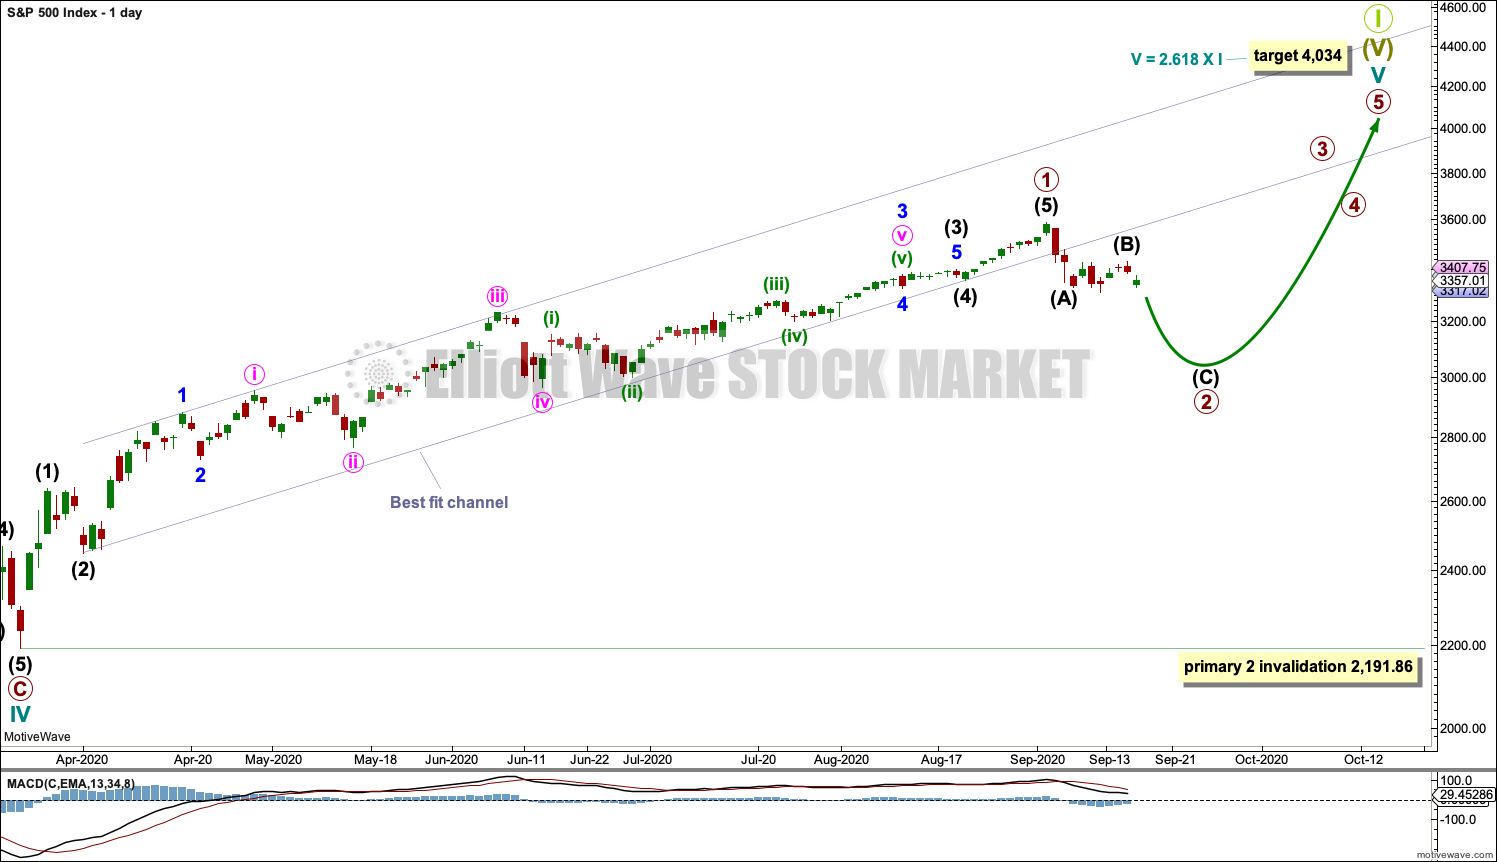
The best fit channel is breached by clearly downwards movement. This adds confidence in a trend change, at least for the short or mid term. A deeper bounce here may find resistance about the lower edge of this channel for a back test.
Primary wave 1 may be over and primary wave 2 may have begun.
Primary wave 2 may be a multi-week pullback or consolidation. Primary wave 2 may not move beyond the start of primary wave 1 below 2,191.86.
Today two hourly charts are considered. They may have about even probability and now both expect essentially the same movement next.
FIRST HOURLY CHART
Click chart to enlarge.
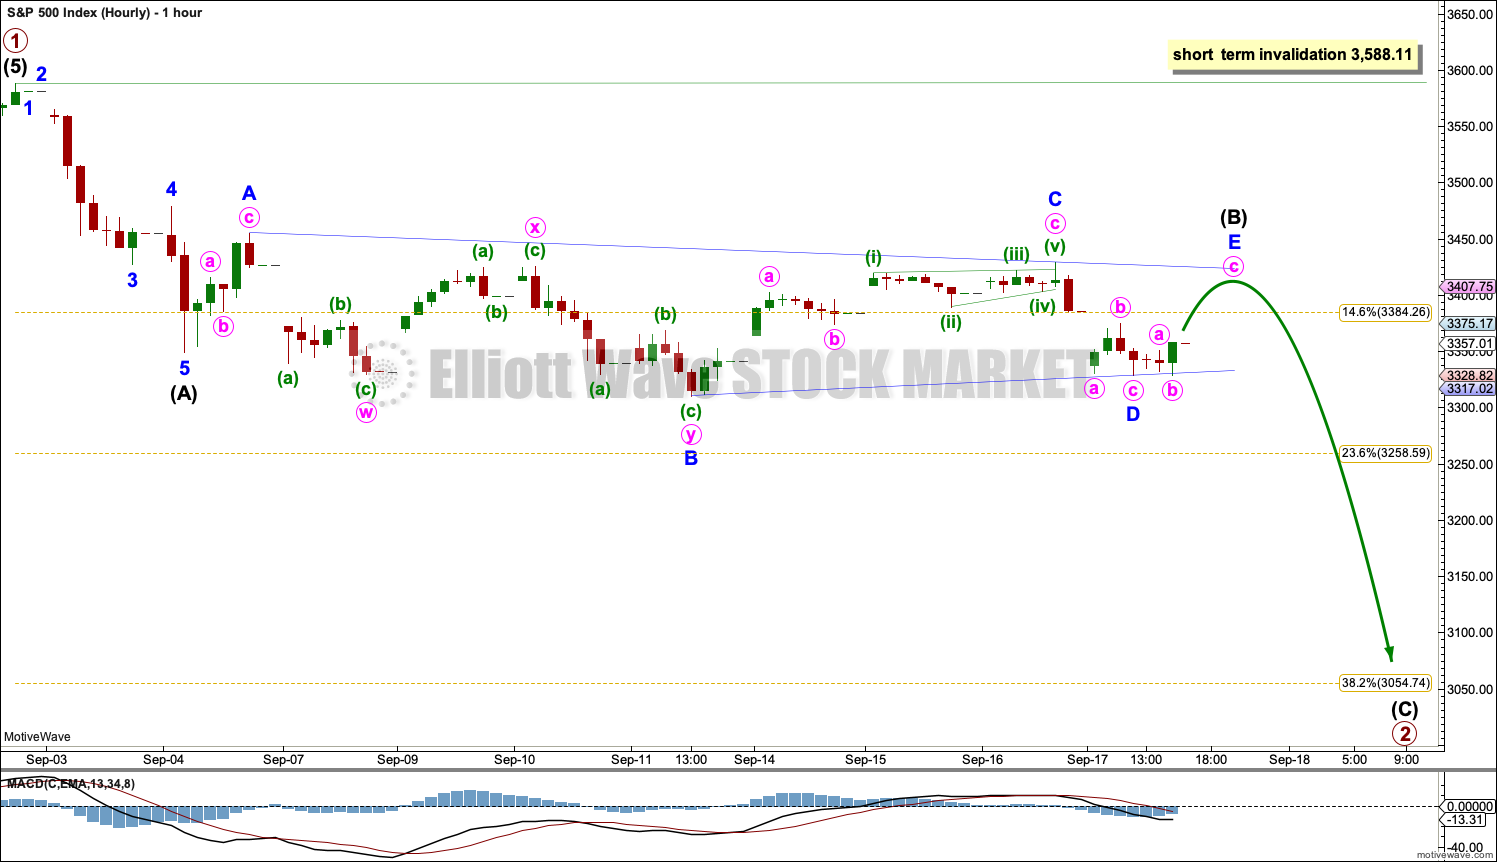
Primary wave 2 may have begun. It would most likely subdivide as a zigzag, but it may subdivide as any Elliott wave corrective structure except a triangle.
A correction at primary degree should begin with a five wave structure downwards at the hourly chart level, which may be complete and is labelled intermediate wave (A). This degree of labelling may need to be moved down one degree depending upon how primary wave 2 unfolds.
A five wave structure downwards should then be followed by a three wave structure upwards, which may not move beyond the start of the five down. This will at this stage be labelled intermediate wave (B).
Intermediate wave (B) may subdivide as any Elliott wave corrective structure.
Intermediate wave (B) may be subdividing as a running contracting or running barrier triangle. Minor wave D within a contracting triangle may not move beyond the end of minor wave B below 3,310.47. Minor wave D within a barrier triangle may end about the same level as minor wave B at 3,310.47, so that the B-D trend line remains essentially flat. In practice this means that minor wave D may end slightly below 3,310.47 and a triangle would remain valid.
Minor wave E for both a contracting and barrier triangle may not move beyond the end of minor wave C above 3,428.92. Minor wave E would most likely fall short of the A-C trend line. If it does not end there, then the next likely point for minor wave E to end would be to slightly overshoot the A-C trend line.
If an Elliott wave triangle is unfolding sideways, then a downwards breakout would be expected when it is complete.
Intermediate wave (B) may yet morph into a double combination or a flat correction; labelling within it may still change again. At this stage, focus is on identifying when intermediate wave (B) may be complete rather than identifying which of several structural possibilities it may be.
Intermediate wave (B) may not move beyond the start of intermediate wave (A) above 3,588.11.
Primary wave 2 would most likely continue longer and move deeper for it to have a normal look.
SECOND HOURLY CHART
Click chart to enlarge.
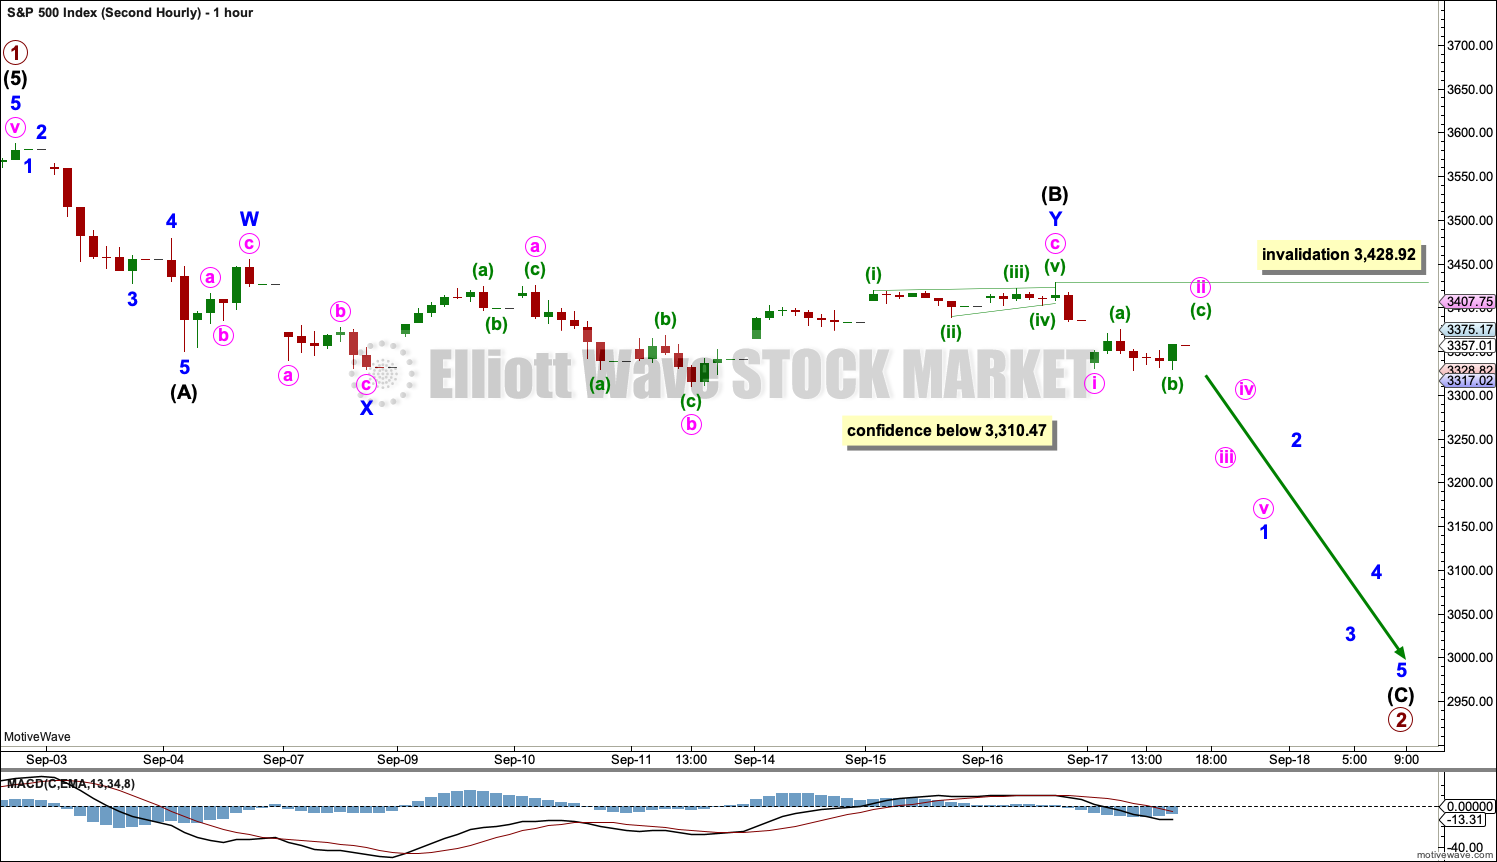
It is possible to see intermediate wave (B) as a complete corrective structure. Intermediate wave (B) may be a complete double combination.
The first structure in the double combination may be a complete zigzag labelled minor wave w. The double is joined by a three in the opposite direction, a zigzag labelled minor wave x.
The second structure in the double may now be a complete expanded flat labelled minor wave y. Minute wave c has moved beyond the end of minute wave a, avoiding a truncation and a very rare running flat. Minute wave c subdivides as an ending contracting diagonal.
If intermediate wave (B) is complete, then minor wave 2 within intermediate wave (C) may not move beyond the start of minor wave 1 above 3,428.92. Minute wave ii may move a little higher tomorrow before it is complete.
ALTERNATE DAILY CHART
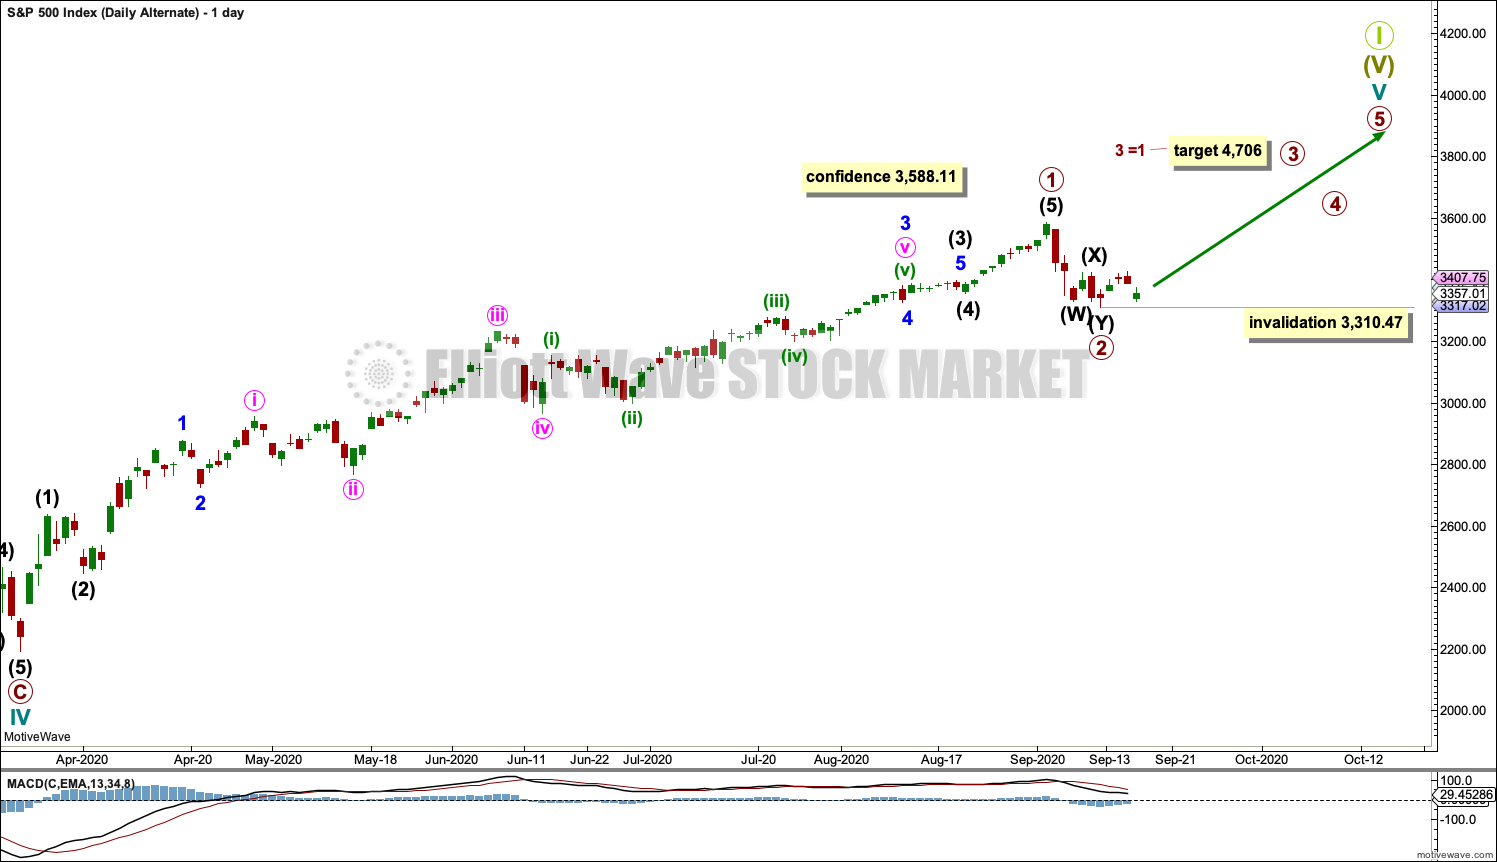
Click chart to enlarge.
It is possible that primary wave 2 was over as a very brief and shallow double zigzag. This idea is best viewed at the daily chart level so that the depth and proportion of primary wave 2 to primary wave 1 is clearly seen.
This wave count does not have the right look on the daily chart, but there is some support from technical analysis for this bullish view.
ALTERNATE HOURLY CHART
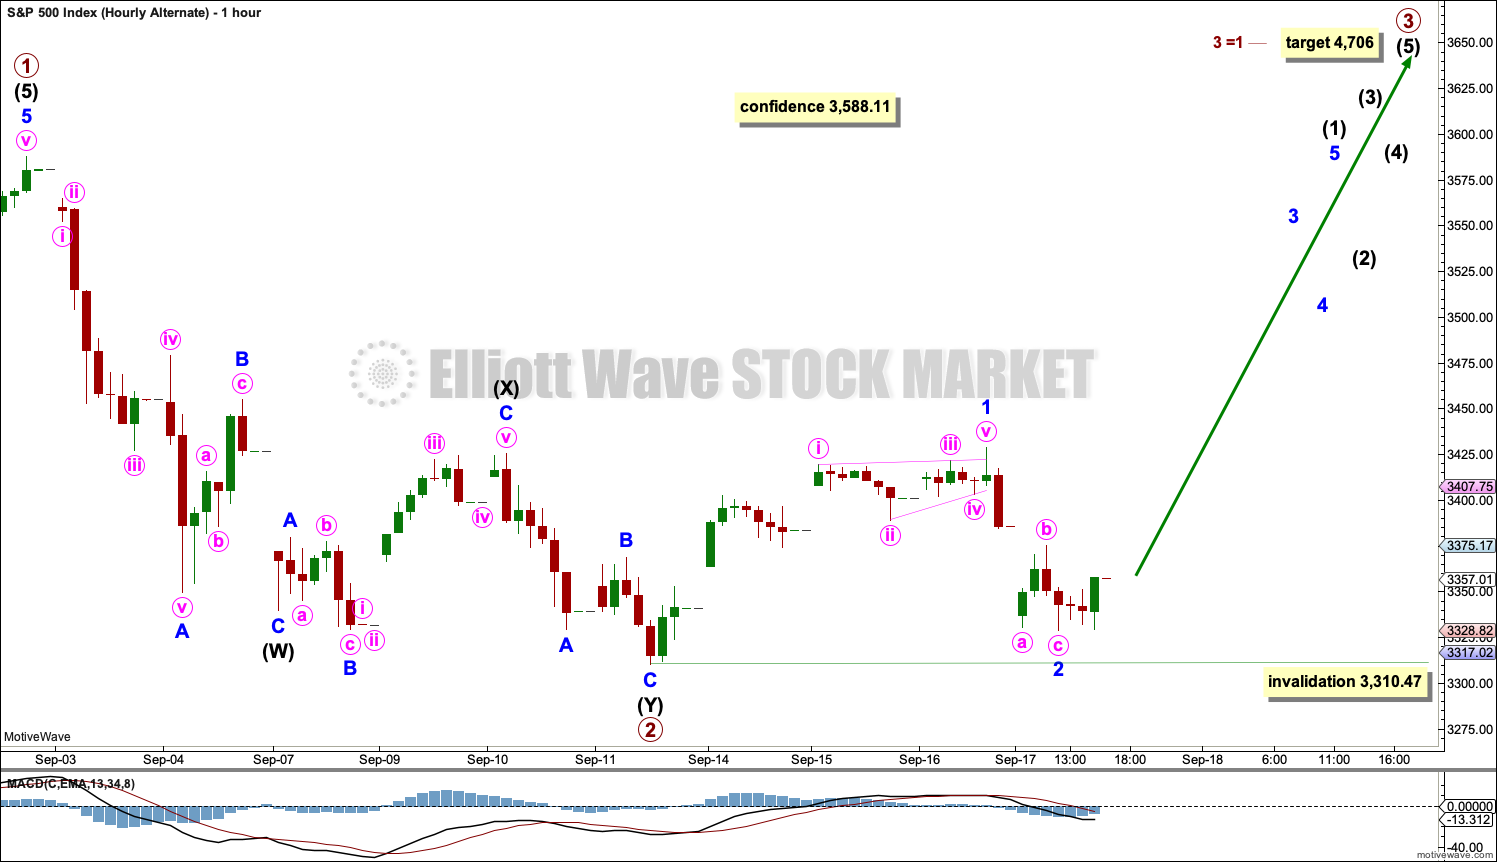
Click chart to enlarge.
A new all time high above 3,588.11 would add confidence to this wave count.
The target is conservative. If price reaches this target and either the structure is incomplete or price keeps rising, then a second target using the next Fibonacci ratio in the sequence would be calculated.
Minor wave 1 within primary wave 3 may have subdivided as a leading contracting diagonal. Minor wave 2 may be complete as a deep 0.85 zigzag; this follows normal behaviour for a second wave correction following a leading diagonal in a first wave position. If it continues lower, then minor wave 2 may not move beyond the start minor wave 1 below 3,310.47.
SECOND WAVE COUNT
DAILY CHART
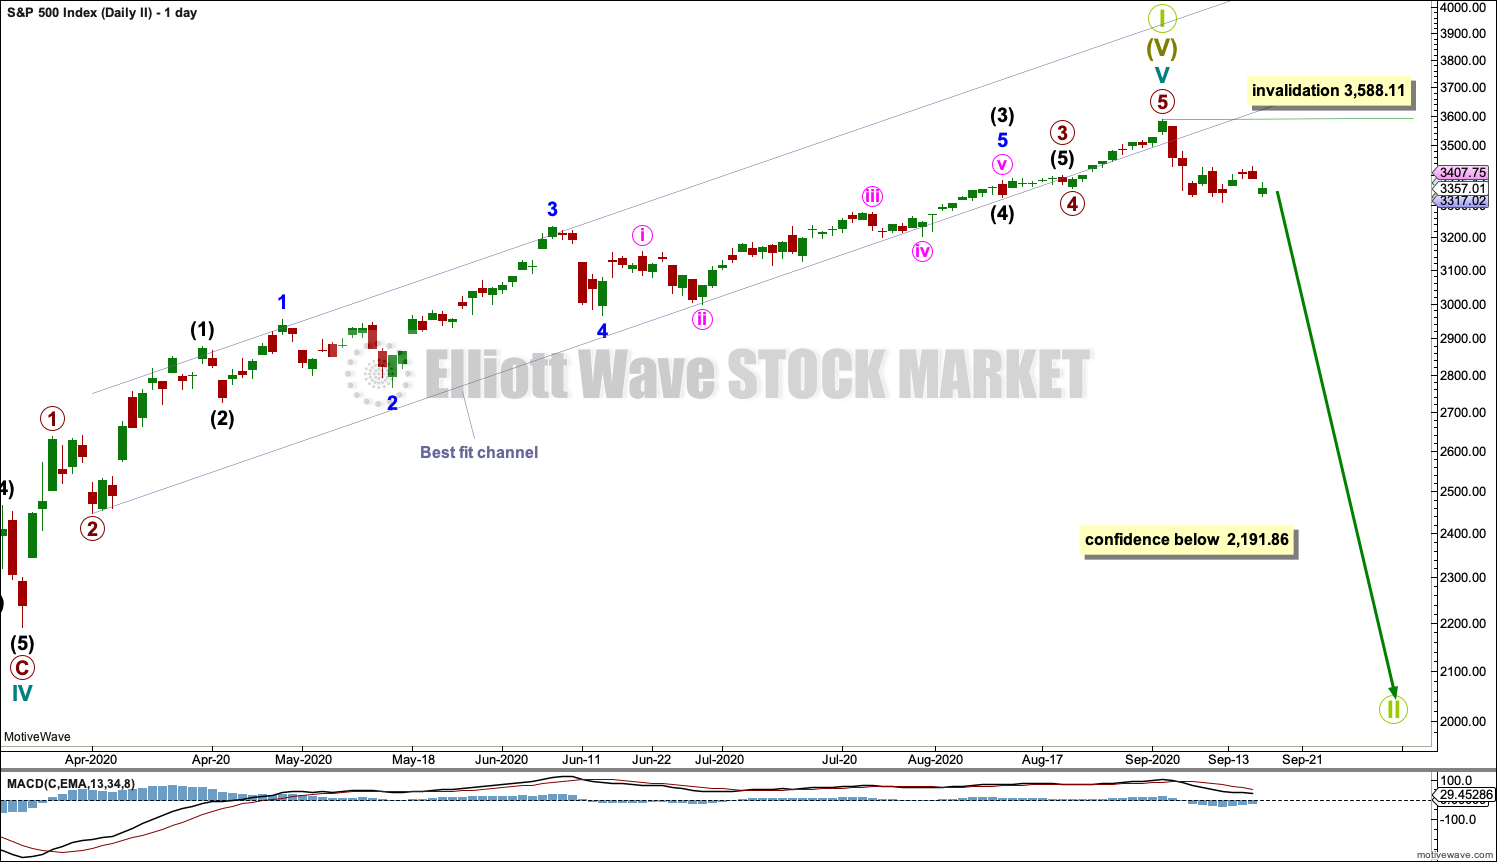
Click chart to enlarge.
This wave count is the same as the first wave count with the exception of the degree of labelling within cycle wave V. If the degree of labelling is moved up one degree, then it is possible that cycle wave V to end Super cycle wave (V) to end Grand Super Cycle wave I is complete.
A new low below 2,191.86 would add confidence in this wave count. At that stage, the first wave count would be invalidated.
A new bear market at Grand Super Cycle degree may be expected to last over a decade. It may take price below the start of Super Cycle wave (V) at 666.79 in March 2009.
HOURLY CHART
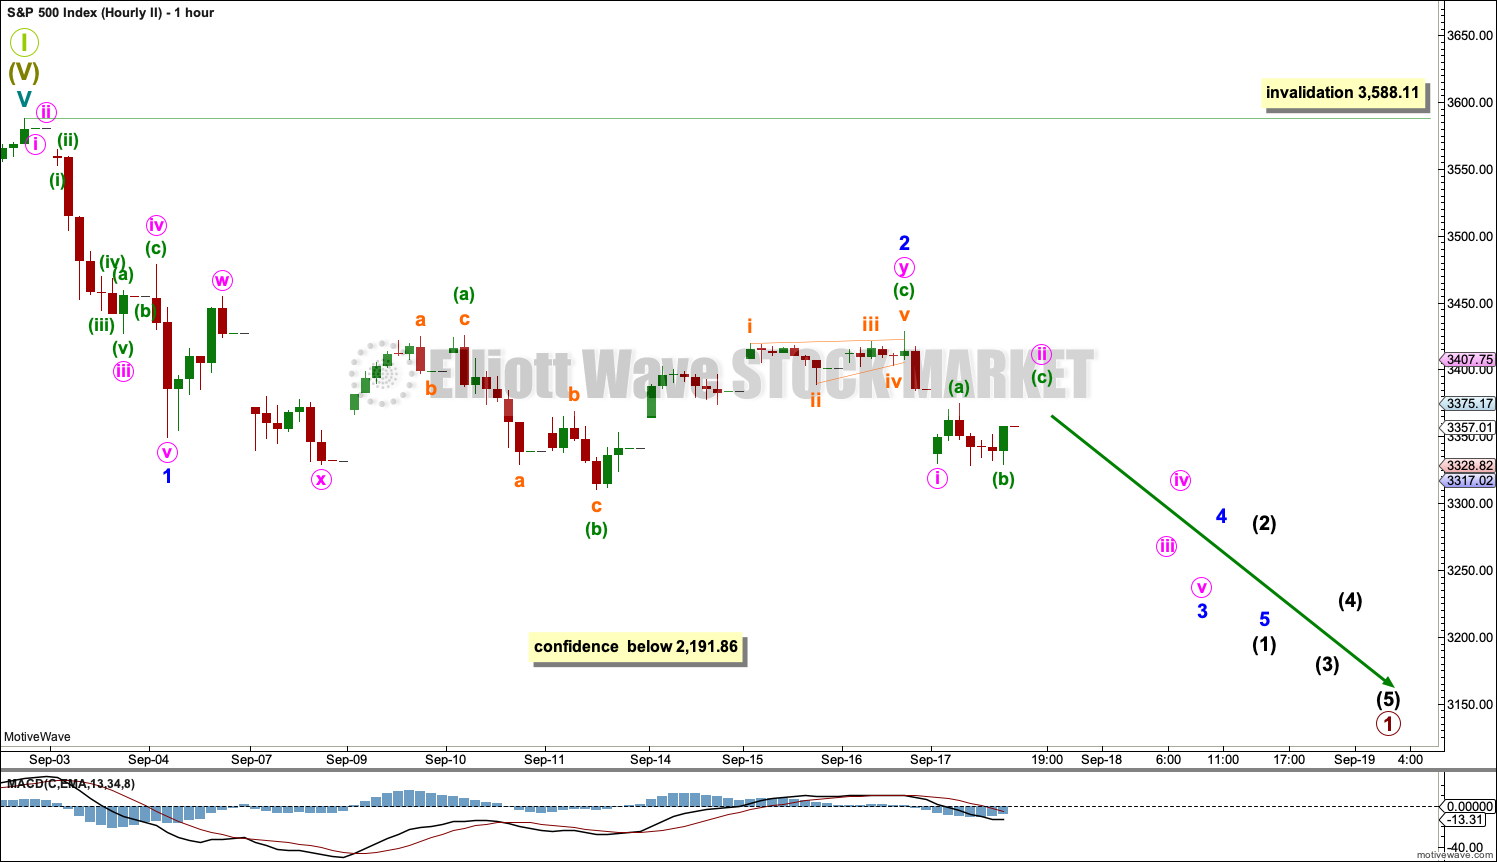
Click chart to enlarge.
It is possible that a Grand Super Cycle degree trend change may have occurred.
The first five down within the new trend is labelled minor wave 1.
Minor wave 2 may be a complete double combination. The first structure in the double may be a complete zigzag labelled minute wave w. The double may be joined by a complete three in the opposite direction, a zigzag labelled minute wave x. The second structure in the double may be a complete expanded flat correction labelled minute wave y.
A downwards breakout may be expected for minor wave 3.
If it continues further, then minor wave 2 may not move beyond the start of minor wave 1 above 3,588.11.
TECHNICAL ANALYSIS
WEEKLY CHART
Click chart to enlarge. Chart courtesy of StockCharts.com.
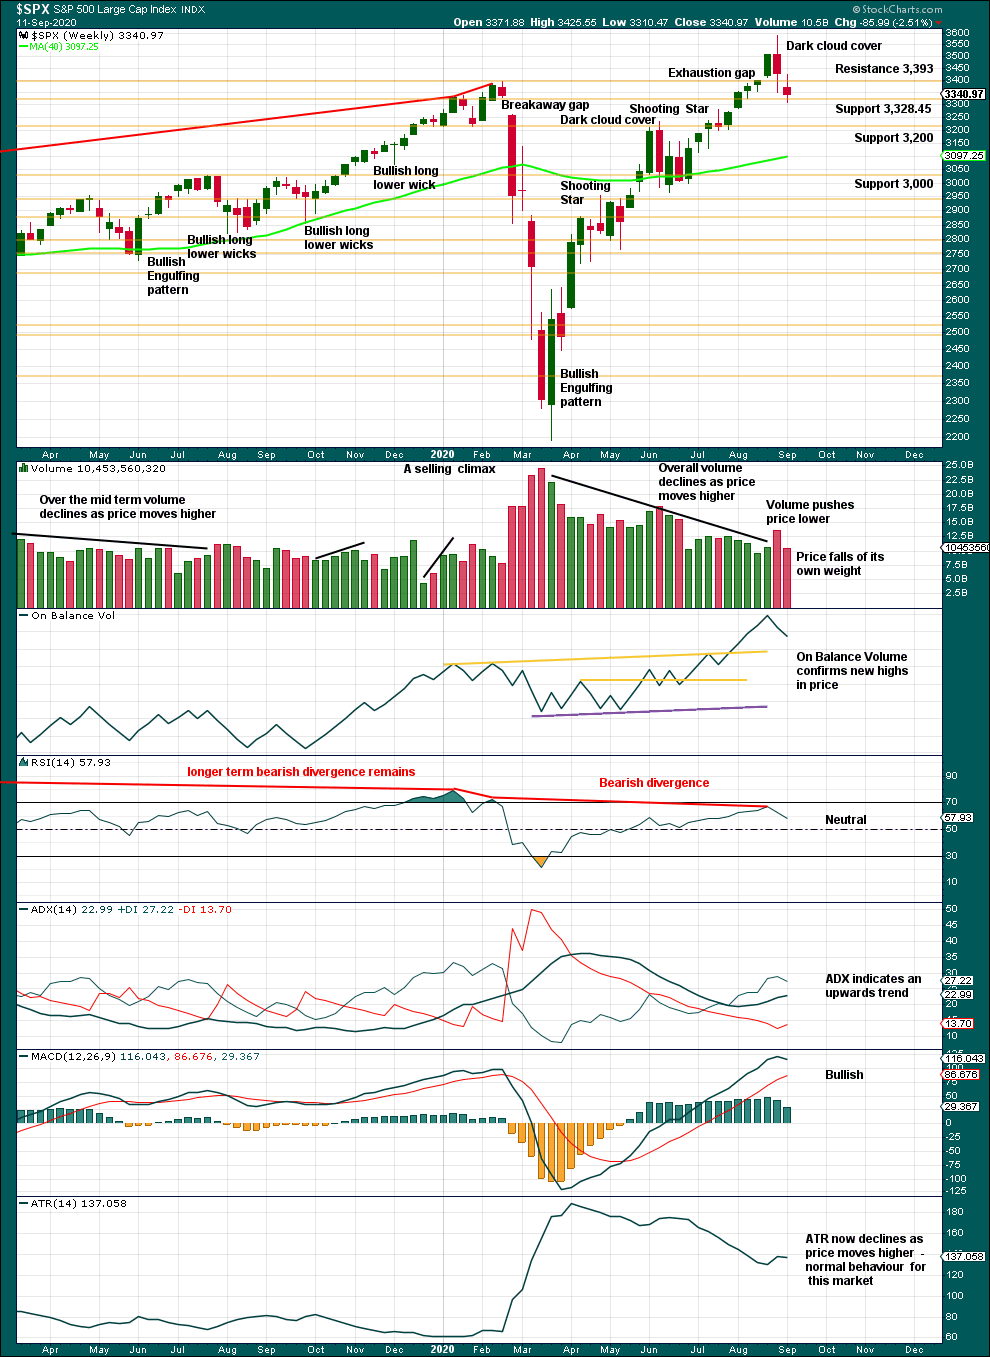
ADX indicates an upwards trend. However, with RSI exhibiting bearish divergence and a bearish candlestick reversal pattern at the high having support from volume, further pullback or consolidation at least for the short term may be expected here.
Last week was a short week with New York closed on Monday, so not much weight should be given to some decline in volume at the weekly chart level.
DAILY CHART
Click chart to enlarge. Chart courtesy of StockCharts.com.
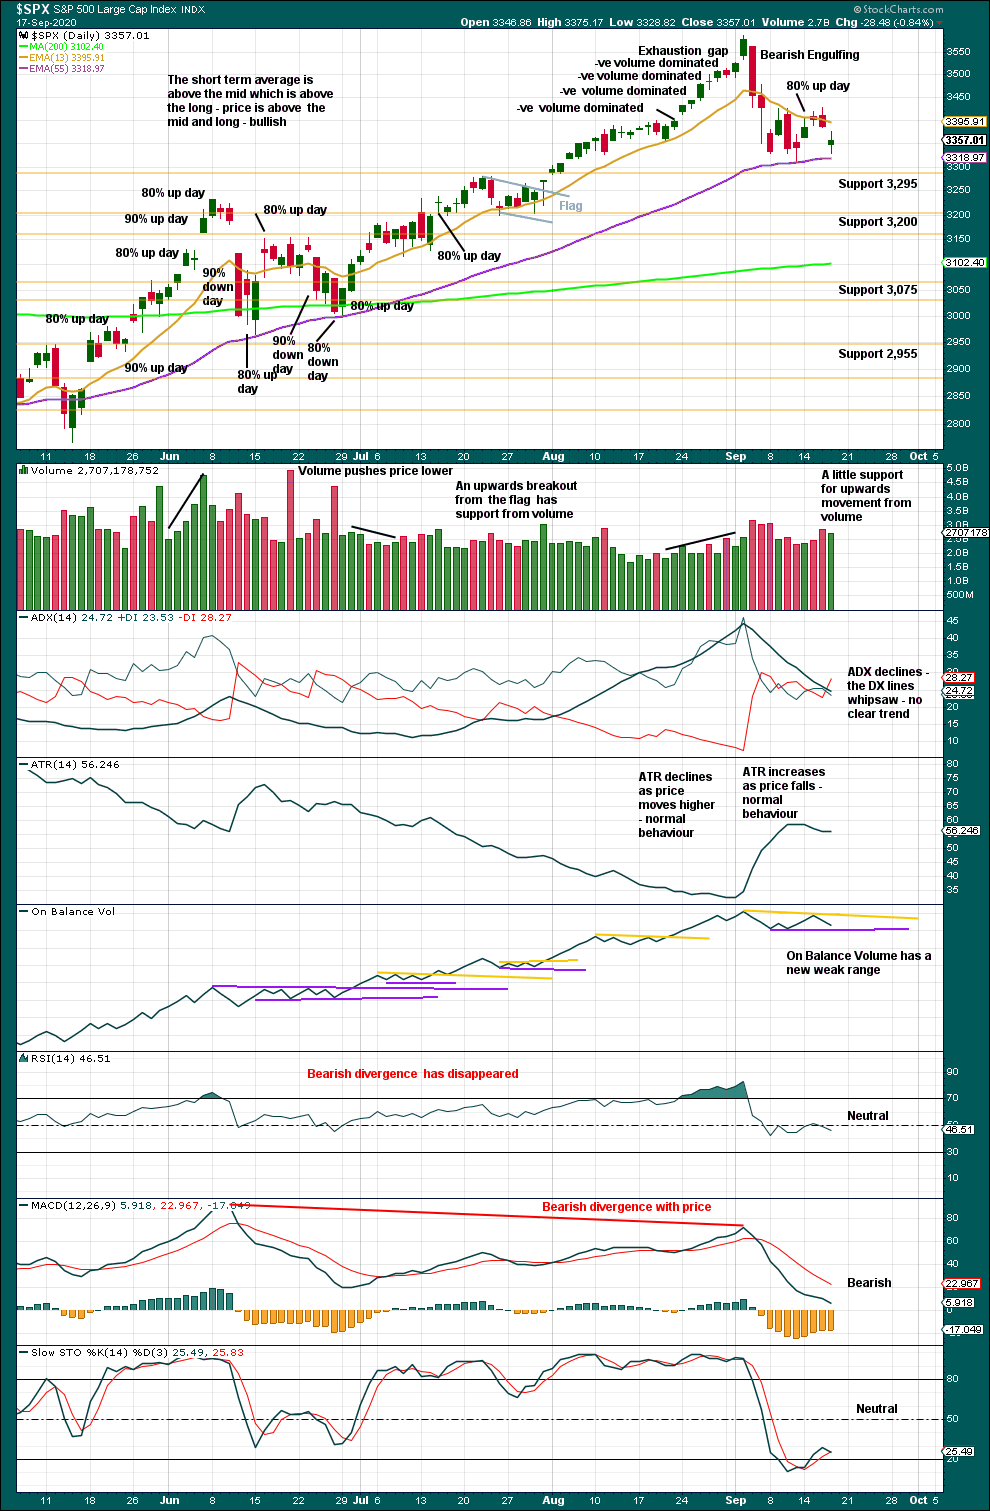
The short-term volume profile remains bullish. Downwards movement today does not have push from increasing volume.
It is possible that the pullback is complete. Price reached close to support. Stochastics reached oversold. However, there was no bullish candlestick pattern at the low. A new all time high would add substantial confidence that the upwards trend has returned.
BREADTH – AD LINE
WEEKLY CHART
Click chart to enlarge. Chart courtesy of StockCharts.com. So that colour blind members are included, bearish signals will be noted with blue and bullish signals with yellow.
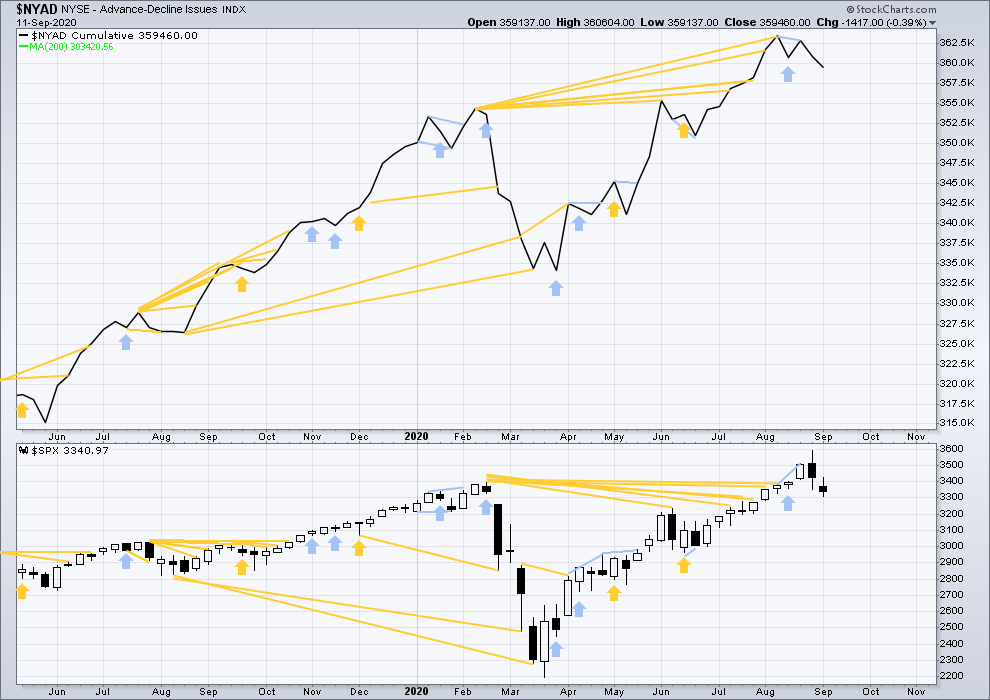
Breadth should be read as a leading indicator.
Lowry’s Operating Companies Only AD line has still not made new all time highs. The last high for the OCO AD line was in the week beginning January 13, 2020. There is now 7 and a half months of bearish divergence between price and the OCO AD line. This may now support the more bearish second wave count. It is possible now that a major trend change may occur.
The NYSE All Issues AD line made new highs in the week beginning 1st of June.
Last week both price and the AD line have moved lower. There is no new divergence.
Large caps all time high: 3,588.11 on September 2, 2020.
Mid caps all time high: 2,109.43 on February 20, 2020.
Small caps all time high: 1,100.58 on August 27, 2018.
This rise has been led by large caps, which is a feature of an aged bull market. Only large caps have made new highs above the last swing high of the 11th of August.
DAILY CHART
Click chart to enlarge. Chart courtesy of StockCharts.com. So that colour blind members are included, bearish signals will be noted with blue and bullish signals with yellow.
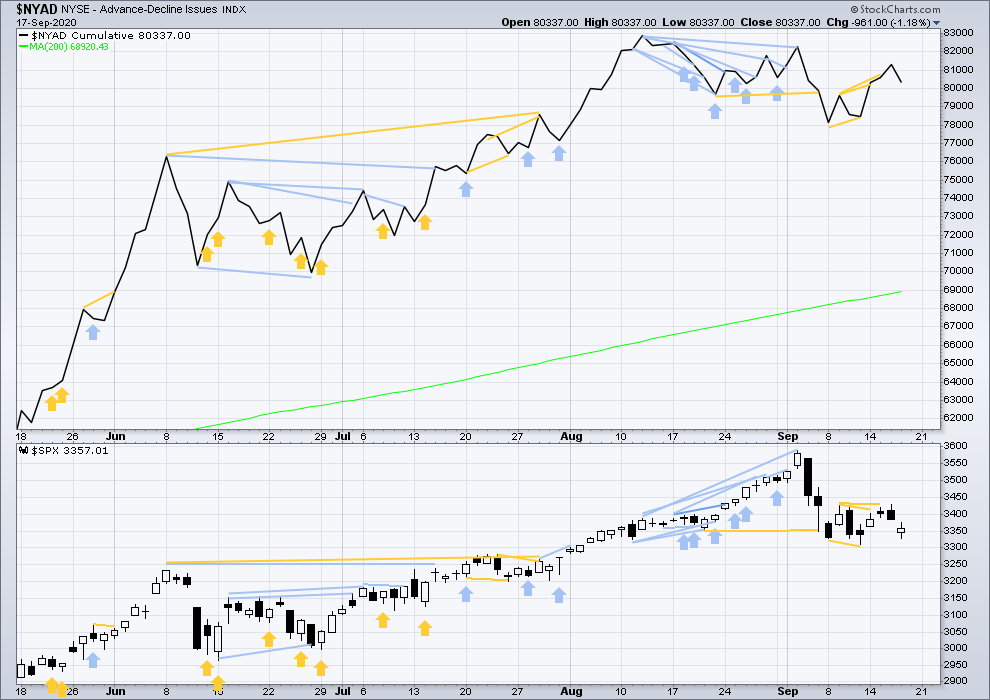
Today both price and the AD line have declined. There is no new short-term divergence.
VOLATILITY – INVERTED VIX CHART
WEEKLY CHART
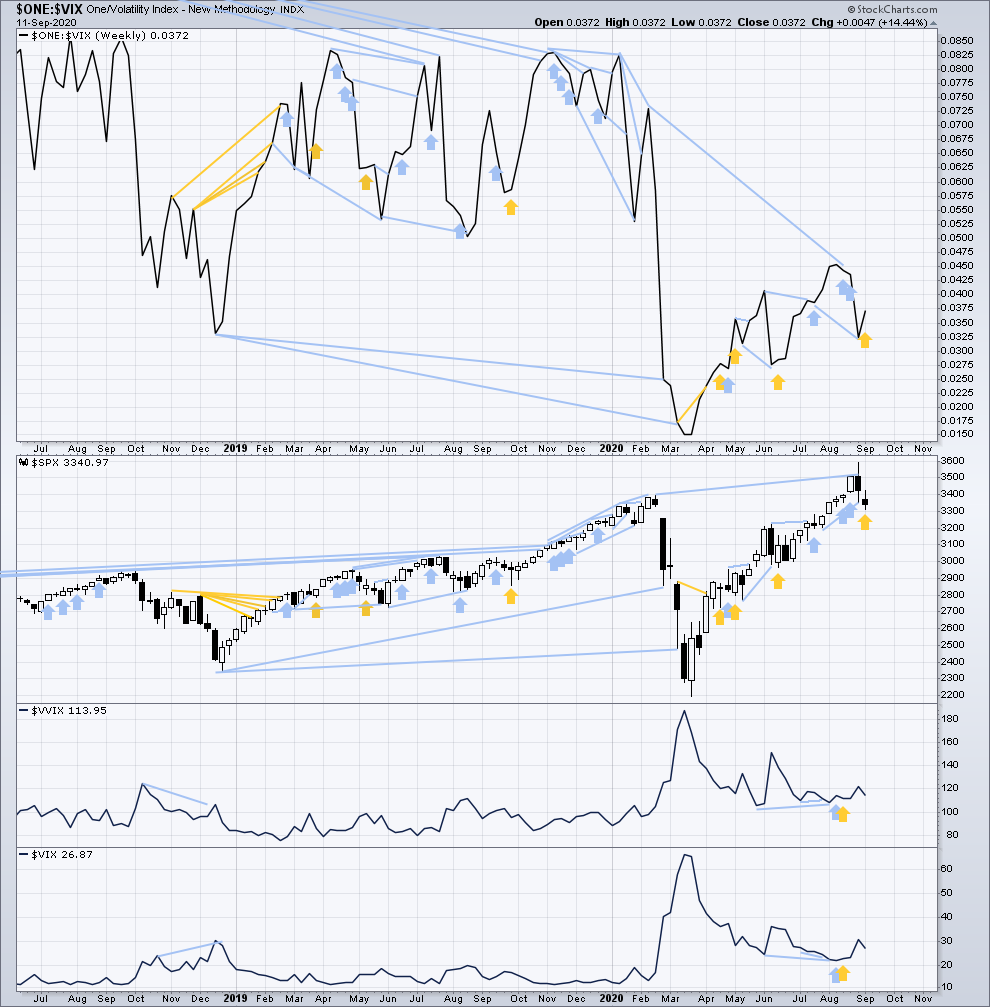
Click chart to enlarge. Chart courtesy of StockCharts.com. So that colour blind members are included, bearish signals will be noted with blue and bullish signals with yellow.
Inverted VIX remains well below all time highs. The all time high for inverted VIX was in the week beginning October 30, 2017. There is nearly 3 years of bearish divergence between price and inverted VIX. There is all of long, mid and short-term bearish divergence.
Last week price has moved lower, but inverted VIX has moved higher. This divergence is bullish for the short term.
Comparing VIX and VVIX: From weeks beginning 1st June to four weeks ago, VIX has made new lows as price has made new highs, but VVIX has failed to make corresponding new lows with VIX. VVIX remains slightly elevated. This divergence is not strong, but it is bearish for price.
DAILY CHART
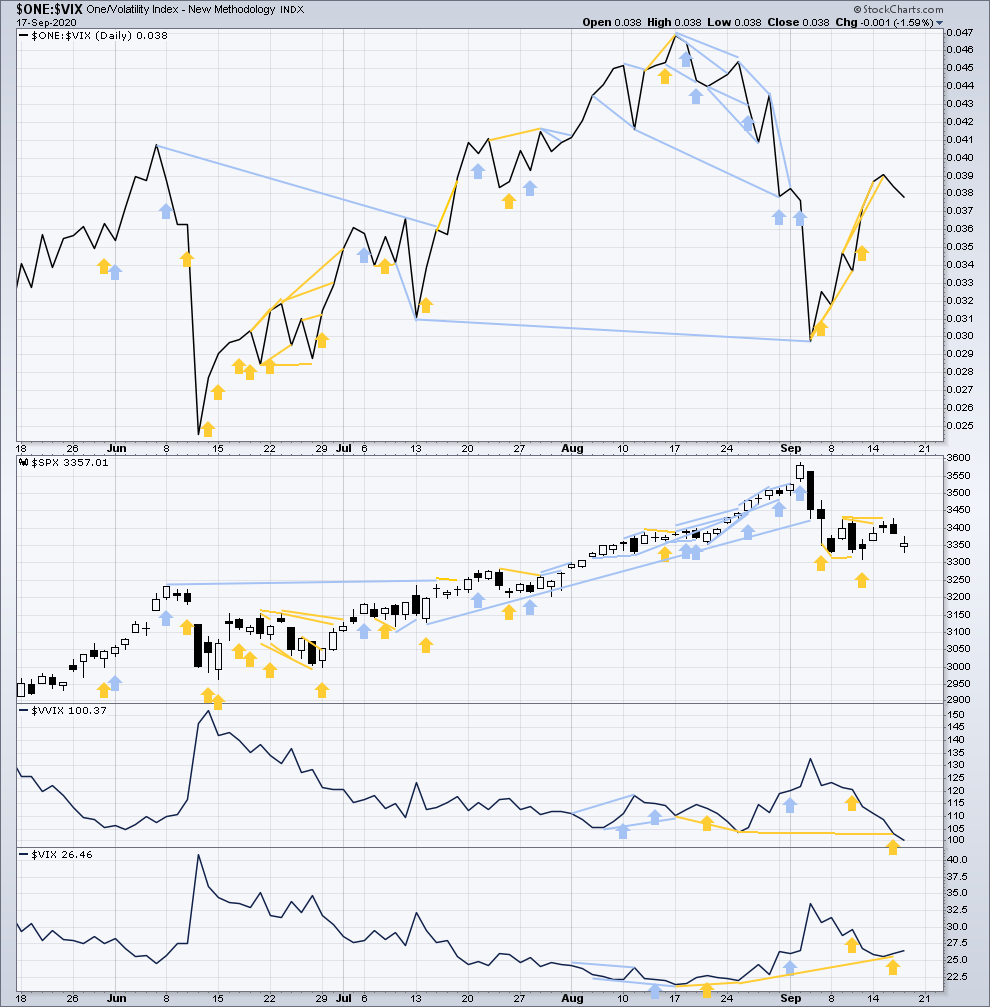
Click chart to enlarge. Chart courtesy of StockCharts.com. So that colour blind members are included, bearish signals will be noted with blue and bullish signals with yellow.
Today both price and inverted VIX have moved lower. While neither have made new short-term lows below the low of the 8th or 11th of September, inverted VIX remains much more elevated than price. This is bullish for price.
Comparing VIX and VVIX at the daily chart level: Today VIX has increased, but VVIX has declined. This divergence is bullish for price. However, there are three prior examples on this chart and only two of those three were followed by upwards movement from price the following day. This signal may not be reliable. It would tend to support the alternate Elliott wave count, which sees the pullback over.
DOW THEORY
Dow Theory still concludes a bear market is in place.
Dow Theory confirmed a bear market with the following lows made on a closing basis:
DJIA: 21,712.53 – a close below this point was been made on the March 12, 2020.
DJT: 8,636.79 – a close below this point was been made on March 9, 2020.
Adding in the S&P and Nasdaq for an extended Dow Theory, a bear market was confirmed:
S&P500: 2,346.58 – a close below this point was made on March 20, 2020.
Nasdaq: 7,292.22 – a close below this point was made on the March 12, 2020.
At this time, to shift Dow Theory from viewing a bear market to confirmation of a new bull market would require new highs made on a closing basis:
DJIA: 29,568.57
DJT: 11,623.58
Adding in the S&P and Nasdaq for an extended Dow Theory, confirmation of a bull market would require new highs made on a closing basis:
S&P500: 3,393.52 – closed above on 21st August 2020.
Nasdaq: 9,838.37 – closed above on June 8, 2020.
Published @ 05:55 p.m. ET.
—
Careful risk management protects your trading account(s).
Follow my two Golden Rules:
1. Always trade with stops.
2. Risk only 1-5% of equity on any one trade.
—
New updates to this analysis are in bold.