by Lara | Oct 9, 2020 | S&P 500, S&P 500 + DJIA
S&P 500: Elliott Wave and Technical Analysis | Charts – October 9, 2020 Upwards movement continues as the first Elliott wave count expects. The target remains the same. Summary: A target for primary wave 3 to end is now at 4,606. The invalidation point is moved...
by Lara | Oct 8, 2020 | S&P 500, S&P 500 + DJIA
S&P 500: Elliott Wave and Technical Analysis | Charts – October 8, 2020 A new all time high from the AD line, a bullish signal from On Balance Volume, and now two back to back 80% up days sees the first two short-term Elliott wave counts discarded in favour of...
by Lara | Oct 7, 2020 | S&P 500, S&P 500 + DJIA
S&P 500: Elliott Wave and Technical Analysis | Charts – October 7, 2020 An upwards day remains below the prior high. Today the AD line has moved strongly higher. If it continues higher tomorrow, then that may offer support for the alternate Elliott wave count....
by Lara | Oct 6, 2020 | S&P 500, S&P 500 + DJIA
S&P 500: Elliott Wave and Technical Analysis | Charts – October 6, 2020 The next short-term target at 3,437 was almost met. Price fell 5.44 points short of the target before turning lower today. Summary: For the mid term, primary wave 2 may not be over. It may...
by Lara | Oct 5, 2020 | S&P 500, S&P 500 + DJIA
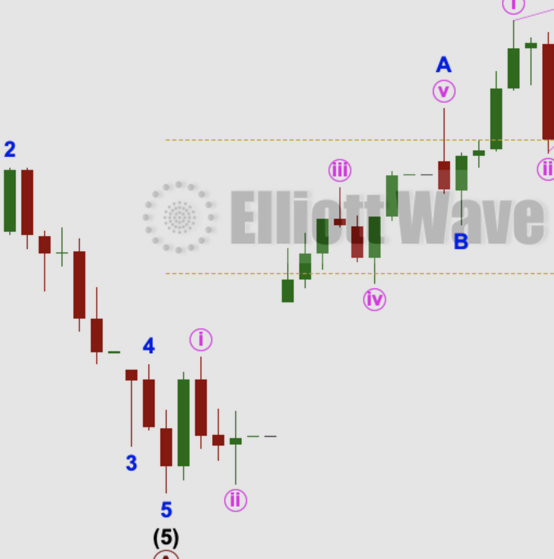
S&P 500: Elliott Wave and Technical Analysis | Charts – October 5, 2020 For the very short term, some upwards movement was expected to begin the new trading week. This is exactly what has happened. The short-term target remains the same. Summary: For the short...

by Lara | Oct 2, 2020 | Gold, Lara's Weekly, S&P 500, US Oil
Lara’s Weekly: Elliott Wave and Technical Analysis of S&P500 and Gold and US Oil | Charts – October 2, 2020 Commentary and charts of Lara’s Weekly, an end of week Elliott Wave and Technical Analysis of the S&P 500 and GOLD and USOIL, for week...
by Lara | Oct 2, 2020 | S&P 500, S&P 500 + DJIA
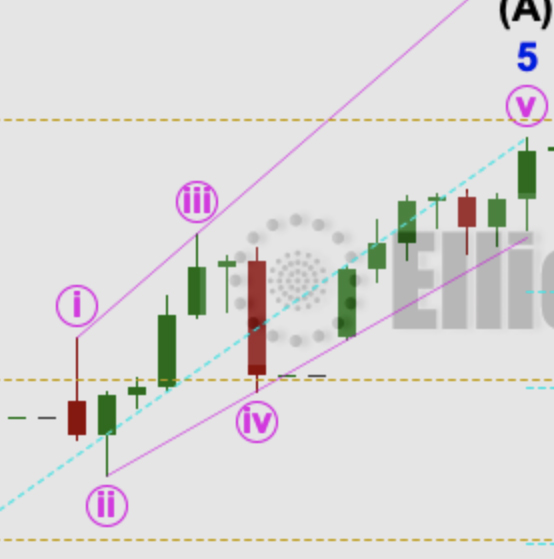
S&P 500: Elliott Wave and Technical Analysis | Charts – October 2, 2020 Another small range day moves price slightly lower. At the end of this week, the monthly technical analysis chart is analysed. Summary: For the short term, some upwards movement may unfold...

by Lara | Oct 1, 2020 | S&P 500, S&P 500 + DJIA
S&P 500: Elliott Wave and Technical Analysis | Charts – October 1, 2020 A very small range day closed as a doji candlestick. The Elliott wave counts remain the same. Summary: For the mid term, primary wave 2 may not be over. It may continue overall lower as a...

by Lara | Sep 30, 2020 | S&P 500, S&P 500 + DJIA
S&P 500: Elliott Wave and Technical Analysis | Charts – September 30, 2020 Today both the AD line and VIX suggest the direction for price tomorrow. Summary: For the very short term, expect some downwards movement for tomorrow, at least. This may be a small B...


