
S&P 500: Elliott Wave and Technical Analysis | Charts – October 6, 2020
The next short-term target at 3,437 was almost met. Price fell 5.44 points short of the target before turning lower today.
Summary: For the mid term, primary wave 2 may not be over. It may now move lower as a double zigzag (most likely) or sideways as a flat or double combination (requiring more upwards movement first).
Primary wave 2 may find support about 3,053 – 3,055 (most likely) or 2,725. Thereafter, the upwards trend to new all time highs may continue.
The second wave count considers the possibility that a once in multi-generations trend change may have occurred. Some confidence in this wave count would come with invalidation of the first wave count below 2,191.86.
At this stage, a new high above 3,588.11 would invalidate the second very bearish Elliott wave count, leaving only a bullish Elliott wave count.
The biggest picture, Grand Super Cycle analysis, is here.
Monthly charts are here, with video here.
ELLIOTT WAVE COUNTS
FIRST WAVE COUNT
WEEKLY CHART
Click chart to enlarge.
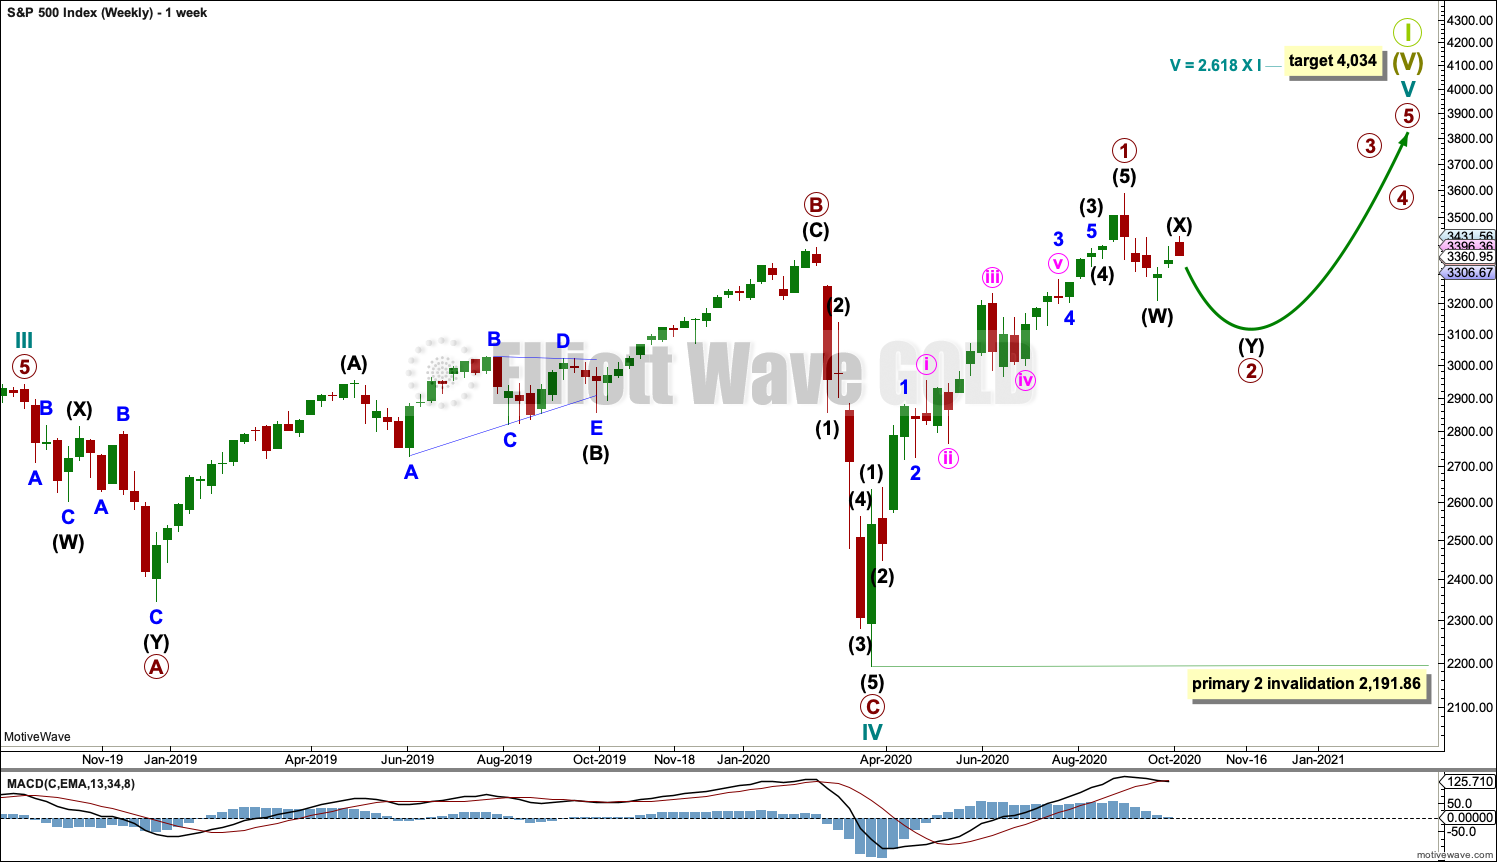
Cycle wave V may last from one to several years. So far it has lasted 6 months.
Cycle wave V would most likely subdivide as an impulse. But if overlapping develops, then an ending diagonal should be considered. This chart considers the more common impulse.
Primary wave 1 may be complete. Primary wave 2 may not move beyond the start of primary wave 1 below 2,191.86.
There is already a Fibonacci ratio between cycle waves I and III within Super Cycle wave (V). The S&P500 often exhibits a Fibonacci ratio between two of its actionary waves but rarely between all three; it is less likely that cycle wave V would exhibit a Fibonacci ratio. The target for Super Cycle wave (V) to end would best be calculated at primary degree, but that cannot be done until all of primary waves 1, 2, 3 and 4 are complete. The target at 4,034 is provisional, so it may change.
DAILY CHART
Click chart to enlarge.
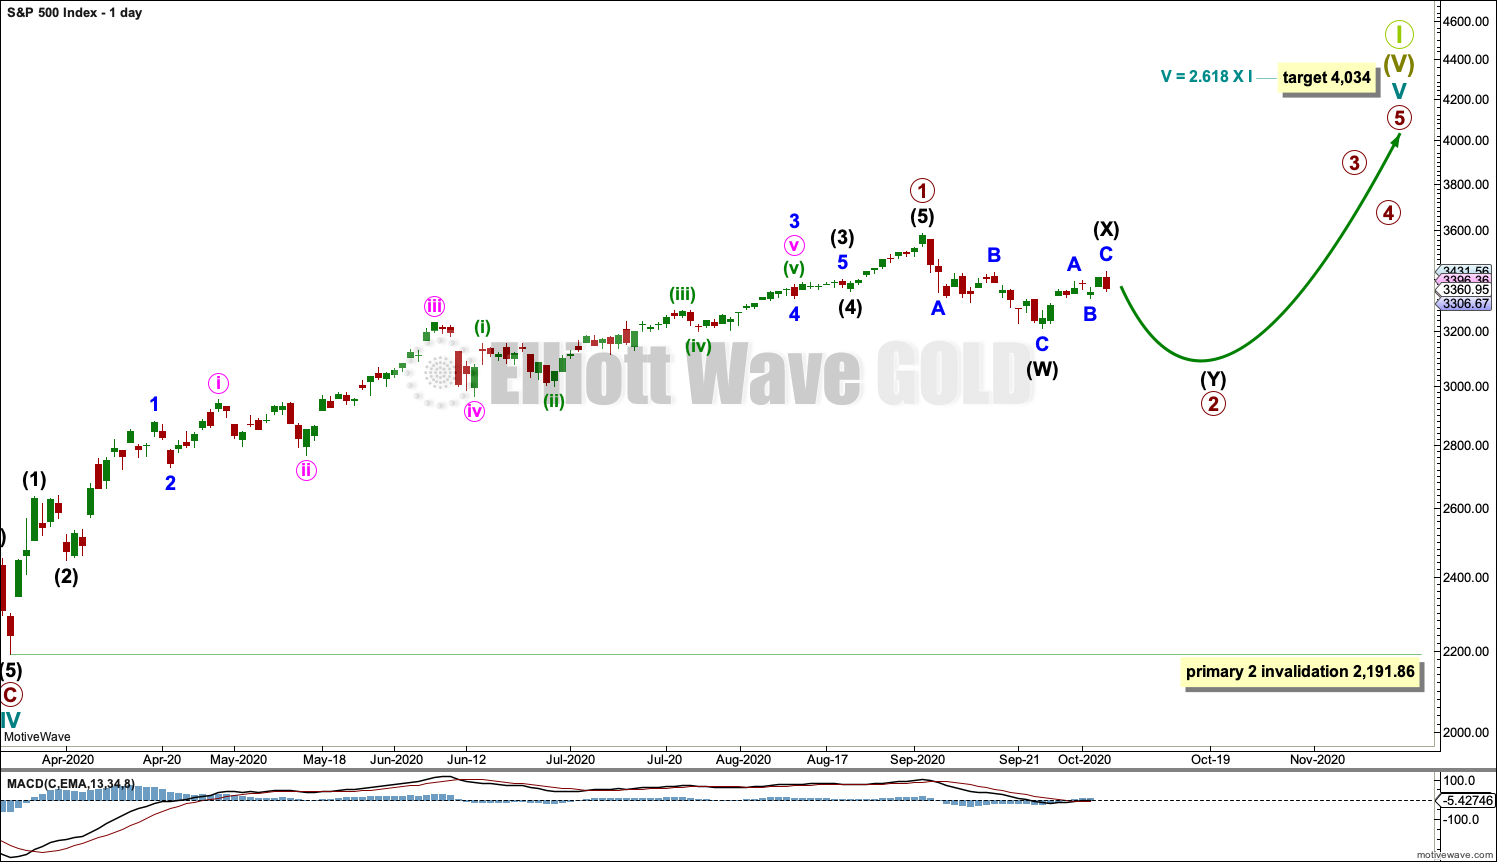
Primary wave 1 may be over and primary wave 2 may be underway.
Primary wave 2 may be a multi-week pullback or consolidation. Primary wave 2 may not move beyond the start of primary wave 1 below 2,191.86.
For the S&P500, the first multi-week second wave correction within a new trend is not always very deep. Two examples from prior bull markets: after the bear market of October 1987, the first multi-week second wave in the following bull market ended in September 1990 and was only a 0.49 correction of its corresponding first wave, and more recently the last bull market beginning in March 2009 saw its first multi-week second wave correction end in June 2009, which was only a 0.30 correction of its corresponding first wave.
The 0.236 Fibonacci ratio of primary wave 1 at 3,258.59 has been passed. The next target is now the 0.382 Fibonacci ratio at 3,054.74. If price falls through that preferred target, then the 0.618 Fibonacci ratio at 2,725.23 would be the next target.
Primary wave 2 may now be continuing as a double zigzag or double combination, or as a single flat. The daily chart labels primary wave 2 as a possible double zigzag; this now looks like the most likely structure to be unfolding, but this labelling may change as primary wave 2 continues to unfold. For the short term, a little upwards movement today may have completed intermediate wave (X).
It is also possible that primary wave 2 may be over, but this looks less likely.
HOURLY CHART – DOUBLE ZIGZAG OR DOUBLE COMBINATION
Click chart to enlarge.
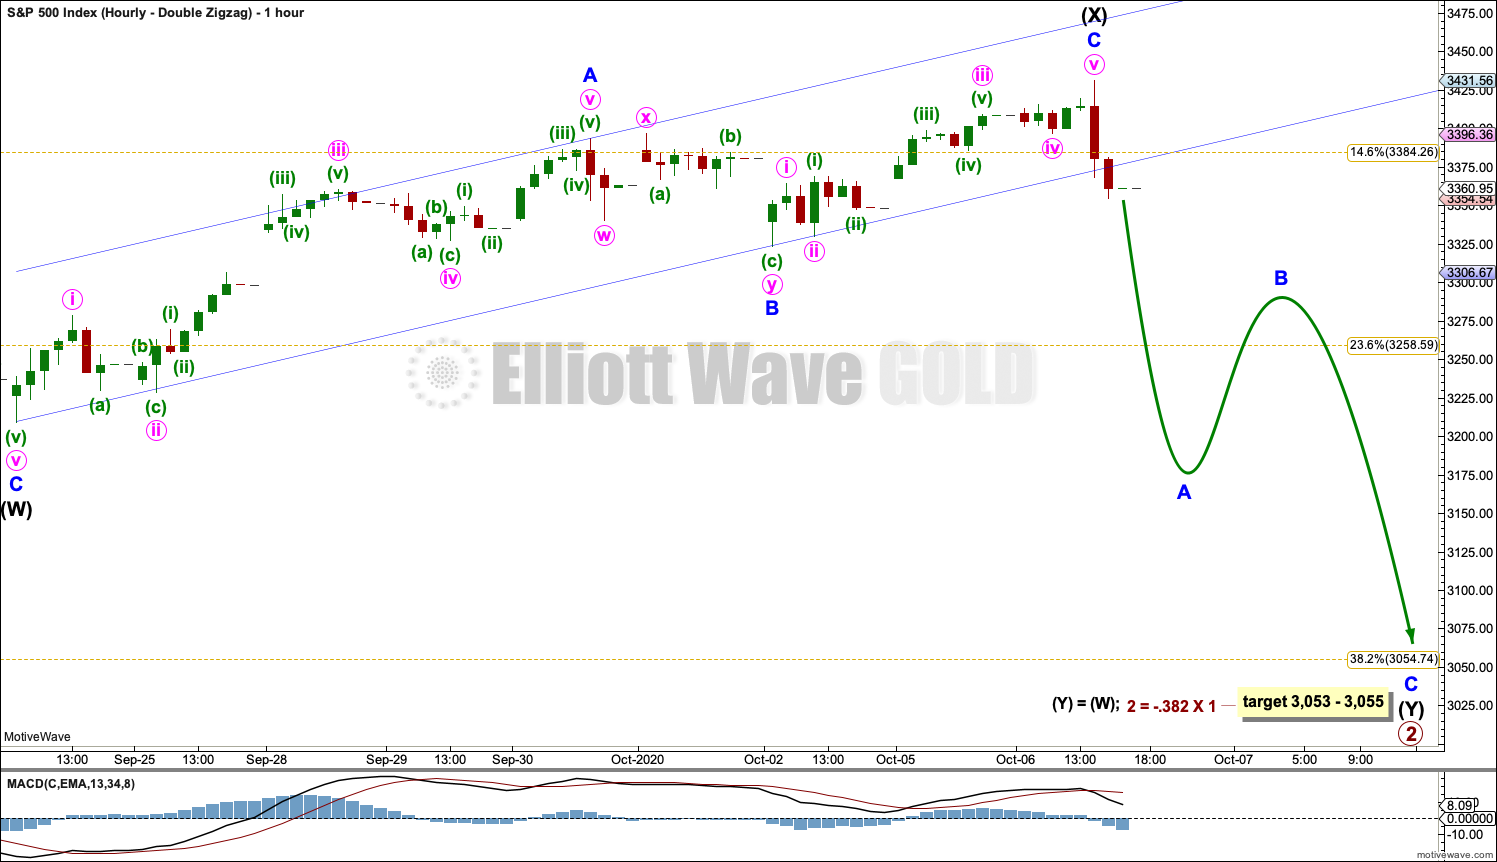
If primary wave 2 is unfolding as a double, then the first structure in a double may be complete as a zigzag and labelled intermediate wave (W).
The double may now be joined by a three in the opposite direction, a zigzag labelled intermediate wave (X), which may now be a complete zigzag. The channel drawn about intermediate wave (X) is breached but not with confidence. If tomorrow opens with a full red candlestick below and not touching the lower trend line, then that would add further confidence in this hourly wave count.
A target is now calculated for intermediate wave (Y).
If intermediate wave (X) is complete, then it is relatively shallow. This indicates a double zigzag for primary wave 2 rather than a double combination. Double zigzags normally have shallow X waves, whereas double combinations normally have deep X waves.
Intermediate wave (Y) now looks most likely to unfold lower as a zigzag. The purpose of the second zigzag in a double is to deepen the correction when the first zigzag does not move price deep enough.
HOURLY CHART – FLAT
Click chart to enlarge.
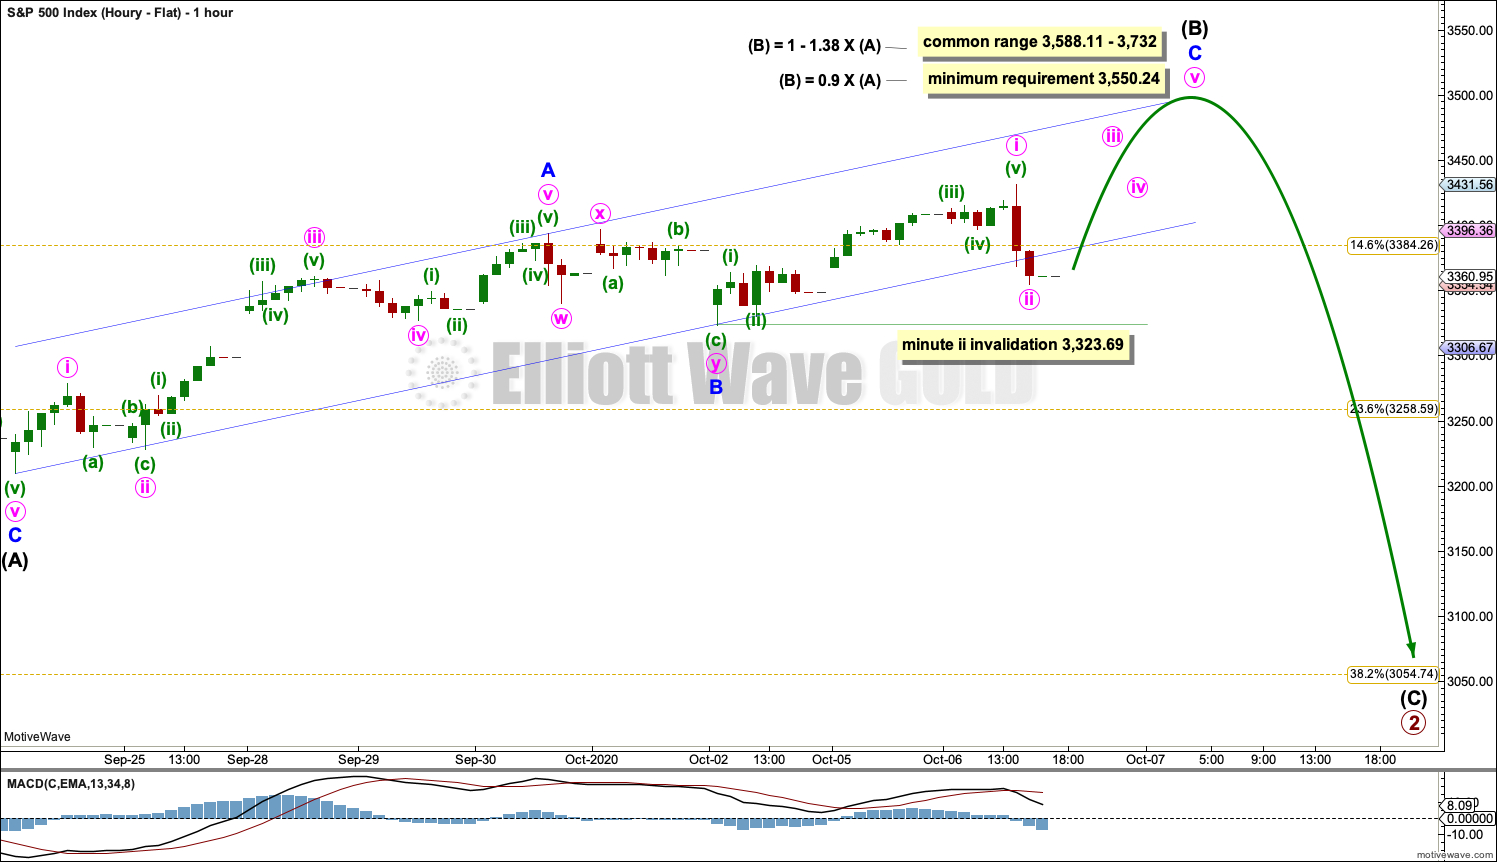
It is still possible that primary wave 2 may continue sideways as a flat correction.
Intermediate wave (A) within a flat correction must subdivide as a three; it may be a complete zigzag. Intermediate wave (B) should then unfold higher as a three; it may make a new price extreme beyond the start of intermediate wave (A) at 3,588.11, as in an expanded flat.
Intermediate wave (B) must continue higher to meet the minimum requirement of a 0.9 length of intermediate wave (A) at 3,550.24. Minor waves A and B within intermediate wave (B) may be complete. Minute wave ii within minor wave C may not move beyond the start of minute wave i below 3,323.69.
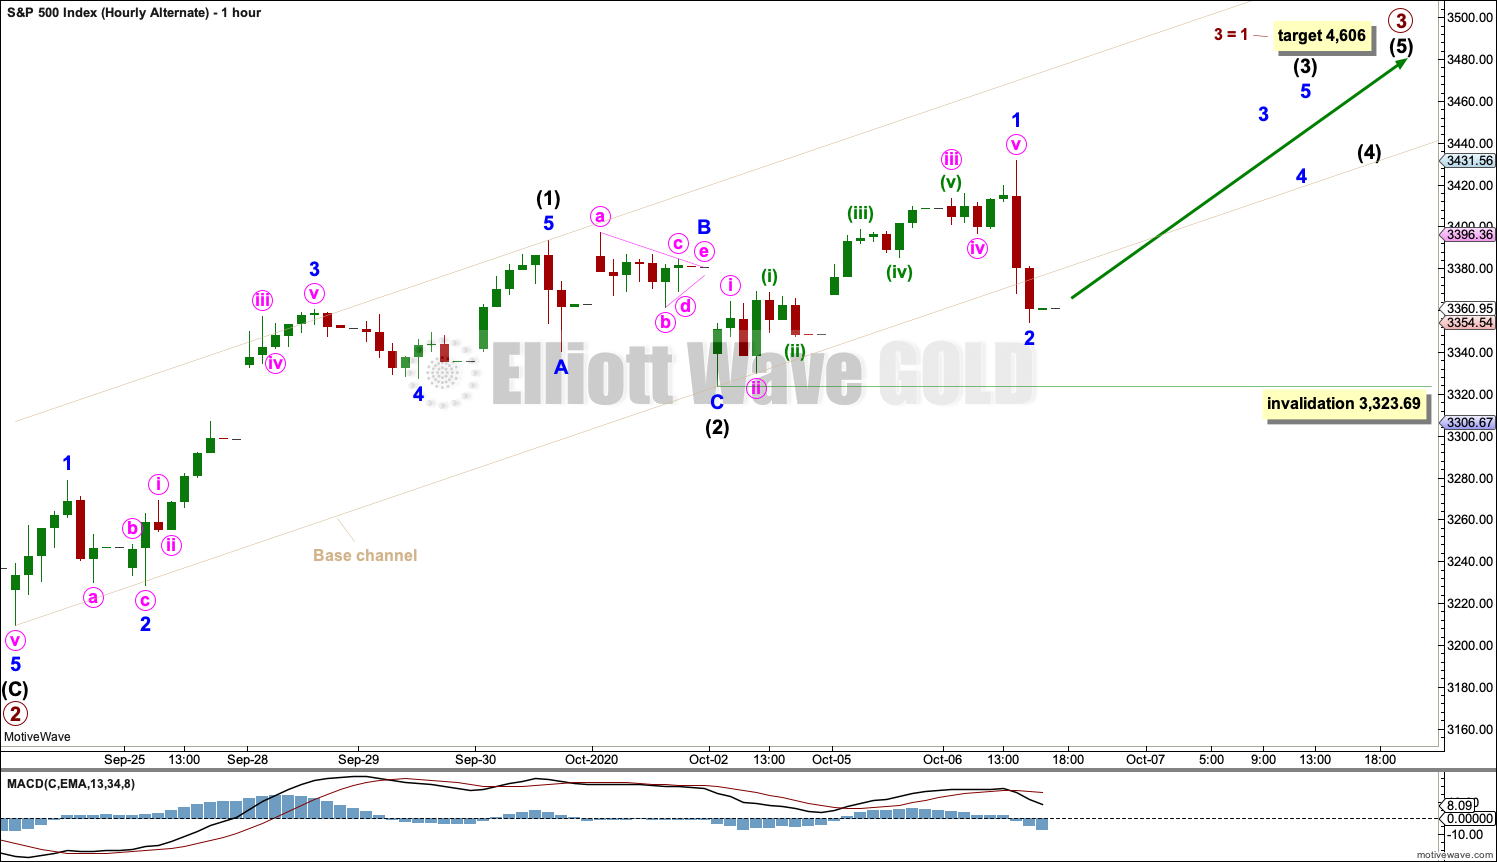
ALTERNATE HOURLY CHART
Click chart to enlarge.
It is also possible that primary wave 2 was over as a relatively brief and shallow 0.27 zigzag. This alternate wave count is published as the least likely short-term wave count.
Primary wave 3 may only subdivide as an impulse. Intermediate waves (1) and (2) within primary wave 3 may be incomplete. Intermediate wave (3) may have begun.
Intermediate wave (3) may only subdivide as an impulse. Minor wave 1 within intermediate wave (3) may be complete. Minor wave 2 may not move beyond the start of minor wave 1 below 3,323.69.
Draw a base channel about intermediate waves (1) and (2). Along the way up, corrections may find support about the lower edge of the base channel. A breach of the base channel reduces the probability of this wave count.
SECOND WAVE COUNT
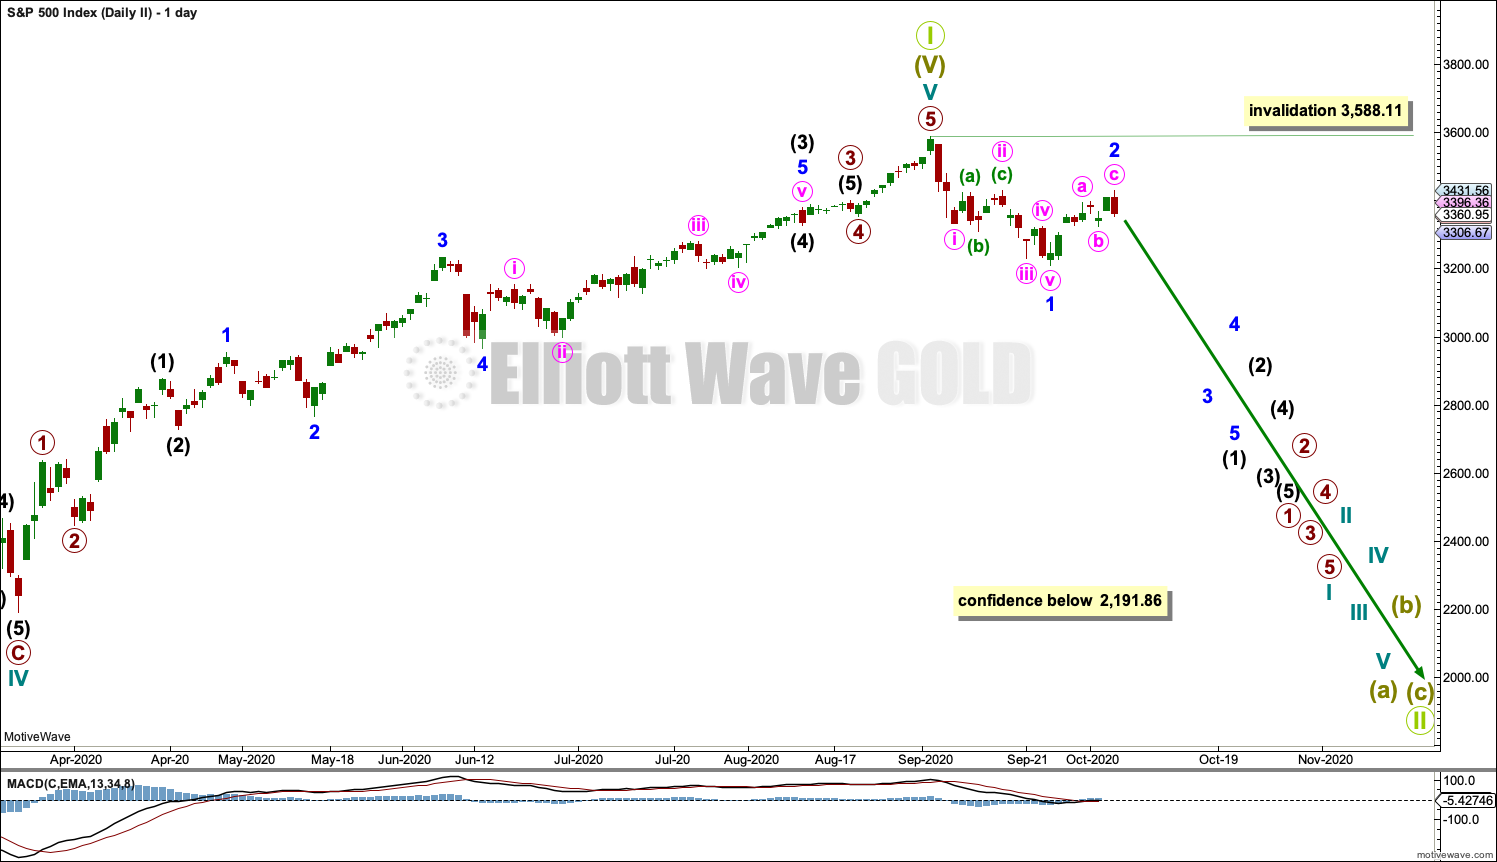
DAILY CHART
Click chart to enlarge.
This wave count is the same as the first wave count with the exception of the degree of labelling within cycle wave V. If the degree of labelling is moved up one degree, then it is possible that cycle wave V to end Super cycle wave (V) to end Grand Super Cycle wave I is complete.
A new low below 2,191.86 would add confidence in this wave count. At that stage, the first wave count would be invalidated.
A new bear market at Grand Super Cycle degree may be expected to last over a decade. It may take price below the start of Super Cycle wave (V) at 666.79 in March 2009.
A first five down, labelled minor wave 1, may be complete. Minor wave 2 now also may be complete at today’s high. A third wave down at minor degree may just have begun. It should exhibit strength if this wave count is correct.
Major new downwards trends for this market usually begin with strength. The lack of any 90% down days or back to back 80% down days reduces the probability of this wave count.
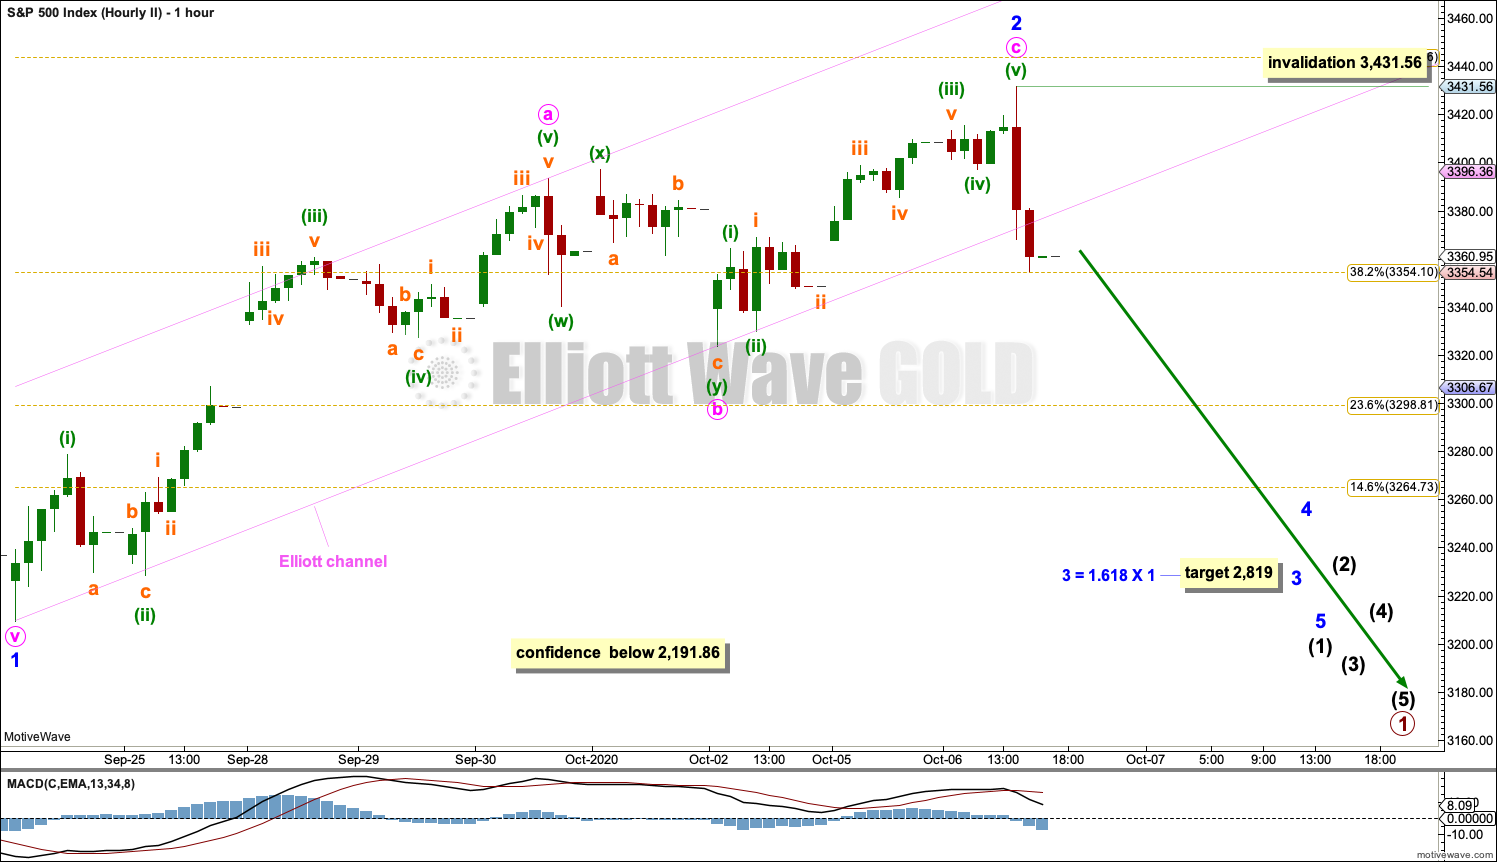
HOURLY CHART
Click chart to enlarge.
Minor wave 2 may be a complete zigzag.
Minor wave 3 may only subdivide as an impulse. A target is calculated for minor wave 3 to end, which expects it to exhibit a common Fibonacci ratio to minor wave 1. No second wave correction within minor wave 3 may move beyond its start above 3,431.56.
TECHNICAL ANALYSIS
WEEKLY CHART
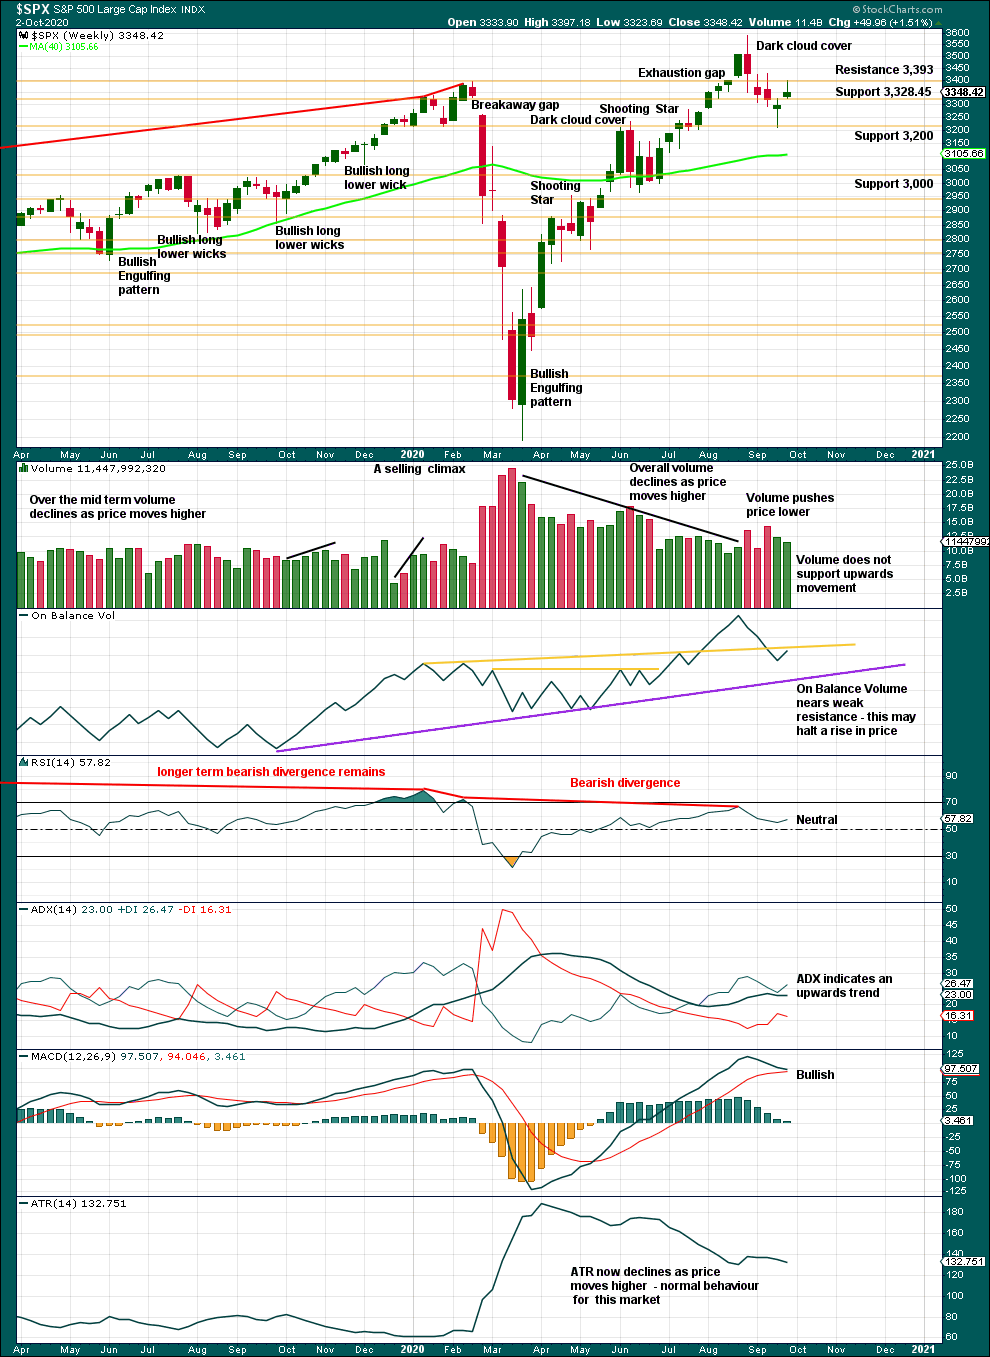
Click chart to enlarge. Chart courtesy of StockCharts.com.
A small range week with a longer upper wick and declining volume is not convincing for bulls last week. With a lack of support for upwards movement, it looks like the pullback may continue lower.
DAILY CHART
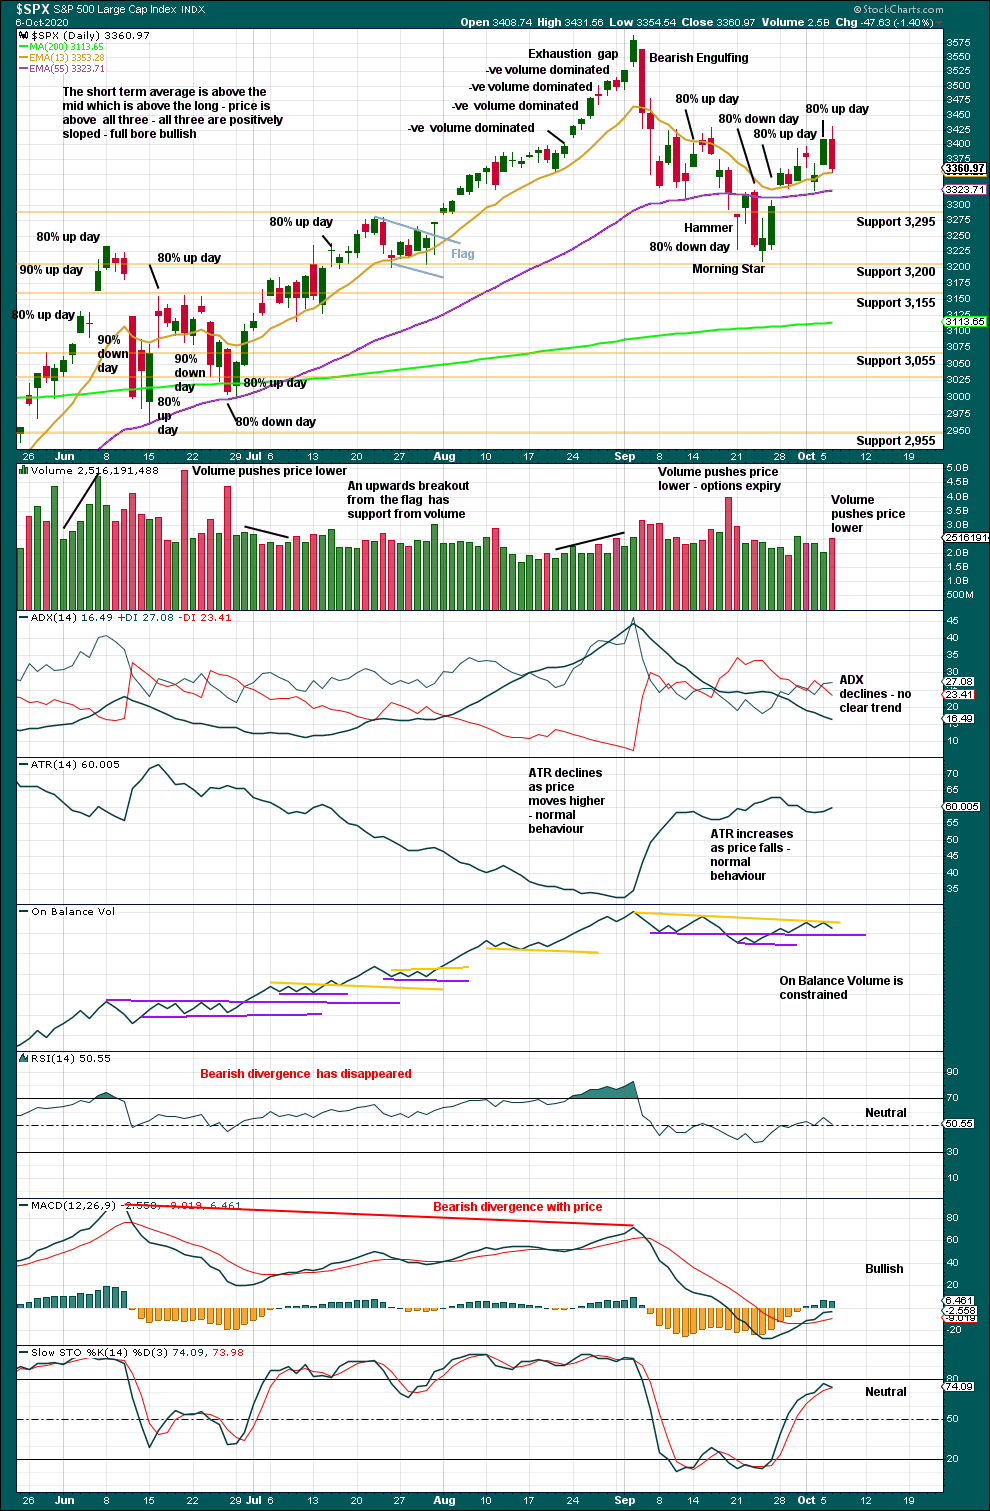
Click chart to enlarge. Chart courtesy of StockCharts.com.
At this stage, upwards movement of this week still lacks enough strength to have confidence that a sustainable low may be in place.
This supports the main Elliott wave count view that a pullback may continue lower.
This view remains. There is still no 90% up day nor back to back 80% up days to indicate the resumption of buying power.
BREADTH – AD LINE
WEEKLY CHART
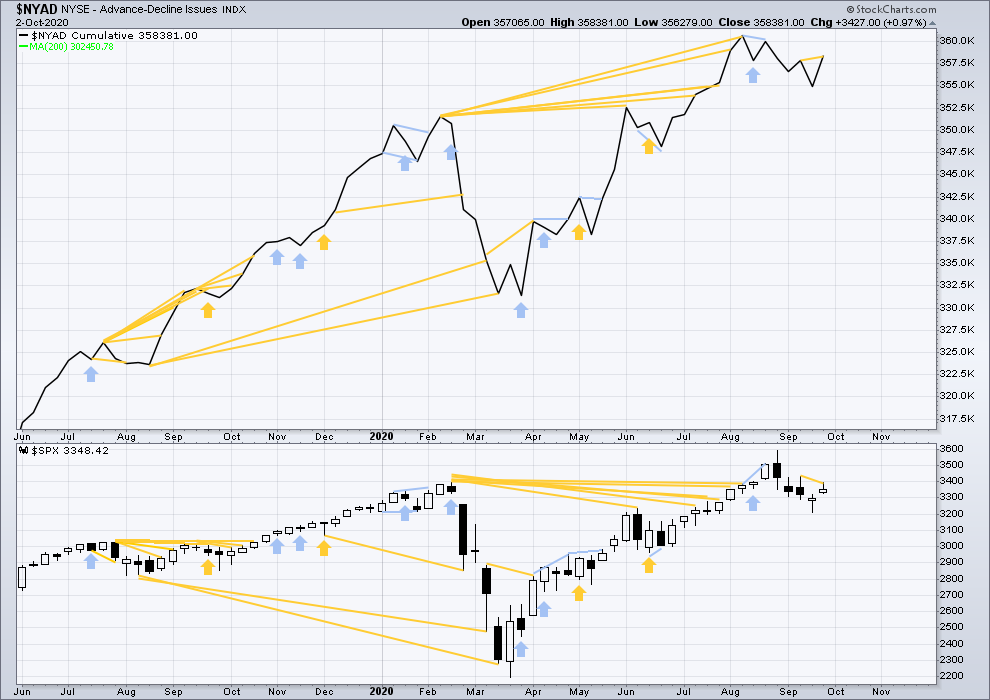
Click chart to enlarge. Chart courtesy of StockCharts.com. So that colour blind members are included, bearish signals will be noted with blue and bullish signals with yellow.
Breadth should be read as a leading indicator.
Lowry’s Operating Companies Only AD line has still not made new all time highs. The last high for the OCO AD line was in the week beginning January 13, 2020. There was 7 and a half months of bearish divergence between price and the OCO AD line at the September high. This may now support the more bearish second wave count. It is possible now that a major trend change may have occurred.
The NYSE All Issues AD line made new highs in the week beginning 1st of June.
Last week the AD line has made a new short-term high above the high of two weeks prior, but price has not. This divergence is bullish for the short term.
Large caps all time high: 3,588.11 on September 2, 2020.
Mid caps all time high: 2,109.43 on February 20, 2020.
Small caps all time high: 1,100.58 on August 27, 2018.
This rise has been led by large caps, which is a feature of an aged bull market. Only large caps have made new highs above the last swing high of the 11th of August.
DAILY CHART
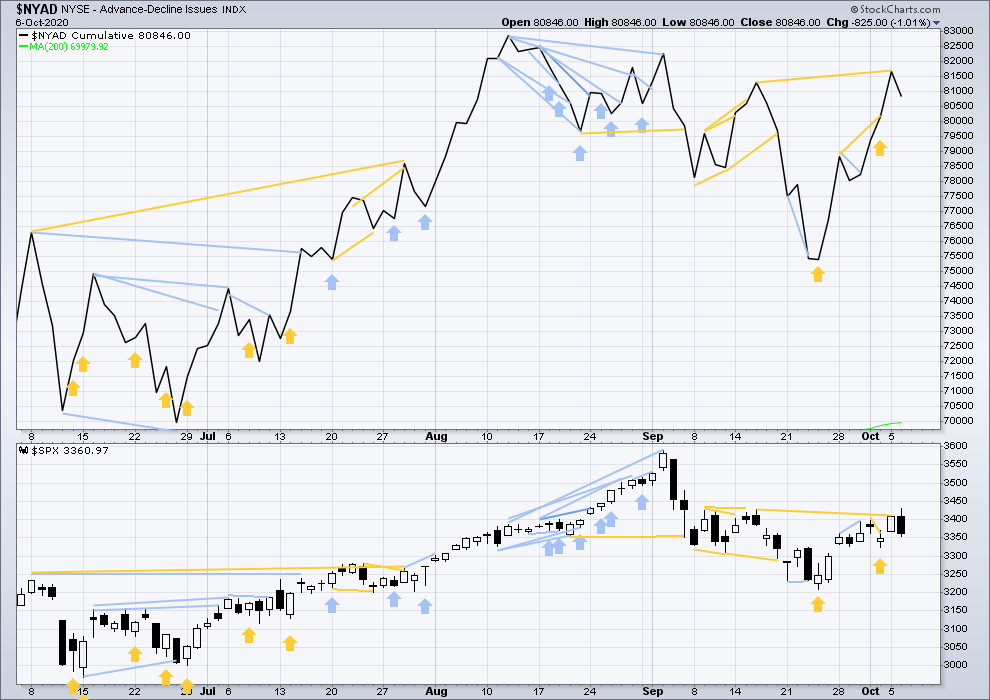
Click chart to enlarge. Chart courtesy of StockCharts.com. So that colour blind members are included, bearish signals will be noted with blue and bullish signals with yellow.
Yesterday’s short-term bullish divergence has been followed by upwards movement and a new short-term swing high. This divergence may now be resolved.
Today both price and the AD line have moved lower. There is no new divergence.
If the AD line makes a new all time high prior to price, then that would indicate the pullback was over and support the alternate hourly wave count.
VOLATILITY – INVERTED VIX CHART
WEEKLY CHART
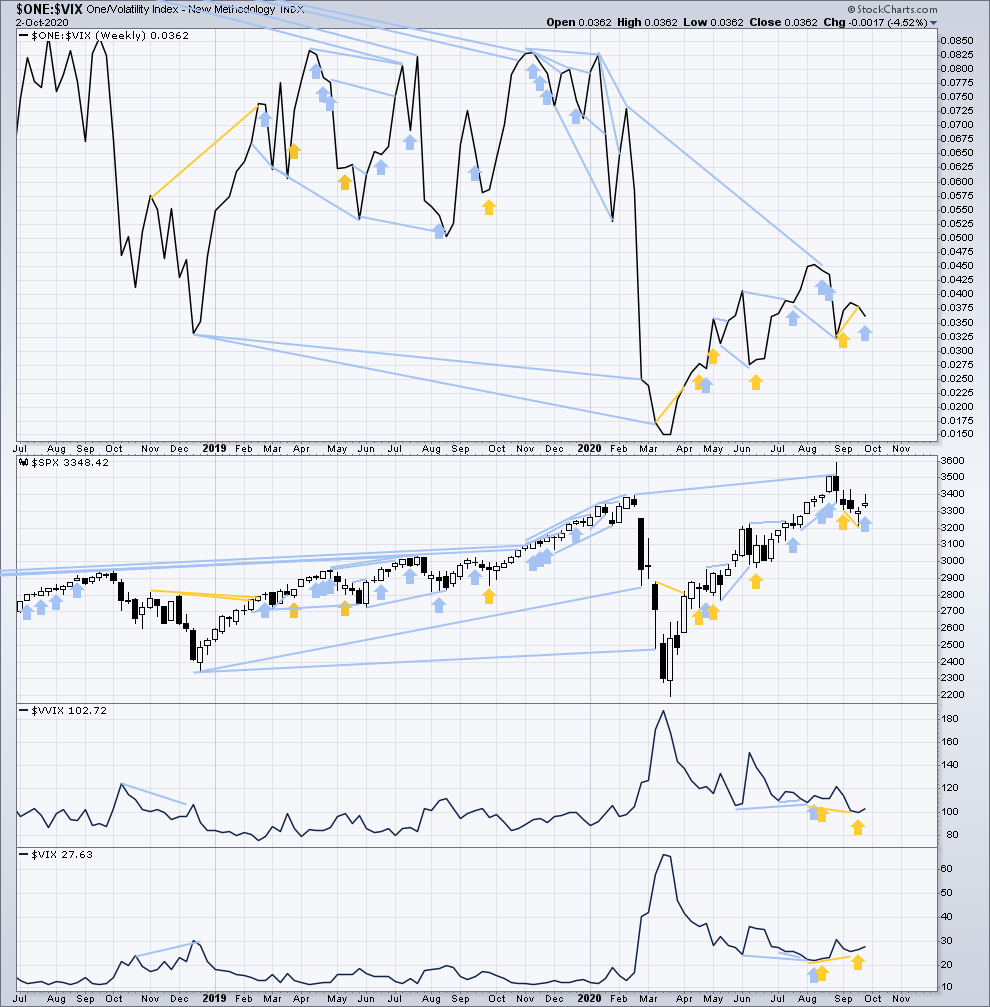
Click chart to enlarge. Chart courtesy of StockCharts.com. So that colour blind members are included, bearish signals will be noted with blue and bullish signals with yellow.
Inverted VIX remains well below all time highs. The all time high for inverted VIX was in the week beginning October 30, 2017. There is nearly 3 years of bearish divergence between price and inverted VIX. There is all of long, mid and short-term bearish divergence.
Last week price has moved higher, but inverted VIX has declined. This divergence is bearish for the short term. It will be given less weight than the AD line though as the AD line tends to be more reliable.
Comparing VIX and VVIX: Last week both have moved higher. There is no new divergence.
DAILY CHART
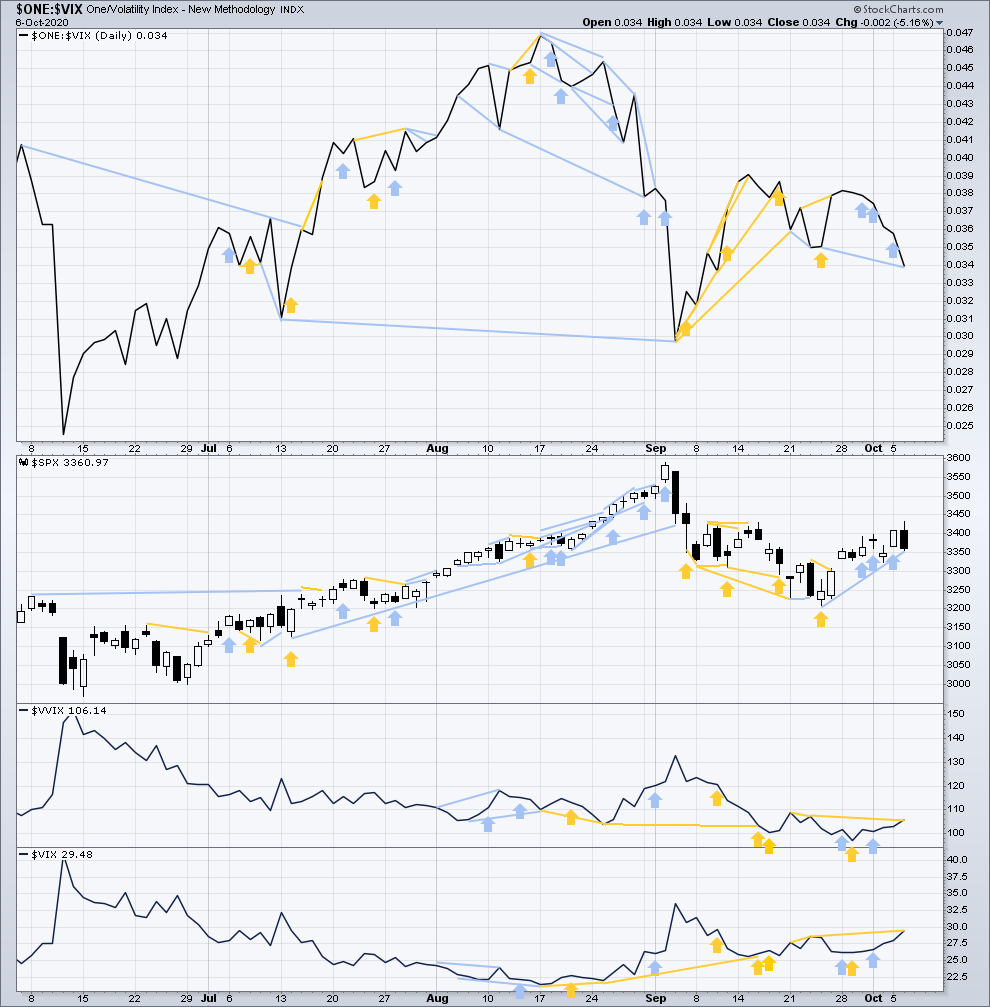
Click chart to enlarge. Chart courtesy of StockCharts.com. So that colour blind members are included, bearish signals will be noted with blue and bullish signals with yellow.
Today both price and inverted VIX have moved lower. Inverted VIX has made a new low below the low of the 24th of September, but price has not. This divergence is bearish for the short term.
Inverted VIX remains well above lows of the 3rd to 8th of September, but price is below. This divergence remains bullish.
Comparing VIX and VVIX at the daily chart level: Both VIX and VVIX have moved higher for Tuesday. VIX has made a new short-term swing high above the 23rd of September, but VVIX has not. Volatility of VIX is not rising as fast as VIX, which is bullish for the short term for price.
DOW THEORY
Dow Theory still concludes a bear market is in place.
Dow Theory confirmed a bear market with the following lows made on a closing basis:
DJIA: 21,712.53 – a close below this point was been made on the March 12, 2020.
DJT: 8,636.79 – a close below this point was been made on March 9, 2020.
Adding in the S&P and Nasdaq for an extended Dow Theory, a bear market was confirmed:
S&P500: 2,346.58 – a close below this point was made on March 20, 2020.
Nasdaq: 7,292.22 – a close below this point was made on the March 12, 2020.
At this time, to shift Dow Theory from viewing a bear market to confirmation of a new bull market would require new highs made on a closing basis:
DJIA: 29,568.57
DJT: 11,623.58
Adding in the S&P and Nasdaq for an extended Dow Theory, confirmation of a bull market would require new highs made on a closing basis:
S&P500: 3,393.52 – closed above on 21st August 2020.
Nasdaq: 9,838.37 – closed above on June 8, 2020.
Published @ 06:26 p.m. ET.
—
Careful risk management protects your trading account(s).
Follow my two Golden Rules:
1. Always trade with stops.
2. Risk only 1-5% of equity on any one trade.
—
New updates to this analysis are in bold.