by Lara | Jul 31, 2020 | S&P 500, S&P 500 + DJIA
S&P 500: Elliott Wave and Technical Analysis | Charts – July 31, 2020 Price at the end of the week has been unable to break out of a range with support about 3,200 and resistance about 3,280. VIX and VVIX give a slight signal that supports the main Elliott wave...
by Lara | Jul 30, 2020 | S&P 500, S&P 500 + DJIA
S&P 500: Elliott Wave and Technical Analysis | Charts – July 30, 2020 Price remains range bound with support about 3,200 and resistance about 3,280. Summary: It is possible that the bounce is over and the bear market has resumed. A new low below 3,127.66 would...
by Lara | Jul 29, 2020 | S&P 500, S&P 500 + DJIA
S&P 500: Elliott Wave and Technical Analysis | Charts – July 29, 2020 Upwards movement today remains below the short-term invalidation point on the hourly chart. Summary: With the best fit channel breached, it is possible that the bounce is over and the bear...
by Lara | Jul 28, 2020 | S&P 500, S&P 500 + DJIA
S&P 500: Elliott Wave and Technical Analysis | Charts – July 28, 2020 The very short-term expectation was for a very little more upwards movement to about 3,249.45 before a reversal. Today price reached up to 3,243.72 before sharply reversing at the end of the...
by Lara | Jul 27, 2020 | S&P 500, S&P 500 + DJIA
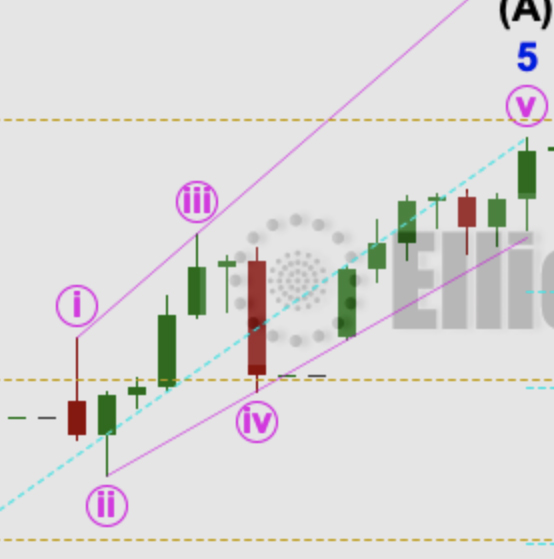
S&P 500: Elliott Wave and Technical Analysis | Charts – July 27, 2020 Last analysis expected the new trading week to begin with a little upwards movement, which is what has happened. Summary: With the best fit channel breached, it is possible that the bounce is...
by Lara | Jul 25, 2020 | Public Analysis, Russell 2000, Russell 2000 Historical
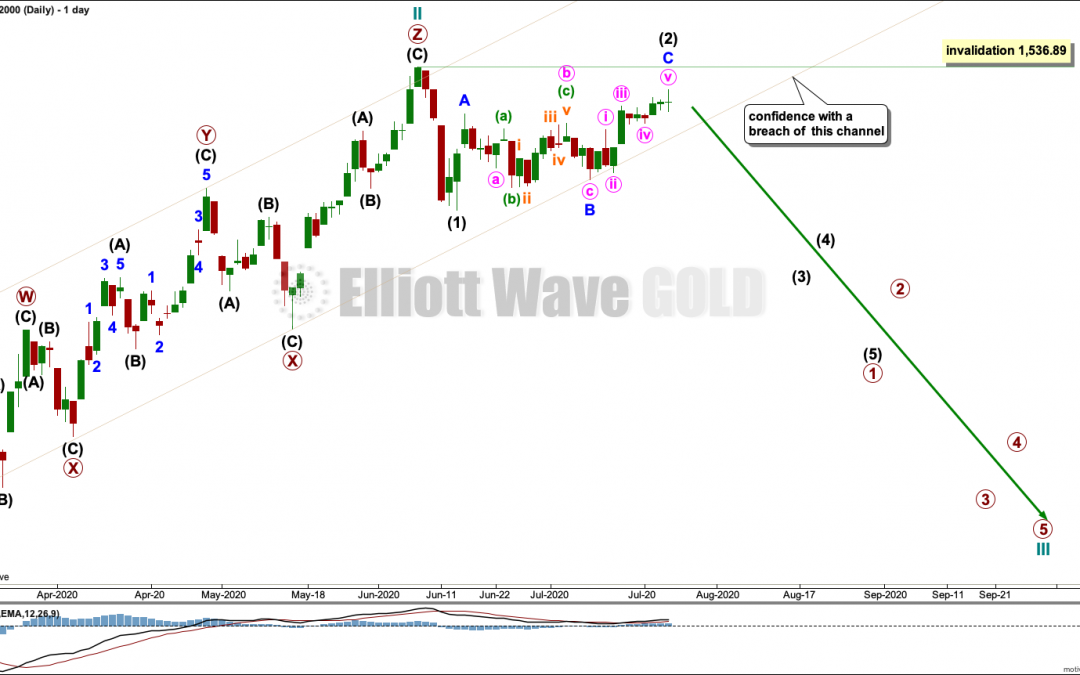
Russell 2000: Elliott Wave Analysis | Charts – July 24, 2020 The bounce may be over. Summary: A target for a third wave down is at 326. The channel on the daily chart must be breached for any confidence in this view. A new high above 1,715.08 would indicate a more...
by Lara | Jul 25, 2020 | Gold, Lara's Weekly, S&P 500, US Oil
Lara’s Weekly: Elliott Wave and Technical Analysis of S&P500 and Gold and US Oil | Charts – July 24, 2020 Commentary and charts of Lara’s Weekly, an end of week Elliott Wave and Technical Analysis of the S&P 500 and GOLD and USOIL, for week...
by Lara | Jul 24, 2020 | S&P 500, S&P 500 + DJIA
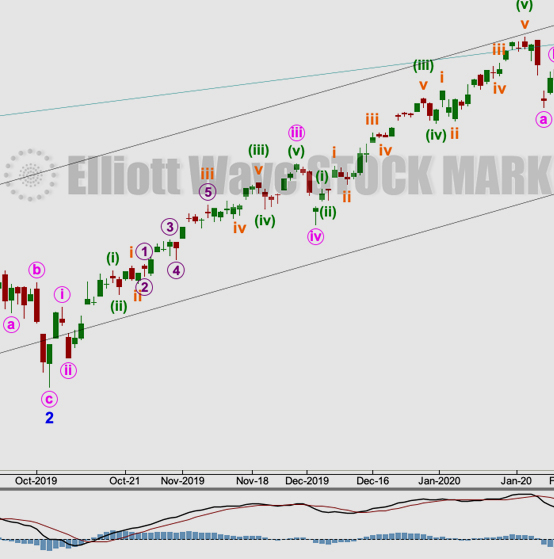
S&P 500: Elliott Wave and Technical Analysis | Charts – July 24, 2020 While both short-term Elliott wave counts remain valid, a channel breach on Friday suggests they may be swapped over. Summary: With the best fit channel breached, it is possible that the bounce...

by Lara | Jul 23, 2020 | S&P 500, S&P 500 + DJIA
S&P 500: Elliott Wave and Technical Analysis | Charts – July 23, 2020 Two short-term Elliott wave counts are provided for members. Invalidation of one would provide confidence in the other. Summary: While price remains within the best fit channel on the main...


