
by Lara | Oct 23, 2020 | Gold, Lara's Weekly, S&P 500, US Oil
Lara’s Weekly: Elliott Wave and Technical Analysis of S&P500 and Gold and US Oil | Charts – October 23, 2020 Commentary and charts of Lara’s Weekly, an end of week Elliott Wave and Technical Analysis of the S&P 500 and GOLD and USOIL, for week...
by Lara | Oct 23, 2020 | S&P 500, S&P 500 + DJIA
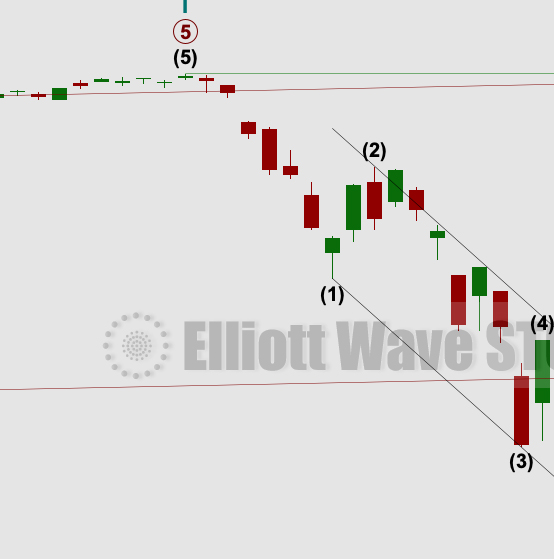
S&P 500: Elliott Wave and Technical Analysis | Charts – October 23, 2020 Upwards movement was expected for Friday’s session. A higher high and a higher low fits this expectation. Summary: The invalidation point is moved up to 3,209.45. The upwards trend may...

by Lara | Oct 22, 2020 | S&P 500, S&P 500 + DJIA
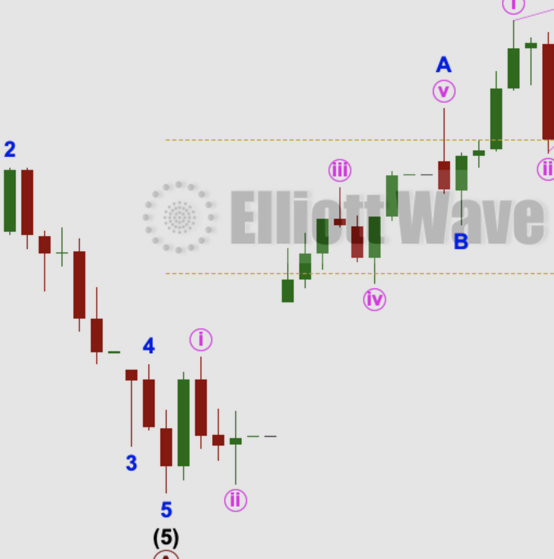
S&P 500: Elliott Wave and Technical Analysis | Charts – October 22, 2020 For the very short term, a little more downwards movement to a target at 3,418 was expected before a reversal and upwards movement. Today the session began with downwards movement to a low...
by Lara | Oct 21, 2020 | S&P 500, S&P 500 + DJIA
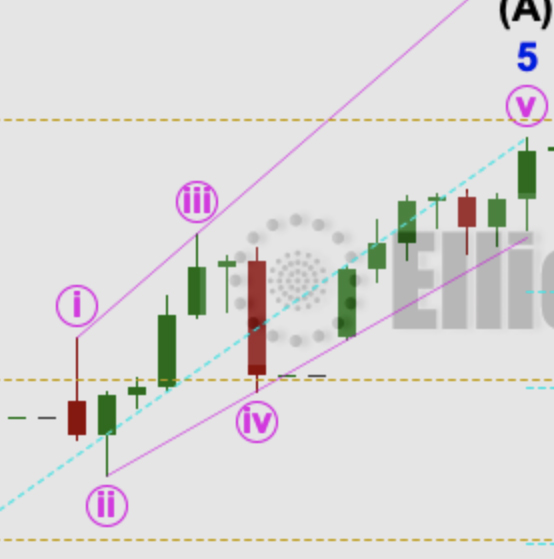
S&P 500: Elliott Wave and Technical Analysis | Charts – October 21, 2020 Another very small range day sees price move sideways. All three daily Elliott wave counts remain valid. Summary: The invalidation point is moved up to 3,209.45. For the very short term, a...
by Lara | Oct 20, 2020 | S&P 500, S&P 500 + DJIA
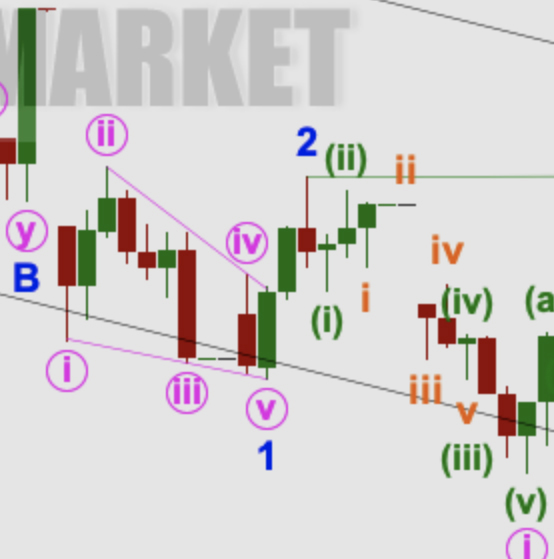
S&P 500: Elliott Wave and Technical Analysis | Charts – October 20, 2020 An inside day leaves all three daily Elliott wave counts the same. Summary: The invalidation point is moved up to 3,209.45. For the very short term, a very little more downwards movement may...
by Lara | Oct 19, 2020 | S&P 500, S&P 500 + DJIA
S&P 500: Elliott Wave and Technical Analysis | Charts – October 19, 2020 Downwards movement to a short-term target at 3,418 was expected for the start of the new trading week. A strong downwards session reached 3,419.93, just 1.93 points short of the target....

by Lara | Oct 16, 2020 | Gold, Lara's Weekly, S&P 500, US Oil
Lara’s Weekly: Elliott Wave and Technical Analysis of S&P500 and Gold and US Oil | Charts – October 16, 2020 Commentary and charts of Lara’s Weekly, an end of week Elliott Wave and Technical Analysis of the S&P 500 and GOLD and USOIL, for week...

by Lara | Oct 16, 2020 | S&P 500, S&P 500 + DJIA
S&P 500: Elliott Wave and Technical Analysis | Charts – October 16, 2020 An upwards week closes as a red doji candlestick. The short-term invalidation point is moved higher this week. Summary: The invalidation point is moved up to 3,209.45. For the very short...

by Lara | Oct 15, 2020 | S&P 500, S&P 500 + DJIA
S&P 500: Elliott Wave and Technical Analysis | Charts – October 15, 2020 Three new short-term Elliott wave counts are considered today. Summary: The invalidation point is moved up to 3,209.45. The hourly chart expects a little more downwards movement to about...


