by Lara | Mar 12, 2021 | S&P 500, S&P 500 + DJIA
S&P 500: Elliott Wave and Technical Analysis | Charts – March 12, 2021 Upwards movement this week fits expectations for the Elliott wave counts. Summary: The pullback may now be complete; the alternate hourly wave count, which looks at the possibility of the...
by Lara | Mar 11, 2021 | S&P 500, S&P 500 + DJIA
S&P 500: Elliott Wave and Technical Analysis | Charts – March 11, 2021 New all time highs were overall expected for the S&P. This rise is being led by small caps, which supports the Elliott wave count. Summary: The pullback may now be complete; the alternate...
by Lara | Mar 10, 2021 | S&P 500, S&P 500 + DJIA
S&P 500: Elliott Wave and Technical Analysis | Charts – March 10, 2021 Price again has moved higher, which was overall expected. Summary: The pullback may now be complete; next support may be the 0.382 Fibonacci ratio at 3,667 if it continues lower. Another new...
by Lara | Mar 9, 2021 | S&P 500, S&P 500 + DJIA
S&P 500: Elliott Wave and Technical Analysis | Charts – March 9, 2021 More upwards movement was expected, which is how the session unfolded. Today the AD line and VVIX give signals that support the main hourly Elliott wave count for the short term. Summary: The...
by Lara | Mar 8, 2021 | S&P 500, S&P 500 + DJIA
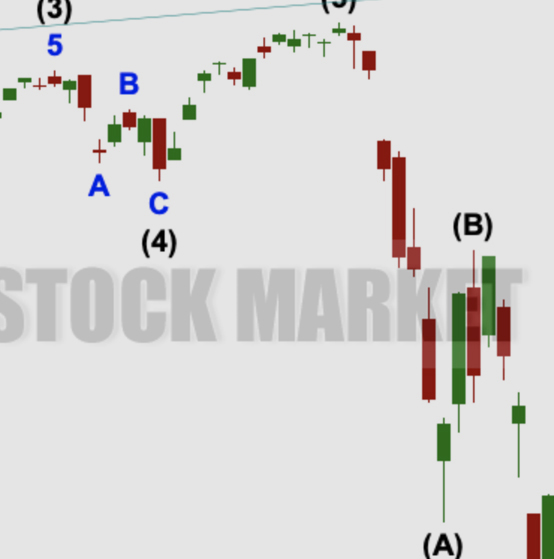
S&P 500: Elliott Wave and Technical Analysis | Charts – March 8, 2021 The main short-term hourly Elliott wave count expected upwards movement to begin the week, which is how Monday has completed with a higher high and a higher low, although the session closed...
by Lara | Mar 5, 2021 | Gold, Lara's Weekly, S&P 500, US Oil
Lara’s Weekly: Elliott Wave and Technical Analysis of S&P500 and Gold and US Oil | Charts – March 5, 2021 Commentary and charts of Lara’s Weekly, an end of week Elliott Wave and Technical Analysis of the S&P 500 and GOLD and USOIL, for week...
by Lara | Mar 5, 2021 | S&P 500, S&P 500 + DJIA
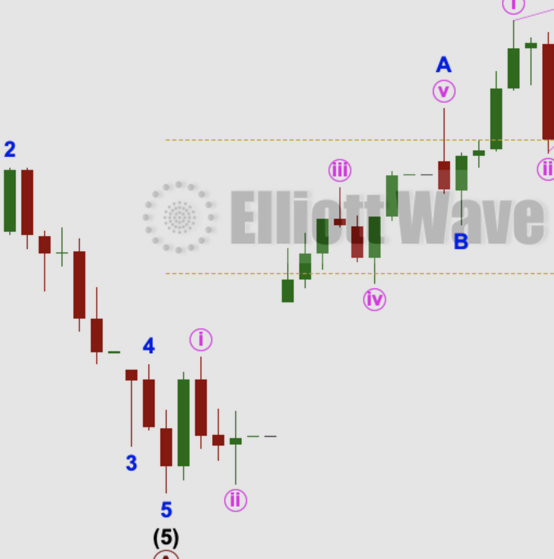
S&P 500: Elliott Wave and Technical Analysis | Charts – March 5, 2021 An upwards day was expected from the main Elliott wave count in last analysis. Summary: The pullback may have continued lower as a triple zigzag. The structure may now be complete; next support...

by Lara | Mar 4, 2021 | S&P 500, S&P 500 + DJIA
S&P 500: Elliott Wave and Technical Analysis | Charts – March 4, 2021 Another downwards day has invalidated the main short-term hourly Elliott wave count, leaving the alternate Elliott wave count valid. Summary: The pullback may have continued lower as a triple...

by Lara | Mar 3, 2021 | S&P 500, S&P 500 + DJIA
S&P 500: Elliott Wave and Technical Analysis | Charts – March 3, 2021 A downwards day closes with price still above the short-term invalidation point on the main hourly chart. All three short-term hourly charts remain valid. Technical analysis supports the main...


