The next target was at 3,179 (members were warned it may be too low). Upwards movement continued as expected for Friday reaching 3,182.68.
Summary: The next target is now at 3,238, but this may be too high.
Thereafter, the next target is at 3,302 and then 3,336.
Three large pullbacks or consolidations during the next 1-2 years are expected: for minor wave 4 (coming soon), then intermediate (4), and then primary 4.
The biggest picture, Grand Super Cycle analysis, is here.
Monthly charts were last published here, with video here. There are two further alternate monthly charts here, with video here.
ELLIOTT WAVE COUNTS
The two weekly Elliott wave counts below will be labelled First and Second. They may be about of even probability. When the fifth wave currently unfolding on weekly charts may be complete, then these two wave counts will diverge on the severity of the expected following bear market. To see an illustration of this future divergence monthly charts should be viewed.
FIRST WAVE COUNT
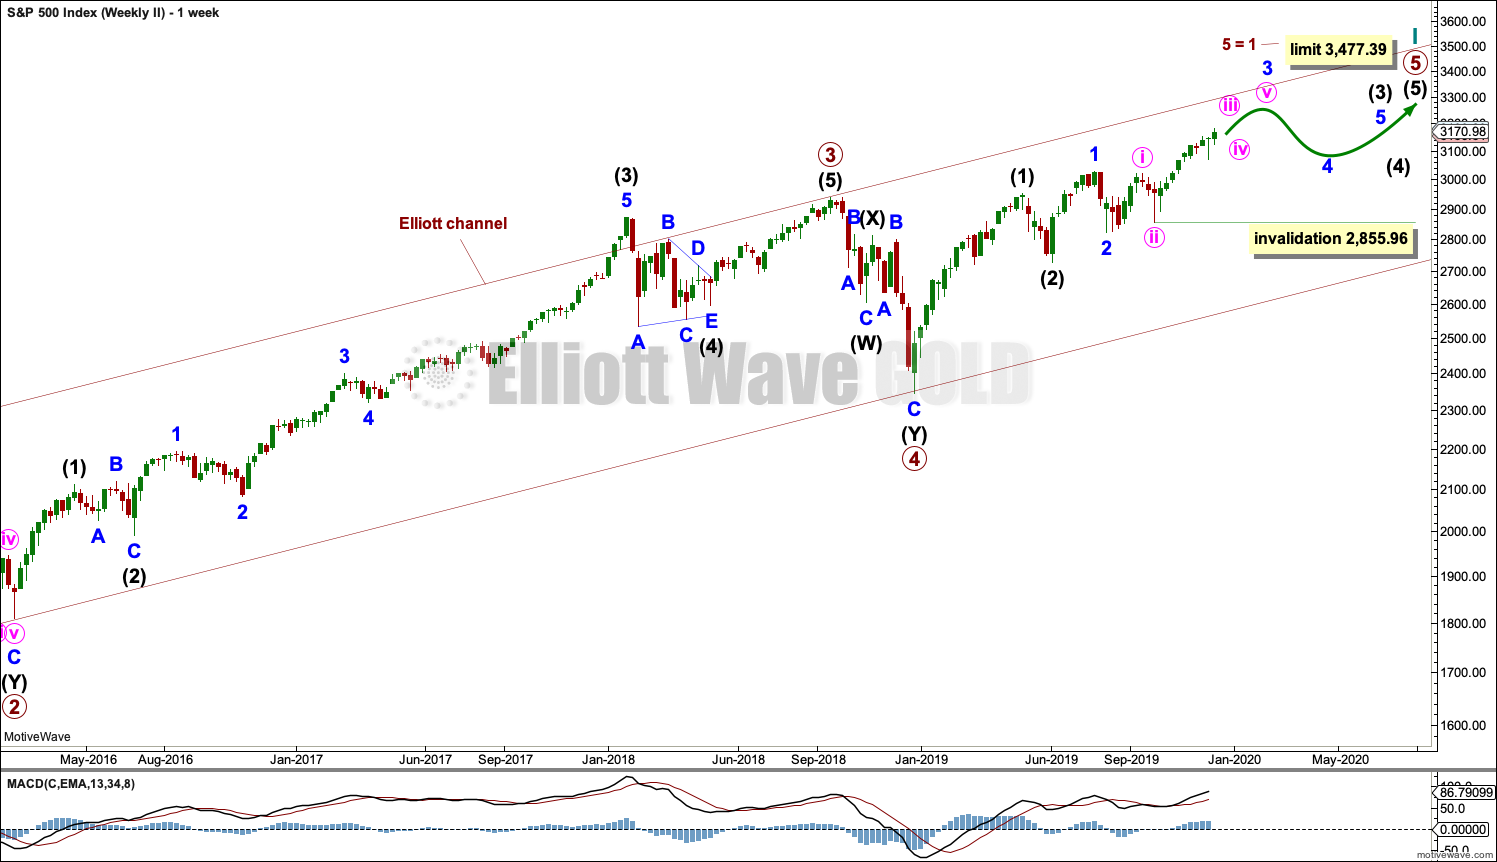
WEEKLY CHART
The basic Elliott wave structure consists of a five wave structure up followed by a three wave structure down (for a bull market). This wave count sees the bull market beginning in March 2009 as an incomplete five wave impulse and now within the last fifth wave, which is labelled cycle wave V. This impulse is best viewed on monthly charts. The weekly chart focusses on the end of it.
Elliott wave is fractal. This fifth wave labelled cycle wave V may end a larger fifth wave labelled Super Cycle wave (V), which may end a larger first wave labelled Grand Super Cycle wave I.
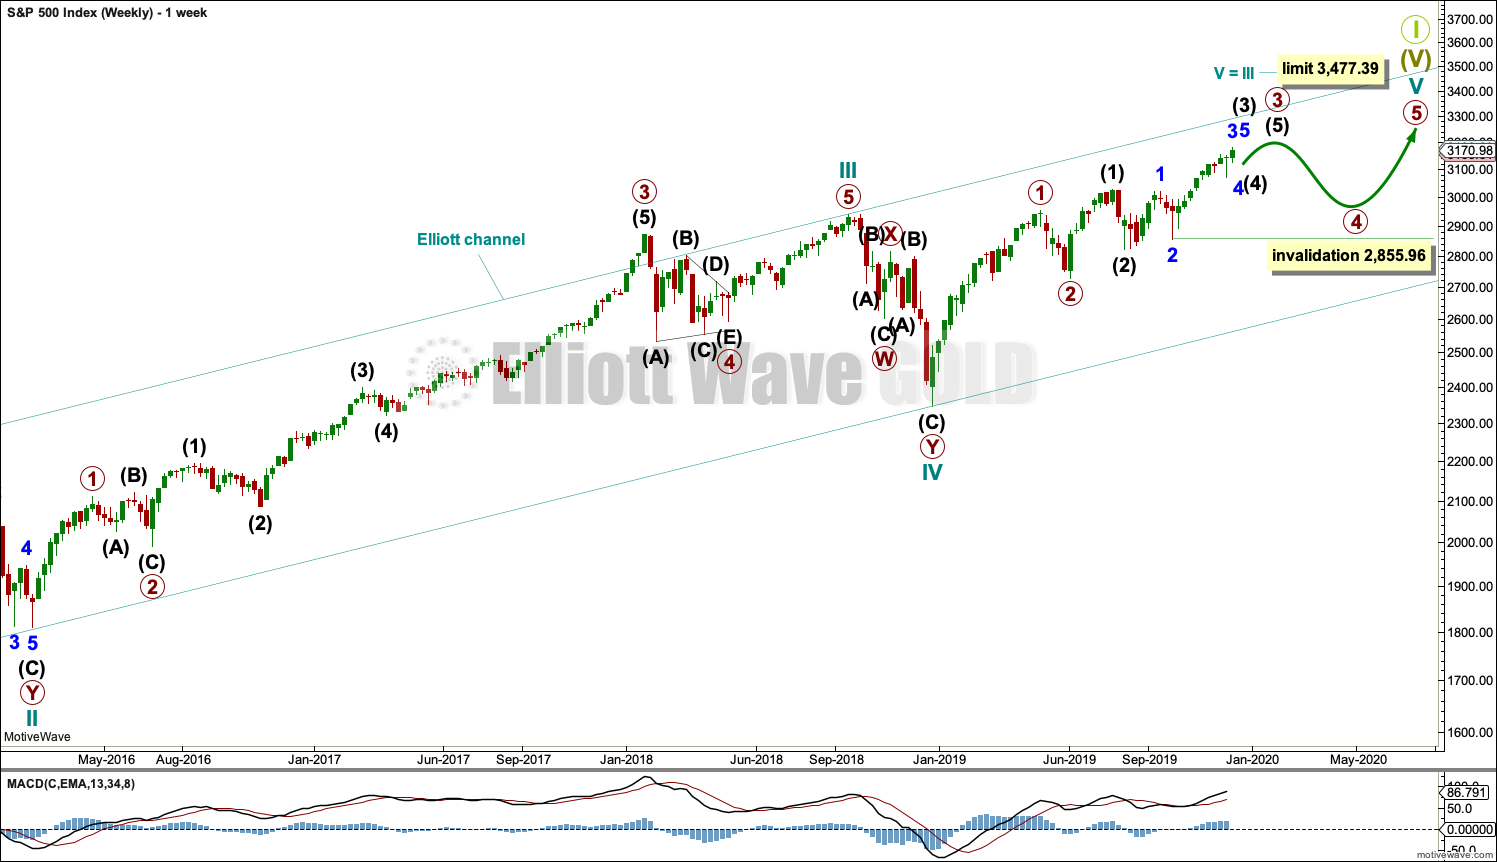
The teal Elliott channel is drawn using Elliott’s first technique about the impulse of Super Cycle wave (V). Draw the first trend line from the end of cycle wave I (off to the left of the chart, the weekly candlestick beginning 30th November 2014) to the end of cycle wave III, then place a parallel copy on the end of cycle wave II. This channel perfectly shows where cycle wave IV ended at support. The strongest portion of cycle wave III, the end of primary wave 3, overshoots the upper edge of the channel. This is a typical look for a third wave and suggests the channel is drawn correctly and the way the impulse is counted is correct.
Within Super Cycle wave (V), cycle wave III is shorter than cycle wave I. A core Elliott wave rule states that a third wave may never be the shortest. For this rule to be met in this instance, cycle wave V may not be longer in length than cycle wave III. This limit is at 3,477.39.
Cycle wave V may subdivide either as an impulse or an ending diagonal. Impulses are much more common. An alternative wave count which considered an ending diagonal has been invalidated. While it is possible a diagonal may become an alternate wave count in coming weeks or months, at this stage the structure does not fit.
At this stage, cycle wave V may take another one to two or so years to complete.
The daily chart below will focus on movement from the end of intermediate wave (2) within primary wave 3.
In historic analysis, two further monthly charts have been published that do not have a limit to upwards movement and are more bullish than this wave count. Members are encouraged to consider those possibilities (links below summary) alongside the wave counts presented on a daily and weekly basis. It is my judgement that the wave count above has the highest probability, so it shall be the only wave count published on a daily basis.
Within cycle wave V, primary waves 1 and 2 may be complete. Within primary wave 3, intermediate waves (1) and (2) may be complete. Within the middle of intermediate wave (3), no second wave correction may move beyond its start below 2,855.96.
DAILY CHART
All of primary wave 3, intermediate wave (3) and minor wave 3 may only subdivide as impulses.
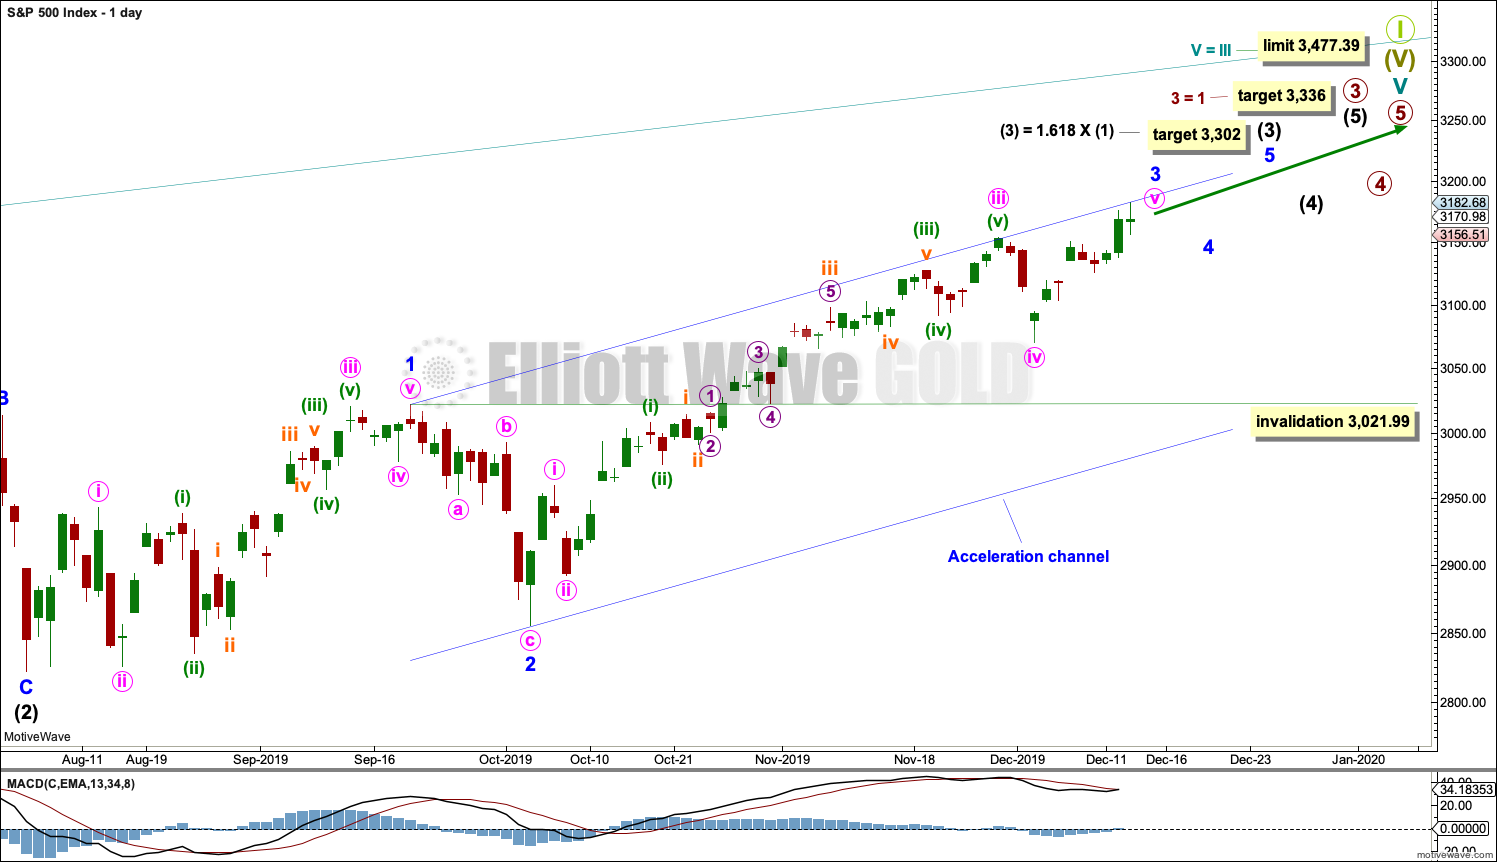
Minor wave 3 has passed 1.618 the length of minor wave 1, and within it minute wave v has passed equality in length with minute wave i. The next target may be about 3,238 where minute wave v would reach 1.618 the length of minute wave i, but this target may be too high.
Minor wave 2 was a sharp deep pullback, so minor wave 4 may be expected to be a very shallow sideways consolidation to exhibit alternation. Minor wave 2 lasted 2 weeks. Minor wave 4 may be about the same duration, or it may be a longer lasting consolidation. Minor wave 4 may end within the price territory of the fourth wave of one lesser degree; minute wave iv has its range from 3,154.26 to 3,070.49.
Minor wave 4 may not move into minor wave 1 price territory below 3,021.99.
Intermediate wave (3) must move far enough above the end of intermediate wave (1) to then allow intermediate wave (4) to unfold and remain above intermediate wave (1) price territory. While intermediate wave (3) has now moved beyond the end of intermediate wave (1), meeting a core Elliott wave rule, it still needs to continue higher to give room for intermediate wave (4).
The target for intermediate wave (3) fits with a target calculated for minor wave 3.
Draw an acceleration channel now about intermediate wave (3): draw the first trend line from the end of minor wave 1 to the last high, then place a parallel copy on the end of minor wave 2. Keep redrawing the channel as price continues higher. When minor wave 3 is complete, then this channel would be an Elliott channel and may show where minor wave 4 may find support if it is long lasting enough.
HOURLY CHART
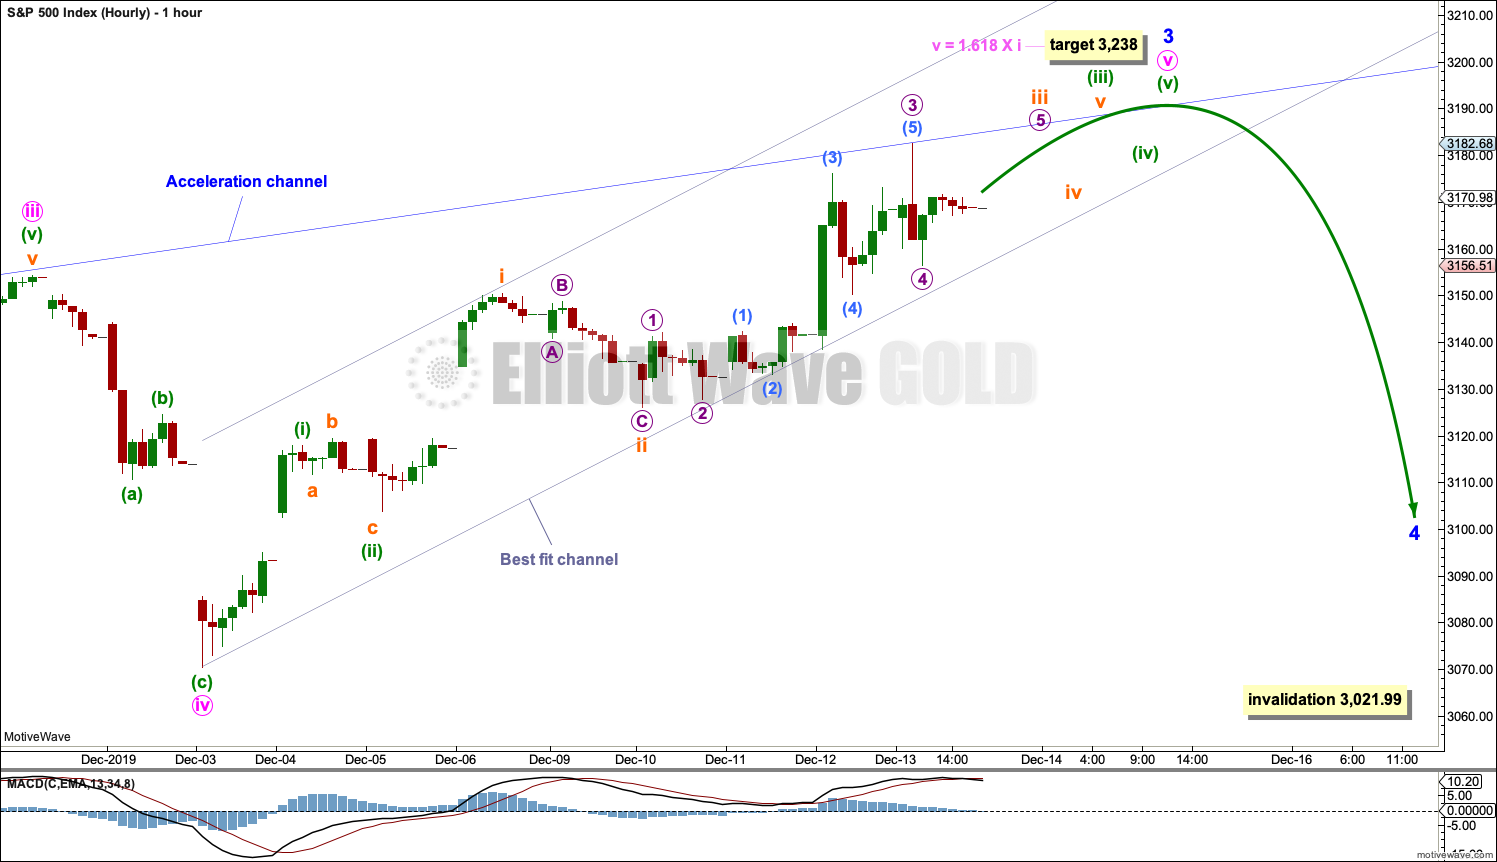
The hourly chart will now focus on minute wave v.
Minute wave v is subdividing as an impulse. So far the structure looks incomplete. It looks like minute wave v needs to continue higher.
Within minute wave v, subminuette wave iv may not move into subminuette wave i price territory below 3,150.60. Thereafter, minuette wave (iv) may not move into minuette wave (i) price territory below 3,118.02.
Draw a best fit channel about minute wave v. Expect support and resistance using this channel. If the channel is breached by downwards movement, then that may be an indication that minute wave v is over and minor wave 4 may have arrived.
SECOND WAVE COUNT
WEEKLY CHART
This weekly chart is almost identical to the first weekly chart, with the sole exception being the degree of labelling.
This weekly chart moves the degree of labelling for the impulse beginning in March 2009 all down one degree. This difference is best viewed on monthly charts.
The impulse is still viewed as nearing an end; a fifth wave is still seen as needing to complete higher. This wave count labels it primary wave 5.
Primary wave 5 may be subdividing as either an impulse, in the same way that cycle wave V is seen for the first weekly chart.
TECHNICAL ANALYSIS
MONTHLY CHART
Click chart to enlarge. Chart courtesy of StockCharts.com.
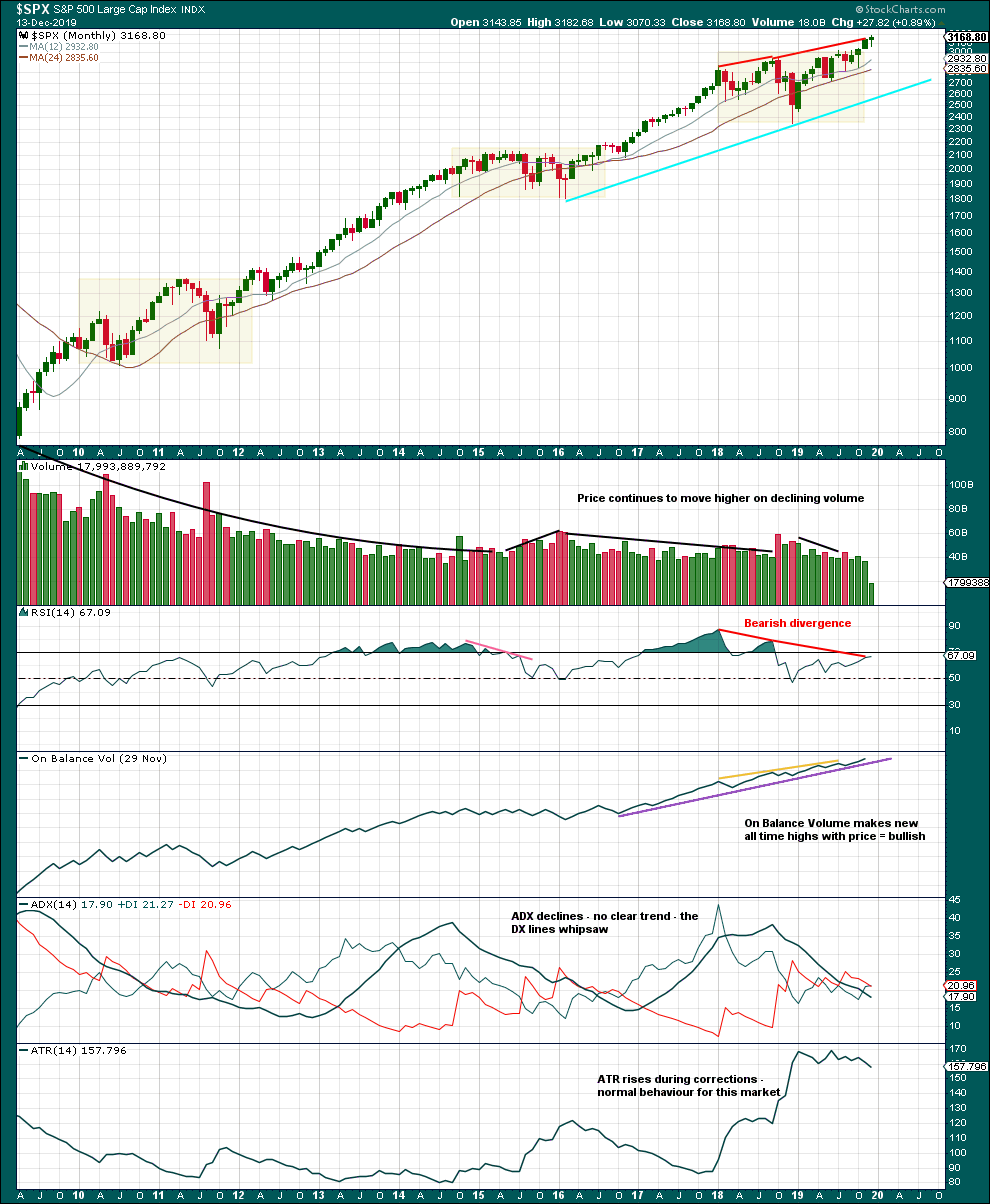
There are three large consolidations noted on this chart, in shaded areas. After a breakout from a multi-month consolidation, it is reasonable to expect a multi month bullish move may result.
This chart very clearly exhibits rising price on declining volume has now persisted for several years. A decline in volume this month, in current market conditions, is not of concern.
On Balance Volume supports the Elliott wave count.
WEEKLY CHART
Click chart to enlarge. Chart courtesy of StockCharts.com.
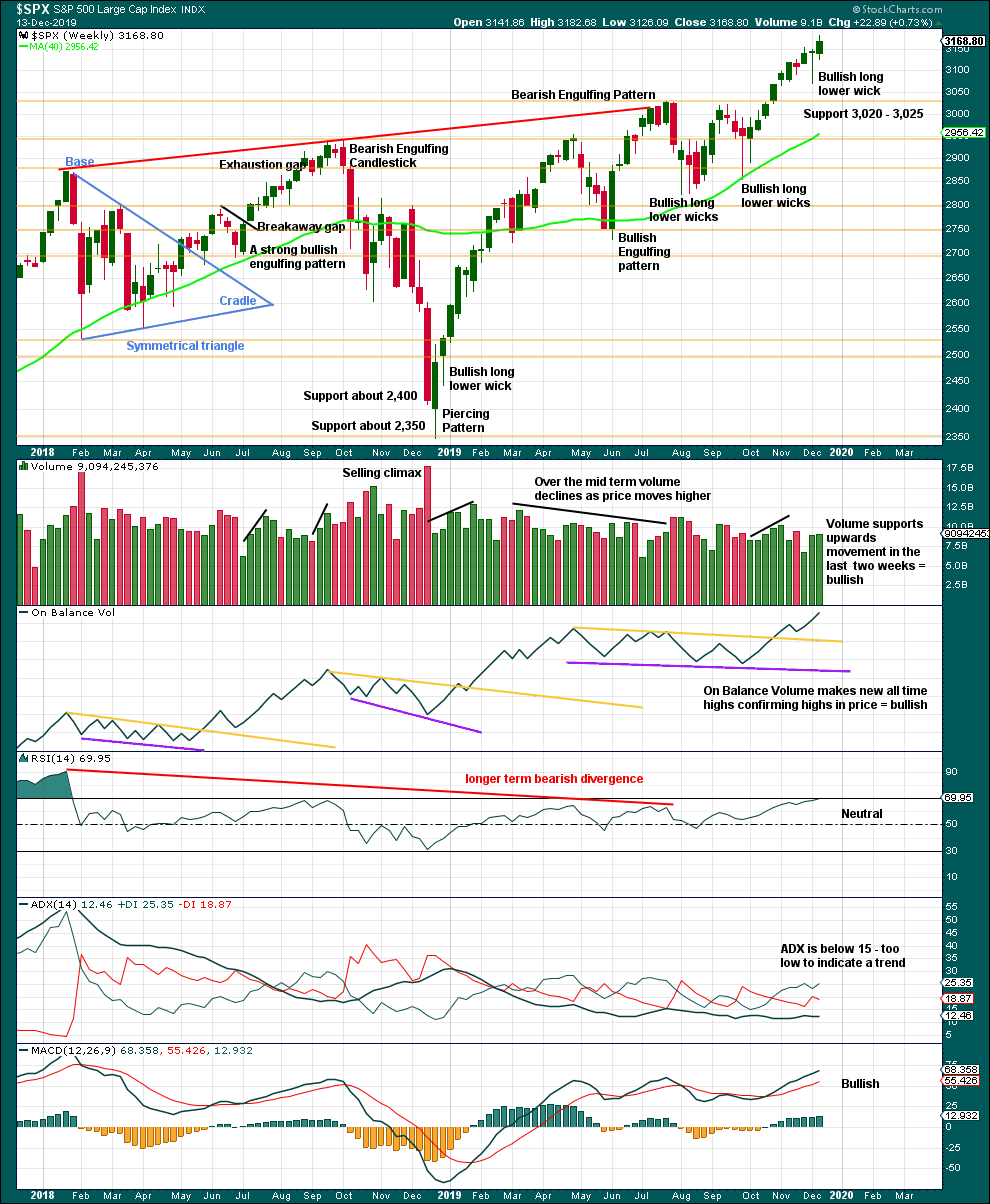
It is very clear that the S&P is in an upwards trend and the bull market is continuing. Price does not move in straight lines; there will be pullbacks and consolidations along the way.
This chart is overall bullish. There are no signs of weakness in upwards movement.
DAILY CHART
Click chart to enlarge. Chart courtesy of StockCharts.com.
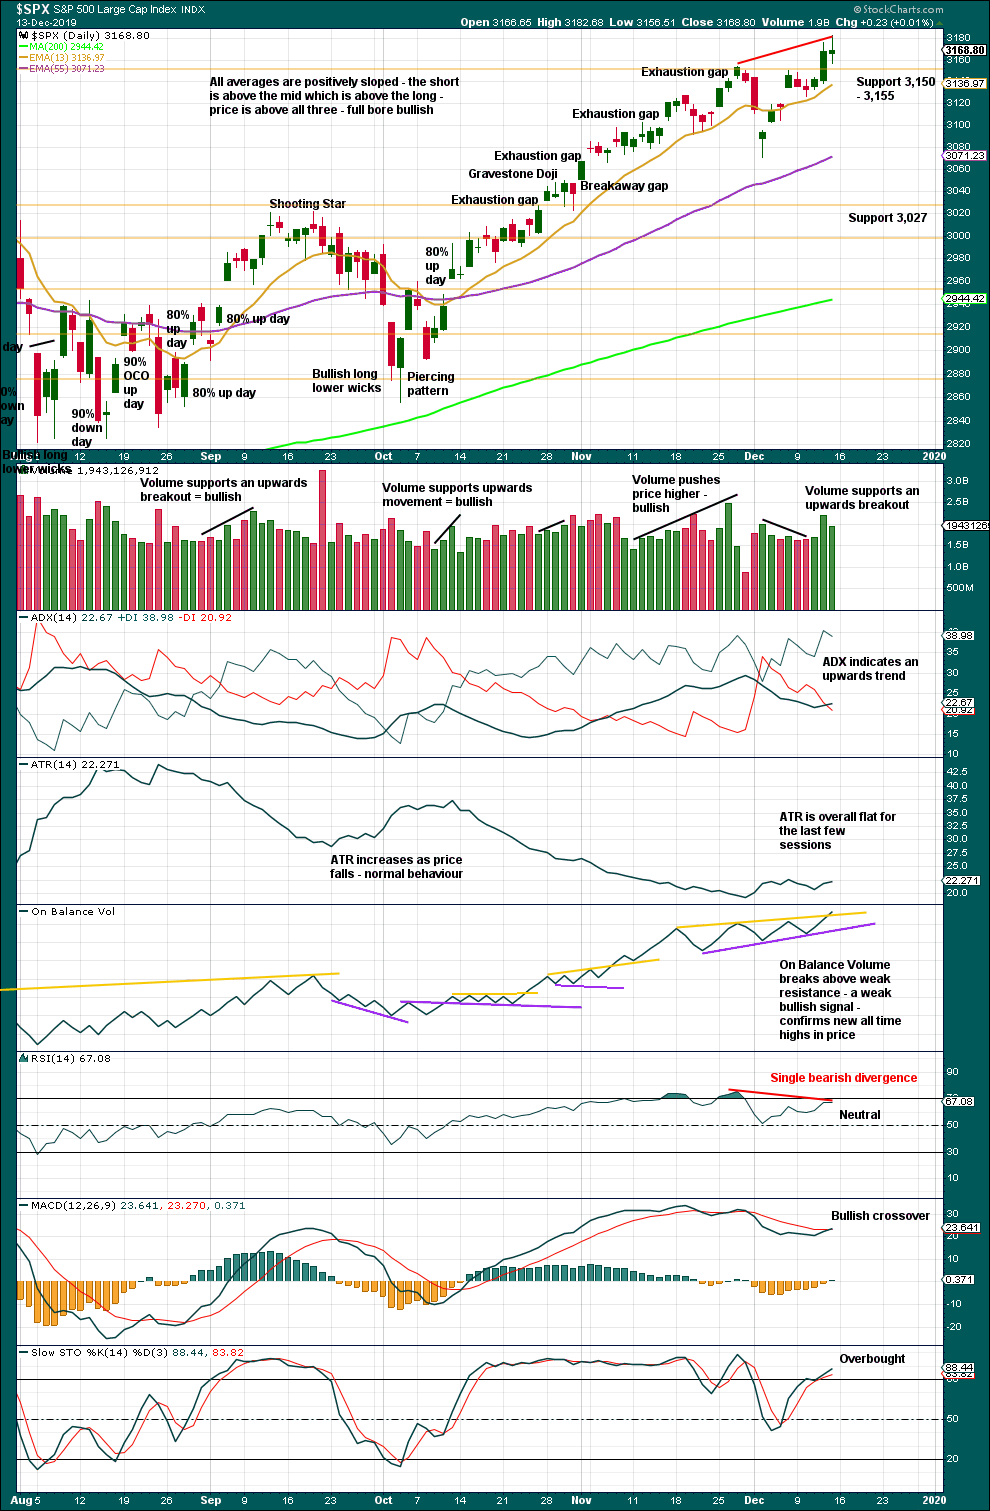
There is an upwards trend in place. There will be corrections along the way.
Like the weekly chart, this chart is bullish. The only sign of weakness is divergence between price and RSI.
BREADTH – AD LINE
WEEKLY CHART
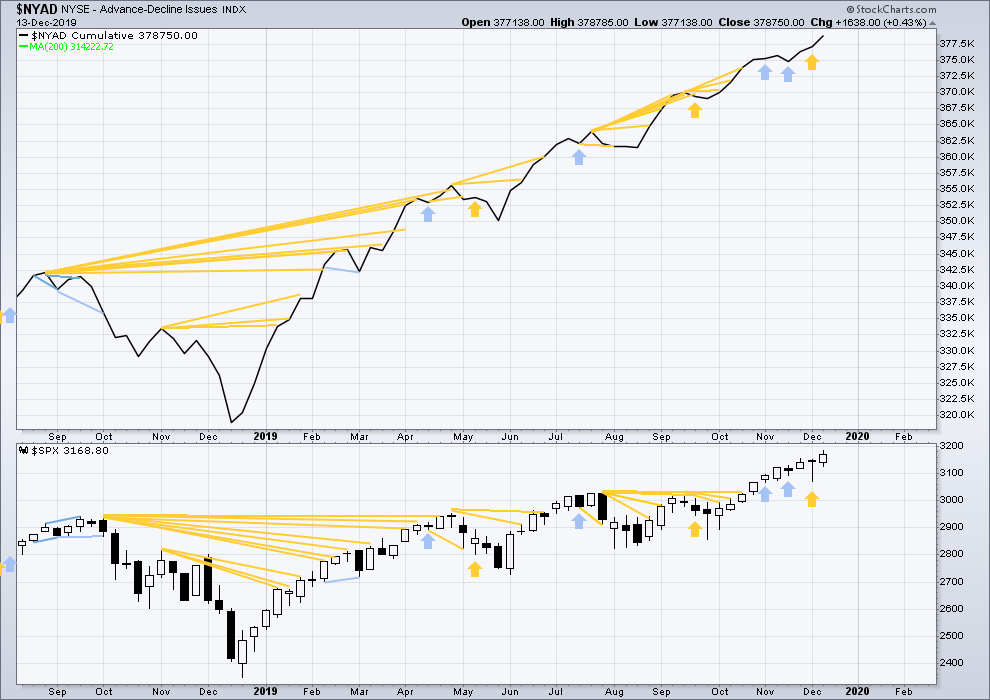
Click chart to enlarge. Chart courtesy of StockCharts.com. So that colour blind members are included, bearish signals
will be noted with blue and bullish signals with yellow.
Bear markets from the Great Depression and onwards have been preceded by an average minimum of 4 months divergence between price and the AD line with only two exceptions in 1946 and 1976. With the AD line making new all time highs last week, the end of this bull market and the start of a new bear market is very likely a minimum of 4 months away, which is mid March 2020.
In all bear markets in the last 90 years there is some positive correlation (0.6022) between the length of bearish divergence and the depth of the following bear market. No to little divergence is correlated with more shallow bear markets. Longer divergence is correlated with deeper bear markets.
If a bear market does develop here, it comes after no bearish divergence. It would therefore more likely be shallow.
All of small, mid and large caps have made new swing highs above the prior swing high on the 13th of September, but only large caps have made new all time highs. This upwards movement appears to be mostly driven by large caps, which is a feature of aged bull markets. This bull market at over 10 years duration certainly fits the definition of aged.
This week both price and the AD line have made new all time highs. There is no divergence. Upwards movement has support from rising market breadth.
DAILY CHART
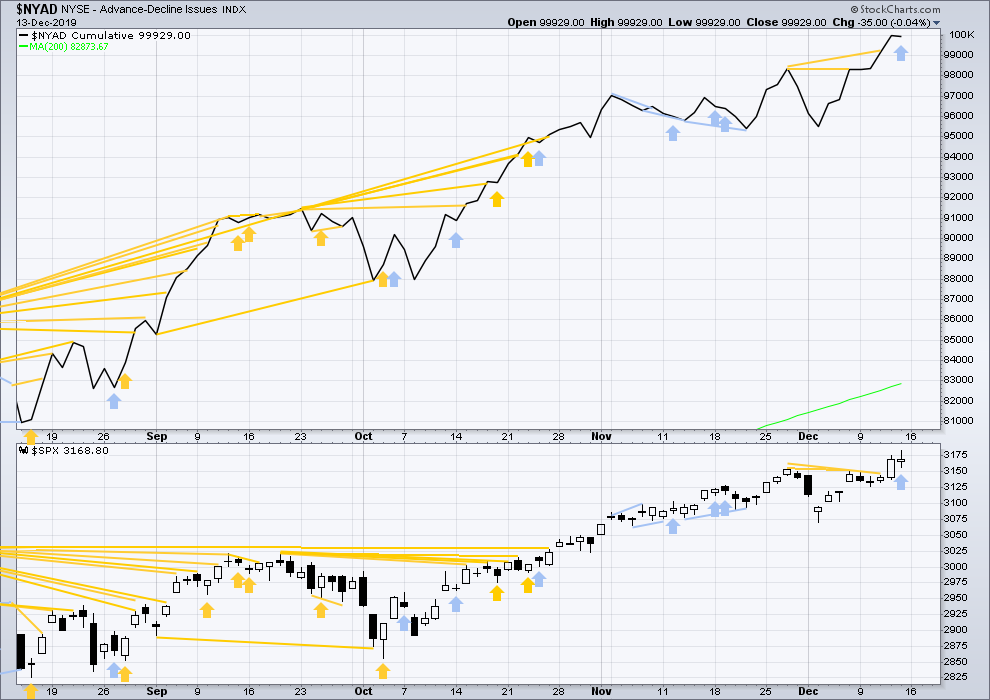
Click chart to enlarge. Chart courtesy of StockCharts.com. So that colour blind members are included, bearish signals
will be noted with blue and bullish signals with yellow.
Breadth should be read as a leading indicator.
On Friday price has moved higher but failed by a very small margin to make a new all time high. The AD line has moved higher to make a new all time high but only by a very small margin. This divergence is bullish, but it is weak.
On Friday price has moved higher. The AD line is flat to very slightly downwards sloping. This divergence is bearish, but it is weak.
VOLATILITY – INVERTED VIX CHART
WEEKLY CHART
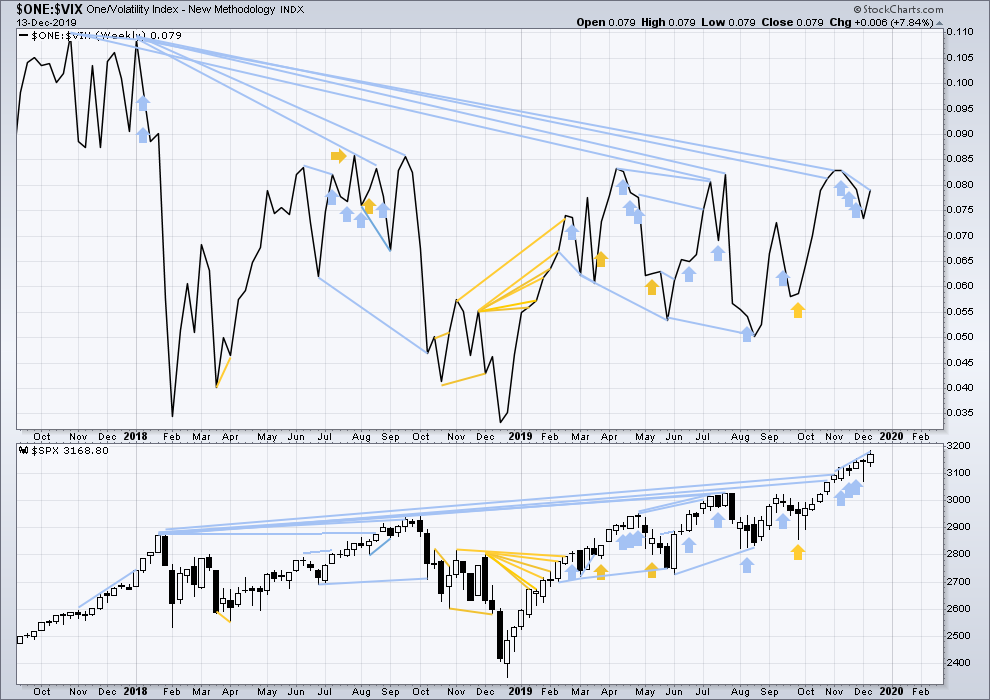
Click chart to enlarge. Chart courtesy of StockCharts.com. So that colour blind members are included, bearish signals
will be noted with blue and bullish signals with yellow.
The all time high for inverted VIX was on 30th October 2017. There is now over two years of bearish divergence between price and inverted VIX.
The rise in price is not coming with a normal corresponding decline in VIX; VIX remains elevated. This long-term divergence is bearish and may yet develop further as the bull market matures.
This divergence may be an early warning, a part of the process of a top developing that may take years. It may is clearly not useful in timing a trend change from bull to a fully fledged bear market.
This week price has made new all time highs, but inverted VIX has not made new short, mid or long-term highs. Price has made a new high above the prior high four weeks ago, but inverted VIX has not. This divergence is bearish.
DAILY CHART
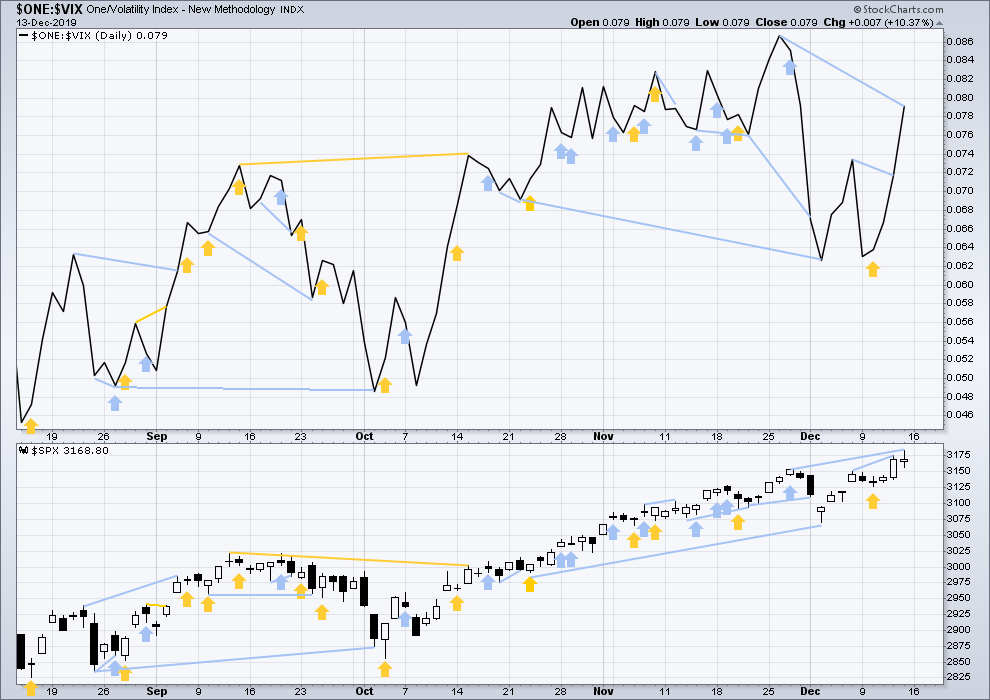
Click chart to enlarge. Chart courtesy of StockCharts.com. So that colour blind members are included, bearish signals
will be noted with blue and bullish signals with yellow.
Price has made new highs above the prior highs of the 26/27 November, but inverted VIX has not. This divergence is bearish.
DOW THEORY
Dow Theory confirmed a bear market in December 2018. This does not necessarily mean a bear market at Grand Super Cycle degree though; Dow Theory makes no comment on Elliott wave counts. On the 25th of August 2015 Dow Theory also confirmed a bear market. The Elliott wave count sees that as part of cycle wave II. After Dow Theory confirmation of a bear market in August 2015, price went on to make new all time highs and the bull market continued.
DJIA: 23,344.52 – a close on the 19th of December at 23,284.97 confirms a bear market.
DJT: 9,806.79 – price has closed below this point on the 13th of December.
S&P500: 2,532.69 – a close on the 19th of December at 2,506.96 provides support to a bear market conclusion.
Nasdaq: 6,630.67 – a close on the 19th of December at 6,618.86 provides support to a bear market conclusion.
With all the indices having moved higher following a Dow Theory bear market confirmation, Dow Theory would confirm a bull market if the following highs are made:
DJIA: 26,951.81 – a close above this point has been made on the 3rd of July 2019.
DJT: 11,623.58 – to date DJT has failed to confirm an ongoing bull market.
S&P500: 2,940.91 – a close above this point was made on the 29th of April 2019.
Nasdaq: 8,133.30 – a close above this point was made on the 26th of April 2019.
Published @ 08:55 p.m. EST.
—
Careful risk management protects your trading account(s).
Follow my two Golden Rules:
1. Always trade with stops.
2. Risk only 1-5% of equity on any one trade.
—
New updates to this analysis are in bold.

AAPL is going to be kind of easy money to the short side eventually. I made a small gain on the bounce down from my lower Fibonacci projection. Now it’s approaching the upper one, in synchrony with timing for a minor 4 starting in SPX. So I think an excellent set up for the intrepid is approaching here. I love stalking game…
Hourly chart updated:
The structure of minute v still looks incomplete, so more upwards movement may be reasonably expected short term. Momentum on the hourly chart is increasing, this count fits with MACD.
My take on perhaps more likely pivot locations in price and time (gray ellipses). And one is “right now” but probably not per Lara’s hourly count.
This market has legs.
your pivot about 3,240 fits quite nicely with my EW target at 3,238
We are above the upper BB on daily SPX. While this can continue for a few days, it generally means a pullback or sideways correction is forthcoming sooner rather than later. I think the last time this happened was March 21st of this year. It was followed by a two day correction then a 6% upwards move in just under 4 weeks. We just might be looking at something similar in the horizon which would catapult us to SPX 3380. Believe it or not! You heard it here first.
I would not be surprised by SPX in the 7000 range by the mid 2020’s. The implications of the price side of the Precter studies I spoke to below re: the timing of the end of cycle wave are rather insane. He says the wave iv range usually overlaps the 50% level of the LOG SCALE OF PRICE. It’s kind of challenging with the tools I have to calculate the target, but my rough eyeball says it is then 7000-8000. Ending in the ’24-’28 time frame. Wowza. Meanwhile, “we take it one day at a time”.
Dynamite action today, everything looking very sweet on my board!!! Did I mention I really like the color green? Oh yes.
VIX is now below 12 again. That’s one place I may deploy some OOM calls right on the very earliest signal that minor 4 is starting up to nail the sudden jump back up to 14-16.
I suspect we’ll get a minuette iv under the 162% at 3207, and then maybe finish the minuette v at my Fibonacci projection shown at 3237.
Hi Kevin,
I doubt it’s possible to achieve 7000 SPX from fundamental point of view by 2025. For it to arrive to this level, SPX needs to return 16.9% CAGR (annually, on average). With GDP growth of 2-3%, the only possibility for inflation to pick up, but then Feds would be forced to increase the rate. So this theory doesn’t sound legit from fundamental point of view. Just my 2 cents.
Lev
I don’t analyze fundamentals, so “I don’t know about that”.
I’m just reporting from a pure Elliott wave historical analysis perspective.
But as backdrop I see lots of corroborating evidence in Chris Ciovacco’s excellent macro technical analysis work in his “short takes” videos. His historical analogues (all different re: specifics) consistently show extremely powerful statistics (as in for example “15 times out of 15 times”!!!) telling us there is a major secular bull run in progress and in it’s early phases, as price has broken of this several year consolidation range. So SPX doubling or more is very feasible from a historical analogue perspective.
I do not see the update for Lara’s Weekly. I sure hope everything is okay.
It’s…. there Rodney. I can see it.
Can you see it yet? Is anyone else having a problem?
It’s in full over at Elliott Wave Gold here, with video here.
I can see it at Elliott Wave Gold. But I cannot see the link under EWSM which is unusual. Normally it is listed at the front page under “Analysis”
Thanks.
I’ll second that.
Oh yes, I see that now. That is unusual. I have let Cesar know.
The hourly indicates to me that the minor 3 completes mid-late this week (Friday would be a natural: options expiration day), given the amount of further minute v structure needed to complete it. I’ve got targets for the minor 3 pivot high at 3202, 3213, and 3232. Not a time to stack up a bunch of longs re: mid-January options expiration targets. Rather, once there’s indication of the minor 4 launching, time to sell call spreads over the market for Jan expiry.
It can be argued that the very strong reversal late last week in bonds also strongly portends the end of the minor 3 very soon. Stocks start a multi-week sideways to down swing, while bonds rise. Gold should be rising too. Watch for a synchronized shift back to “risk off” later this coming week. I maybe be selling put bull spreads under bonds and gold as well myself. I will be cashing lots of long profits on Friday, and I’d like much of it quickly reinvested to be making $$$’s off premium decay one way or another heading to mid-Jan expiry. But not “against the grain” of the expected minor 4.
And…sick puppy that I am…I will be watching for the opportunity to short AAPL. That thing is seriously over extended.
Here’s SPX monthly. MACD (standard) and the standard squeeze (15 period Keltner, 20 period Bollinger, Bollinger’s coming inside Keltner’s -> red dots). The chart speaks for itself: a VERY STRONG secular bull market is indicated based on the history of price action following such MACD crosses like the one we just had. The chart idea is complements of Ciovacco Capital short takes public video. I’ve added the squeeze indicator: it signals big moves just about always here, and this last 8 month squeeze has fired (terminated with momentum strongly up. Also note my trend indicator hasn’t even gone to strong up yet; I believe a slow to turn ADX is holding it up. That’s also indicative of lots of upside potential, as long runs of strong up at this time frame are common after each such MACD cross. Many confirming indicators indeed.
And here’s DJX since 2007, monthly candles. Also only in an up trend, not a strong up trend yet. A MACD cross a week ago. And note this market is continuing still in a squeeze, with price surging upward. It hasn’t even released yet. A lot of bullish signals.
Here’s an analysis of super cycle wave (V) based on Precter’s Analysis of Example Cycle and Super Cycle V’s leading to projections of completion of super cycle wave V between May 2024 and March 2028.
Super cycle wave (V) start date: March 2009.
– Cycle wave III completed Sept 2018.
– Cycle wave IV completed Dec 2018
Per Robert Precter’s “Wave Three Splits the Total Duration of each Wave Roughly into a 0.50 Ratio”, Fig 2-7 in “Beautiful Pictures from the Gallery of Phinance”, page 31:
Demonstrates this tendency with DJIA 1932-200, 1974-2000, 1921-1929.
Per Lara Iriarte analysis (www.elliottwavestockmarket.com) of the SP500 current super cycle wave (V):
Cycle wave III completed September 2019.
Cycle wave I-II-III length = 114 months
At 50% of super cycle wave (V), end date for super cycle wave (V) => January 1928.
Per Robert Precter’s “Wave Four Splits the Total Duration of Each Wave into a .635/.365 Ratio”
Fig 2-8 in “Beautiful Pictures from the Gallery of Phinance”, page 29.
Demonstrates this tendency with DJIA 1932-200, 1974-2000, 1921-1929. Ratio is average of the ratios of these three examples.
At a ratio of .618/.382, cycles waves I-II-III-IV lasted 108 months
Cycle wave V will last 66 months and all of super cycle wave (V) lasts 174 months.
The end date for super cycle wave (V) based on this ratio => May 2024.
To achieve the same target date with both relationships requires relative alignment of the III and IV waves within the overall structure. The three examples used by Precter have highly consistent such structure, while Iriarte’s current primary Super Cycle wave (V) count does not, resulting is different target dates based on these two ratios.
The Precter analysis is identified for “Fifth Waves Having Extended Fifth Waves”. For this wave count, cycle wave I is longer than wave III, which limits wave V to less than wave III. This in turn precludes and extended wave V. Hence, these projections may be inappropriate using this wave count.
When we turn to the alternative monthly wave count that places the wave III top at 9/1/18 (see Iriarte’s alternative monthly wave count), we have a model that allows for an extended wave V, as wave III is longer than wave I.
Super cycle wave (V) start date: March 2009
Cycle Wave III completed September 2018.
Cycle Wave IV completed December 2018.
Cycle wave I-II-III length = 114 months (9 years 6 months).
Target completion of super cycle wave V at .50/.50 ratio of I-II-III to IV-V => March 2028
Cycle wave I-II-III-IV length = 117 months (9 years 9 months)
Cycle wave V projected length = 72 months (117 * 0.618)
Target completion of super cycle wave V at .618/.382 ration of I-II-III-IV to V => December 2025
In neither case do we get consistent targets for both divider methods. Overall, our range for completion of the wave V of wave (V) is May 2024 to January 2028, as follows:
Targets:
– May 2024 (monthly main, using .618/.382 of IV)
– December 2025 (monthly alternate, using .618/.382 of IV)
– January 2028 (monthly main, using 0.5/0.5 of III)
– March 2028 (monthly alternate, using 0.5/0.5 of III)
This adds to the weight of the evidence of a strong secular bull market in play and continuing for as long as a decade.
Let me be the first to say “Great job, Lara.” We have a move to ATHs in price bolstered by decent volume, OBV new highs, weekly AD Line new high, and a bullish daily MACD cross over. It is all looking very bullish to me. Surprises should continue to be to the upside.
Have a wonderful weekend.
Without doubt, Lara was the first full time Elliott analyst to call for a bull market after the Dec’18 cycle low. And been on it since through 2019, with high fidelity throughout. Money!!! TY Lara, a really nice year.
Thank you very much guys.
I credit a lot of my confidence over this last year or so to getting Lowry’s data. It’s helped me immensely with my EW analysis.