
Upwards movement continued as was expected for the short term from last analysis.
Today a candlestick pattern along with signals from VIX indicate the next movement for the short term. The mid-term target remains the same.
Summary: The low of December 2018 is expected to most likely remain intact.
The target for a third wave up to end remains at 3,104. Along the way up, two consolidations or pullbacks are expected and the first looks likely to have just begun today. The first preferred area of support is about 2,863.
Today the bearish alternate wave count is invalidated. This adds some confidence to the main wave count.
The biggest picture, Grand Super Cycle analysis, is here.
Monthly charts were last published here, with video here. There are two further alternate monthly charts here, with video here.
ELLIOTT WAVE COUNTS
The first two Elliott wave counts below will be labelled First and Second. They may be about of even probability. When the fifth wave currently unfolding on weekly charts may be complete, then these two wave counts will diverge on the severity of the expected following bear market. To see an illustration of this future divergence monthly charts should be viewed.
FIRST WAVE COUNT
WEEKLY CHART
Click chart to enlarge.
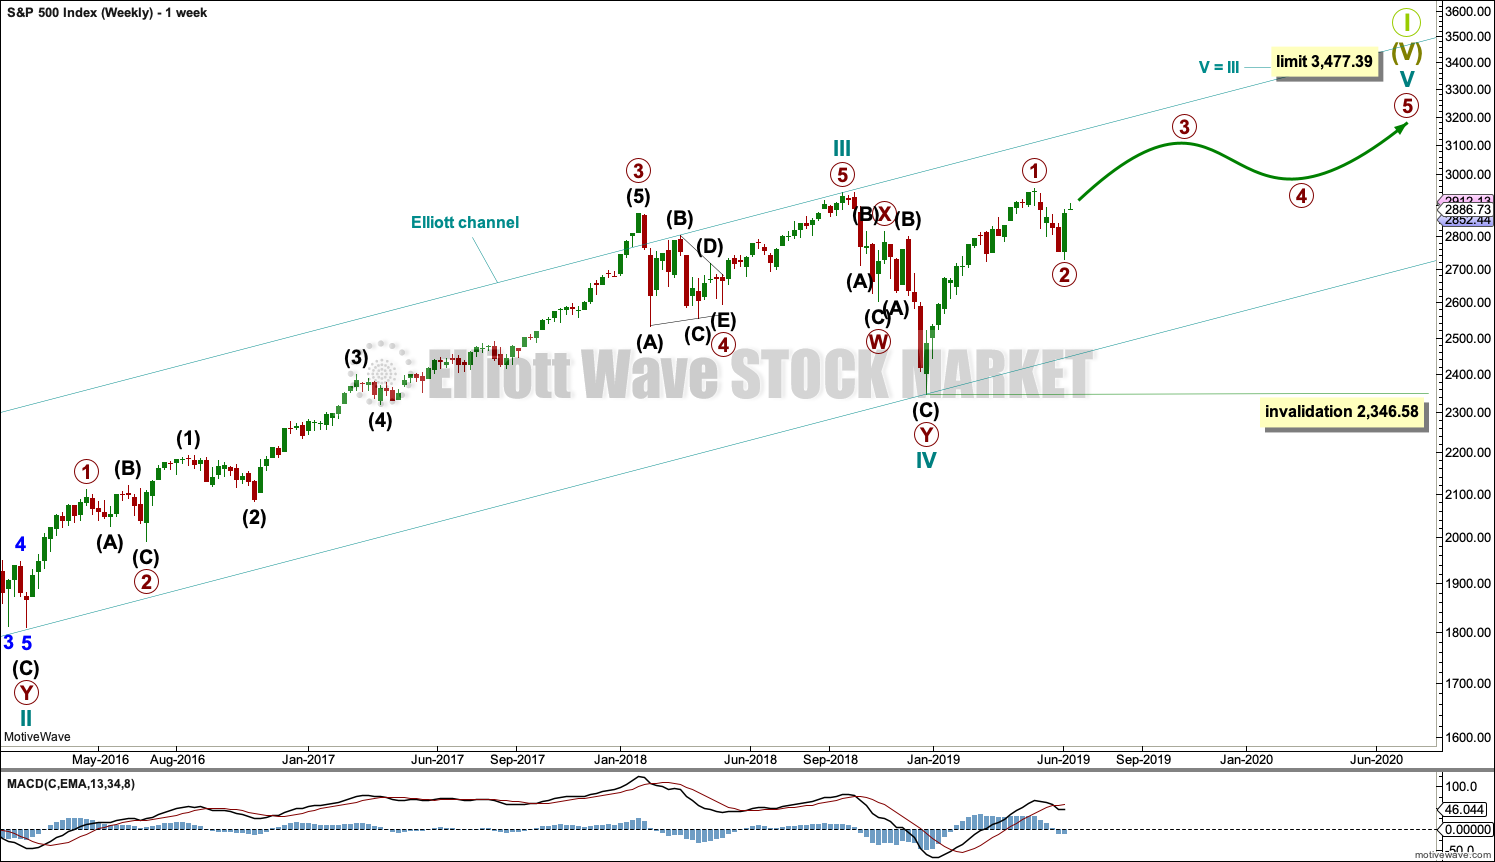
The basic Elliott wave structure consists of a five wave structure up followed by a three wave structure down (for a bull market). This wave count sees the bull market beginning in March 2009 as an incomplete five wave impulse and now within the last fifth wave, which is labelled cycle wave V. This impulse is best viewed on monthly charts. The weekly chart focusses on the end of it.
Elliott wave is fractal. This fifth wave labelled cycle wave V may end a larger fifth wave labelled Super Cycle wave (V), which may end a larger first wave labelled Grand Super Cycle wave I.
The teal Elliott channel is drawn using Elliott’s first technique about the impulse of Super Cycle wave (V). Draw the first trend line from the end of cycle wave I (off to the left of the chart, the weekly candlestick beginning 30th November 2014) to the end of cycle wave III, then place a parallel copy on the end of cycle wave II. This channel perfectly shows where cycle wave IV ended at support. The strongest portion of cycle wave III, the end of primary wave 3, overshoots the upper edge of the channel. This is a typical look for a third wave and suggests the channel is drawn correctly and the way the impulse is counted is correct.
Within Super Cycle wave (V), cycle wave III is shorter than cycle wave I. A core Elliott wave rule states that a third wave may never be the shortest. For this rule to be met in this instance, cycle wave V may not be longer in length than cycle wave III. This limit is at 3,477.39.
The structure of cycle wave V is focussed on at the daily chart level below.
Within cycle wave V, primary wave 2 may not move beyond the start of primary wave 1 below 2,346.58.
In historic analysis, two further monthly charts have been published that do not have a limit to upwards movement and are more bullish than this wave count. Members are encouraged to consider those possibilities (links below summary) alongside the wave counts presented on a daily and weekly basis.
DAILY CHART
Click chart to enlarge.
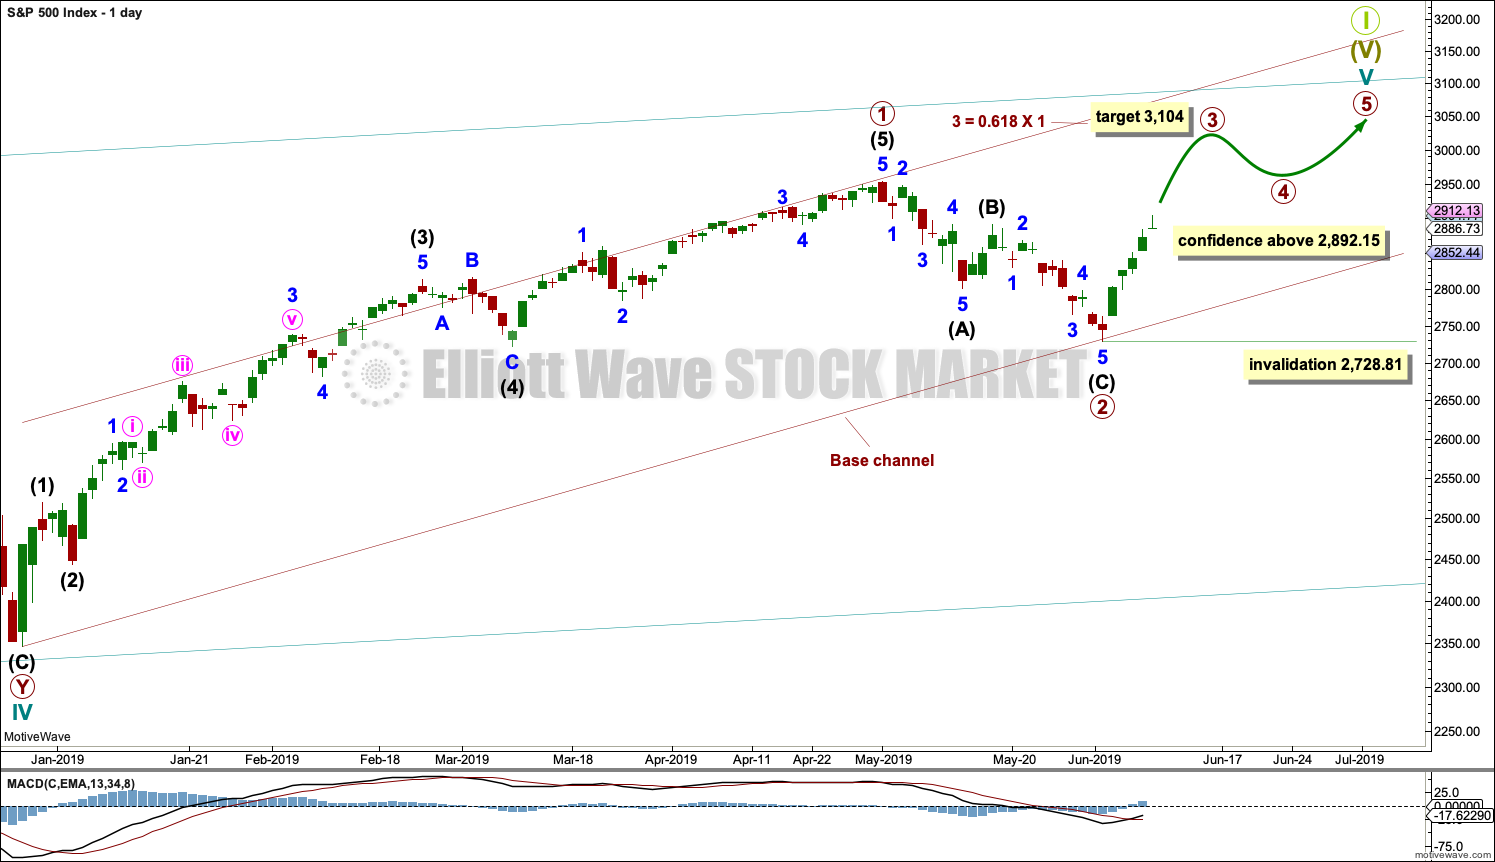
Cycle wave V must subdivide as a five wave motive structure. Within that five wave structure, primary waves 1 and 2 may be complete.
Primary wave 3 must move above the end of primary wave 1. Primary wave 3 may only subdivide as an impulse. Within the impulse, no second wave correction may move beyond the start of its first wave below 2,728.81.
When primary wave 3 is over, then primary wave 4 may be a shallow sideways consolidation that may not move into primary wave 1 price territory below 2,954.13.
Thereafter, primary wave 5 should move above the end of primary wave 3 to avoid a truncation.
A base channel is drawn about primary waves 1 and 2. The lower edge is drawn from the start of primary wave 1 to the end of primary wave 2, then a parallel copy is placed upon the high of primary wave 1. Along the way up, corrections within primary wave 3 may find support about the lower edge of the base channel. Primary wave 3 may have the power to break above the upper edge of the channel.
Today a new high above 2,892.15 has invalidated the alternate wave count in last analysis and offers further confidence to this wave count.
HOURLY CHART
Click chart to enlarge.
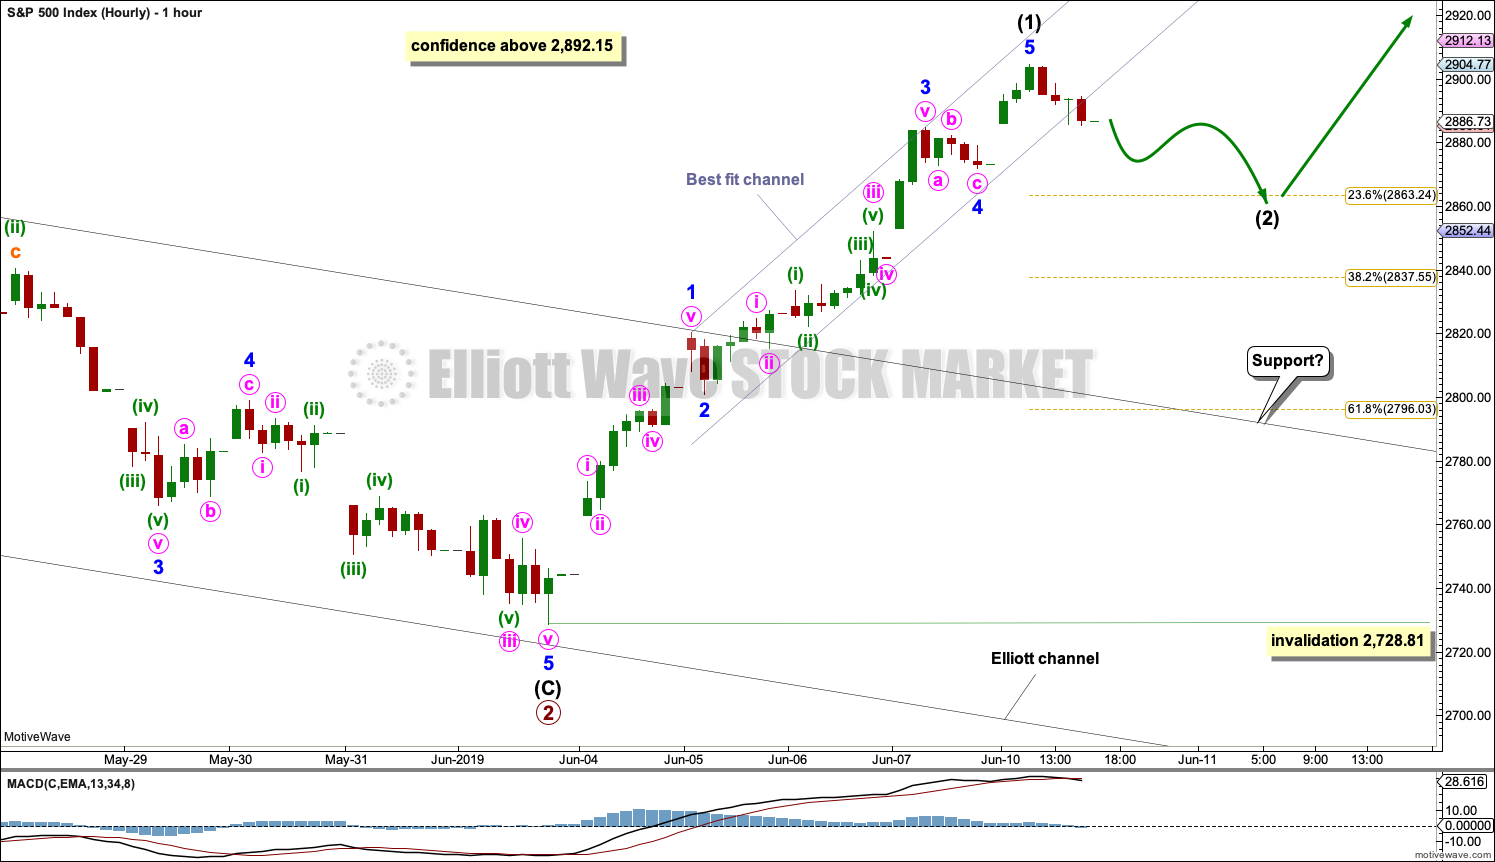
A five wave structure upwards now looks complete, labelled intermediate wave (1).
Fibonacci Ratios within intermediate wave (1) are: minor wave 3 is 7.56 points short of equality in length with minor wave 1, and minor wave 5 is just 0.83 longer than 0.382 the length of minor wave 3.
A best fit channel is drawn about upwards movement to be conservative and contain all of it. Today that channel is breached at the end of the session. This is an indication that the upwards wave may now be over.
Following a five up, a three back should develop. This will be labelled intermediate wave (2).
Due to the strong upwards pull of intermediate wave (3) within primary wave 3 just ahead, intermediate wave (2) may be forced to be relatively shallow. The 0.236 and 0.382 Fibonacci Ratios will be favoured targets. If intermediate wave (2) is deeper than this, then the lower edge of the black Elliott channel may provide final support for a back test.
Intermediate wave (2) may not move beyond the start of intermediate wave (1) below 2,728.81.
SECOND WAVE COUNT
WEEKLY CHART
Click chart to enlarge.
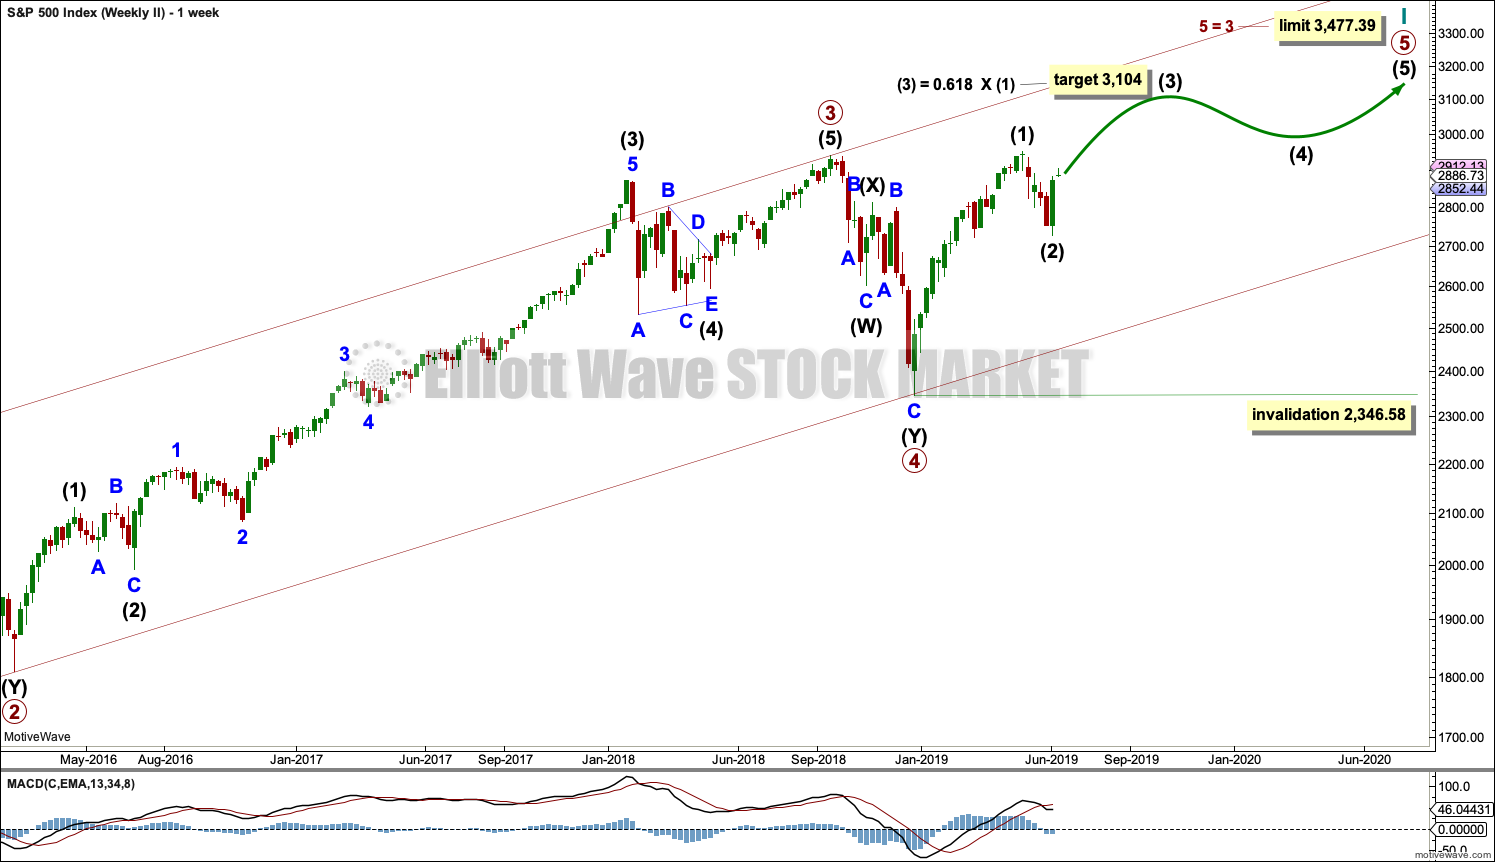
This weekly chart is almost identical to the first weekly chart, with the sole exception being the degree of labelling.
This weekly chart moves the degree of labelling for the impulse beginning in March 2009 all down one degree. This difference is best viewed on monthly charts.
The impulse is still viewed as nearing an end; a fifth wave is still seen as needing to complete higher. This wave count labels it primary wave 5.
TECHNICAL ANALYSIS
WEEKLY CHART
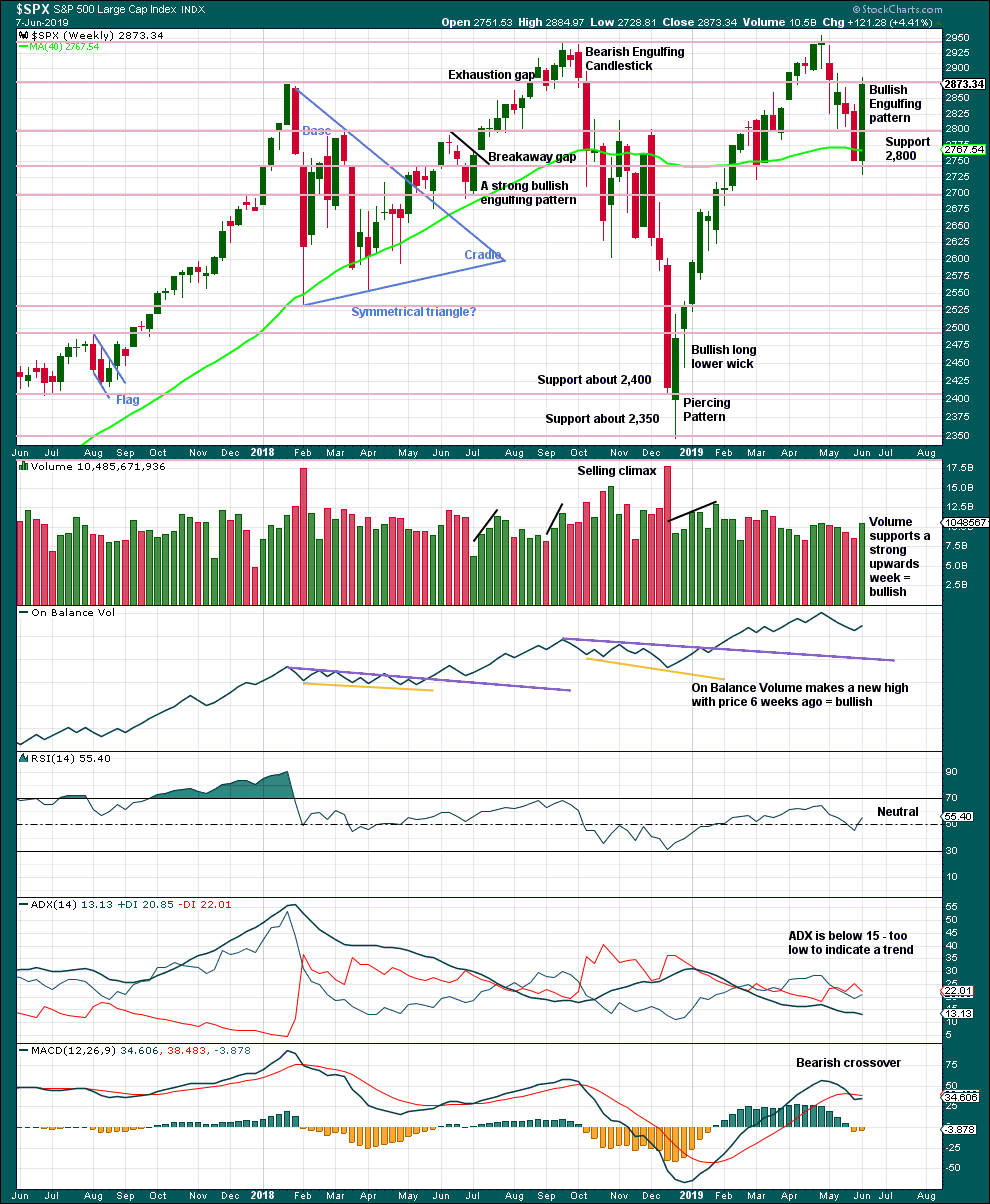
Click chart to enlarge. Chart courtesy of et=”_blank”>StockCharts.com.
Weight will be given in this analysis to the strong bullish reversal pattern, which has support from volume. This supports the main Elliott wave counts.
DAILY CHART
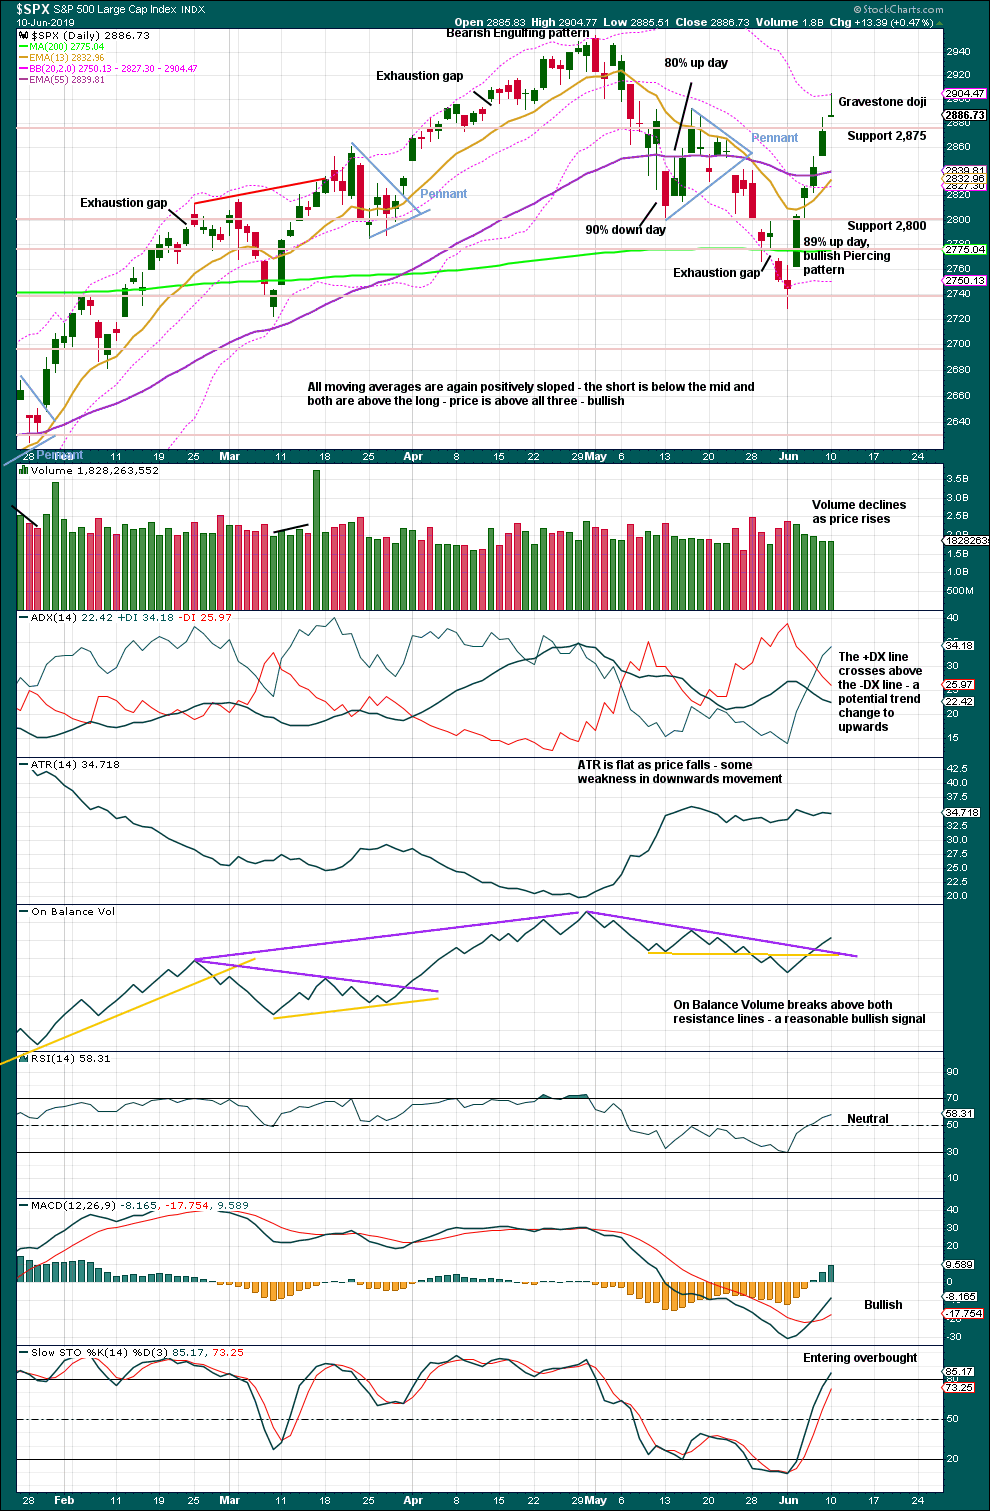
Click chart to enlarge. Chart courtesy of StockCharts.com.
Reasonable weight in this analysis is given today to the Gravestone doji candlestick pattern. The Gravestone doji forte is in calling market tops. This one comes after a rise of five sessions.
BREADTH – AD LINE
WEEKLY CHART
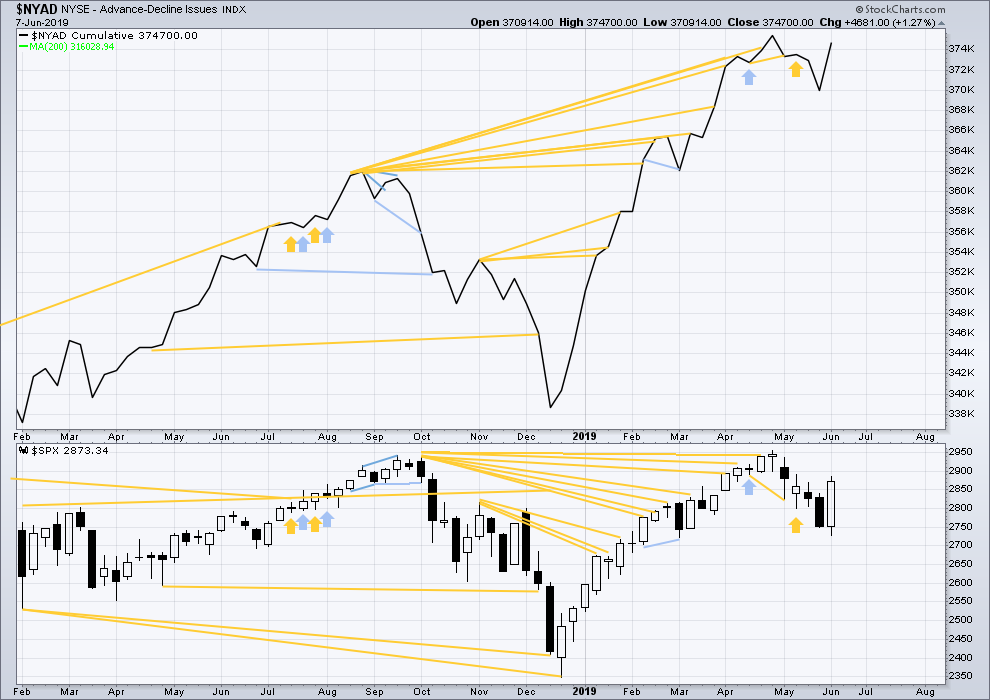
Click chart to enlarge. Chart courtesy of StockCharts.com. So that colour blind members are included, bearish signals
will be noted with blue and bullish signals with yellow.
Bear markets from the Great Depression and onwards have been preceded by an average minimum of 4 months divergence between price and the AD line with only two exceptions in 1946 and 1976. With the AD line making a new all time high on the 3rd of May, the end of this bull market and the start of a new bear market is very likely a minimum of 4 months away, which is the beginning of September 2019.
In all bear markets in the last 90 years there is some positive correlation (0.6022) between the length of bearish divergence and the depth of the following bear market. No to little divergence is correlated with more shallow bear markets. Longer divergence is correlated with deeper bear markets.
If a bear market does develop here, it comes after no bearish divergence. It would therefore more likely be shallow. The alternate Elliott wave count outlines this potential scenario.
Price has moved higher last week. Upwards movement has normal support from rising breadth. There is no divergence.
All of small mid and large caps are moving higher. Large caps are strongest; this is normal for the later stages of a bull market.
DAILY CHART
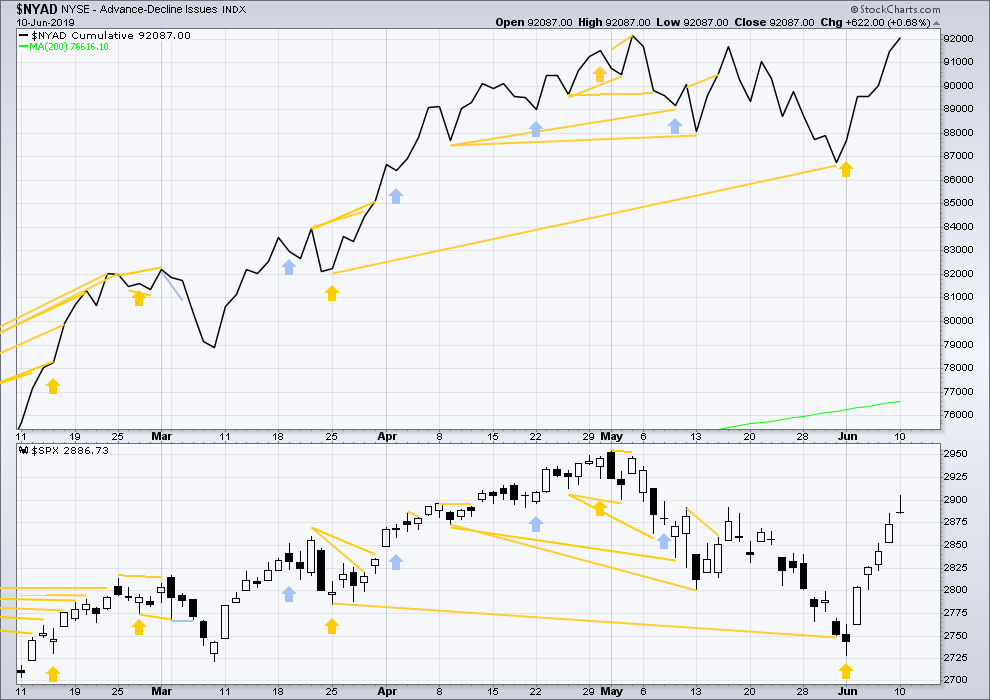
Click chart to enlarge. Chart courtesy of StockCharts.com. So that colour blind members are included, bearish signals
will be noted with blue and bullish signals with yellow.
Breadth should be read as a leading indicator.
Both price and the AD line have today moved higher. Neither have yet made new all time highs, but the AD line is extremely close. Breadth is rising a little faster than price. This is bullish.
VOLATILITY – INVERTED VIX CHART
WEEKLY CHART
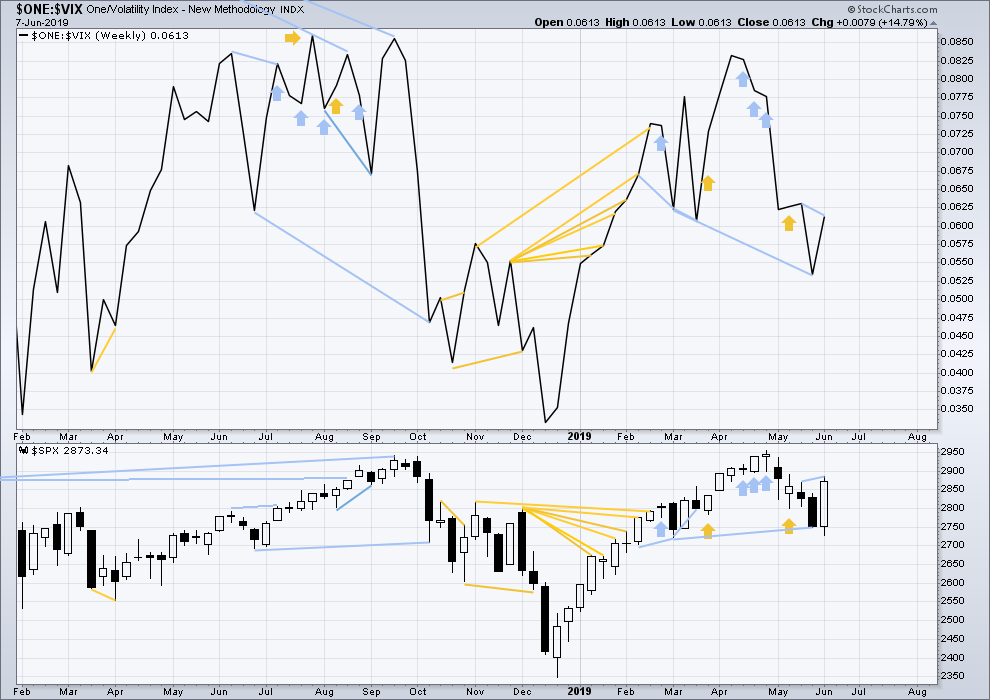
Click chart to enlarge. Chart courtesy of StockCharts.com. So that colour blind members are included, bearish signals
will be noted with blue and bullish signals with yellow.
Inverted VIX has made a new low below the low of the 4th of March, but price has not. Downwards movement comes with a strong increase in VIX, which is increasing faster than price. This divergence is bearish, but will not be given much weight in this analysis at this time.
Last week price has made a new high above the high of two weeks ago, but inverted VIX has not. Price is rising faster than VIX is falling. This divergence is bearish for the short term.
DAILY CHART
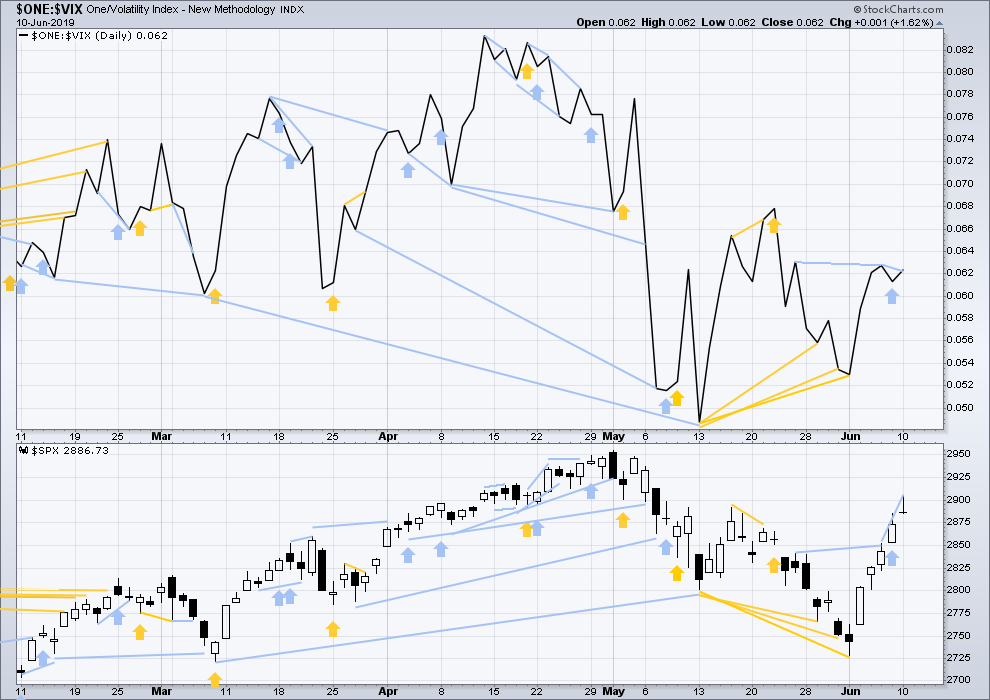
Click chart to enlarge. Chart courtesy of StockCharts.com. So that colour blind members are included, bearish signals
will be noted with blue and bullish signals with yellow.
Price has moved higher for Friday, but inverted VIX has moved lower. Upwards movement in price does not come with a normal corresponding decline in VIX. VIX has increased for the session. This divergence is bearish.
Today price has made a new high above the prior high two sessions prior, but inverted VIX has not. Bearish divergence has developed further and supports the Elliott wave count.
DOW THEORY
Dow Theory confirmed a bear market in December 2018. This does not necessarily mean a bear market at Grand Super Cycle degree though; Dow Theory makes no comment on Elliott wave counts. On the 25th of August 2015 Dow Theory also confirmed a bear market. The Elliott wave count sees that as part of cycle wave II. After Dow Theory confirmation of a bear market in August 2015, price went on to make new all time highs and the bull market continued.
DJIA: 23,344.52 – a close on the 19th of December at 23,284.97 confirms a bear market.
DJT: 9,806.79 – price has closed below this point on the 13th of December.
S&P500: 2,532.69 – a close on the 19th of December at 2,506.96 provides support to a bear market conclusion.
Nasdaq: 6,630.67 – a close on the 19th of December at 6,618.86 provides support to a bear market conclusion.
With all the indices having moved higher following a Dow Theory bear market confirmation, Dow Theory would confirm a bull market if the following highs are made:
DJIA: 26,951.81
DJT: 11,623.58
S&P500: 2,940.91 – a new all time high has been made on the 29th of April 2019.
Nasdaq: 8,133.30 – a new high has been made on 24th of April 2019.
Published @ 06:28 p.m. EST.
—
Careful risk management protects your trading account(s).
Follow my two Golden Rules:
1. Always trade with stops.
2. Risk only 1-5% of equity on any one trade.
—
New updates to this analysis are in bold.
Hi everyone, sorry I’m rather late today.
Updated hourly chart:
An expanded flat may be only wave A of a larger flat, or wave W of a double combination or double flat.
it looks too brief and too shallow to be over at todays low. that just doesn’t have the right look, even though I am expecting intermediate (2) to be relatively brief and shallow.
Thank you for taking the time to address my question. I appreciate the insight and need the education.
Closed my shorts….
Looks like an expanding flat to me as well. My question is, if it falls short of the projected targets, is it likely part of a combination or is the assumption that the I-2 is complete based upon the merit of starting the I-3? For those more experienced than me, are there any tricks to connecting the dots on this?
No “trick” I know of except to watch price for indications of what might be up. Right now…looking a bit dim IMO for the bullish view that the int. 2 is over. The move up off the lows is weak and not operating in any impulsive manner. Combined with the fact that as an int. 2, this thing is much too short and shallow, even for a “short and shallow” 2! And of course if today’s lows are undercut then by definition “there’s more” and possibly lots more.
I fully agree with that assessment. A 50% retrace would put us at roughly 2825 SPX. That is very possible. Lara gives good reason to support the idea this correction might be shallow. If we are in an Intermediate 3 of a Primary 3, we should not be surprised if market surprises are bullish.
In order to state that the correction is over, we need to eliminatesome 23 different corrective patterns for a second wave. To do that, I think we would at least need to make a new high above this morning’s high around 2910. Even at that, I would only rely on Lara’s preferred hourly update tonight. This is a time of uncertainly by EW standards. It is quite possible the market may correct lower to the 38% retrace. On the other hand, the market could break upwards with Intermediate 2 completed.
After my initial 33% long position at 2730 or so, I waited for a correction to buy more longs. It didn’t develop. I took another partial position at about 2820 bringing me to 50% still looking for a deeper correction. And at yesterday’s close, I bought the final 50% at 2886. I was tired of waiting and seeing the market continue a relentless grind or surge upwards. When the market moves big time, like 65 points up in a day, there is a good chance many will be caught chasing the market and never really getting positioned. After that, the Fear of Getting Left Behind begins to push the market much higher.
We are approaching a 3rd of a 3rd at several degrees. My long term outlook is for Lara’s target of 3100 on the SPX. I think by fall. But there are alternate weekly counts that have much higher targets.
Hope it helps. As always, I love feed back. Our discussions can help everyone be more successful at making money in these markets.
Maybe your thoughtful bullishness float all our boats, Rodney! By the way I went out with the sharks yesterday, 90 degrees here in SF with a 2-3′ swell and very little wind, if ever there was a surf day yesterday was it, and I got out on my custom 6’5″ “big fish” quad fin. I got a big fish because I’m not a big guy and at Ocean Beach you need fast paddling to rocket outside when you get a break in the wave trains. And it allows me to get in a little earlier because it’s also a thick fish, which is nice at OB because more often than not it’s a steep pitching kind of wave. Here’s a pic of the gorgeous wooden quad fins. Now what’s particularly magical for me about this board is when it cranks up to speed…those fins whistle, and I mean pretty loudly!! I guess that’s “bad” because it’s shedding a little energy but I dig it! Got a nice foam ball 3′ left yesterday, I just kind of fit inside scrunched up like. Now I am officially someone “surfing in their 60’s” (first surf since 60 happened).
A very nice fin set up Kevin. That looks like Cesar’s Speed Dialler, and he sure can dial up some speed on that!
I do really like the beautiful wood grain in it
Sadly, no surfing for me now for nearly 6 weeks 🙁 No waves in Austin. NLand has been bought and shut down by WSL which also owns Kelly Slaters Surf Ranch. Something something surfing tour something.
I’m very salty on them and KS right now.
Loving those fins Kevin. I had a board that whistled as well-now I use a Hayden Shapes Hypto Crypto out at ocean beach- it carries a ton of volumne forward and has paddle power which you are right on target about when it comes to OB- so many times I felt like I was ‘paddeling hard for the outside in fear for my life’
3 ft with off shore winds and a corky board is a perfect recipe for OB. Cant stand the cold sharkey water and good lord getting into and out of a wetsuit burns half the day lol. I just landed in Bali with 10ft+ waves in Uluwatu. Great to hear youre surfing a 60 something years young. I’m just about a 38.2% retracement younger lolol.Praise the wave gods! Praise the trading gods!
I don’t know the lingo but I still get the gist of your joy and fun. Thanks also for sharing the photo. I grew up in the US midwest (Chicago) where no waves for surfing occur. Back in the day, I tried surfing once when in Hawaii. But I gave up quickly to pursue underwater diving. Glad you had such an awesome surfing day.
Sweet!
Here are the stocks I have in “set up” position for taking long with a small profit target (3-3.8% depending on the volatility of the stock), with deep stops (11-18%, usually 15%), when they initiate turns at the 5 minute/hourly levels. To appreciate why I like these, you have to look at weekly, daily, and hourly time frames. Ideally some of these initiate turns in coordination with the start of the intermediate 3, whenever that might occur. Probably several days at least.
TCDA, APLS, AXSM, COUP, MRCY, CHRS, IBP, PI, SAGE, NOW, PANW, PAY, RUN, BOOM, PI
Enough for me to work with. In general I’m trading small size but very widely (lots of positions), and taking profits quick and looking for the next set up quickly. As the intermediate 3 kicks off, I will be jacking up position sizes and up’ing my total cash in to over 90% to take advantage. I will probably maintain about 20 positions by that time, each at about 4.5% of total equity. If you have edge and low cost, you smooth and reduce variance in your equity curve by going broad (diversifying -> many smaller trades vs. a few big ones). A 3 of a 5 gives fundamental edge, and judicious selection and entry gives more. Love this game…we’ll see!! Patience now….
Thanks for sharing Kevin 🙂
Still short. Just don’t know how to chArt this …. yet
expanding flat?
Yeah. My thought too.
The 23.6% at 2868 could work as the bottom overall. Pretty darn small for an intermediate 2, but it doesn’t matter, if we see some impulsive action off this expanded flat structure with a decent turn off that fibo level, the bull will be roaring for a bit and that’s all that really matters.
That all said I will be zero surprised to see this extend out for another 3-8 days doing backing and filling to a significantly deeper level. “A real 2…”
Patience is the game here, for me.
I think it needs to complete I2 then minor 1 & minor 2 by Wed next week…. FOMC next week & rate cut, could potentially provide the minor 3 of I3 of P3 …. 🙂
I made this comment earlier and edited it. As a result of editing a comment with a web link, it now awaits moderation and is not visible to you. So I am reposting it. Lara or Cesar, please delete the earlier post.
————————————————————————————————————-
It is unbelievable to me, but the Fear-Greed Indicator is at 34 which is still squarely in the fear camp (https://money.cnn.com/data/fear-and-greed/). I would have assumed by now that this indicator would have been in the 50’s at least. We have seen an almost 200 point rally and yet fear still dominates the market sentiment. I suspect that is a good thing for those who are bullish and holding long positions.
In addition, the June 6th AAII sentiment survey shows 22.53% bullish and 42.58% bearish. This is the highest bearish percentage since the low in Dec 2018! This is hard to fathom for me. But it is a very good indication this bull rally has a long way to go. All those bears will turn into bulls before this market turns into a longer term correction.
FWIW … Looking for the ES level @ 2911.25 as the top of wave one. Entirely possible that there will be an overshoot for obfuscation. But once ES 2911.25 trades, it’s completed intermediate wave 1.
Chart monkey…that was an awfully close call.
Tell us where the bottom of the int 2 is going to be, okay? TY in advance!!
It is unbelievable to me, but the Fear-Greed Indicator is at 34 which is still squarely in the fear camp (https://money.cnn.com/data/fear-and-greed/). I would have assumed by now that this indicator would have been in the 50’s at least. We have seen an almost 200 point rally and yet fear still dominates the market sentiment. I suspect that is a good thing for those who are bullish and holding long positions.
In addition, the June 6th AAII sentiment survey shows 22.53% bullish and 42.58% bearish. This is the highest bearish percentage since the low in Dec 2018! This is hard to fathom for me. But it is a very good indication this bull rally has a long way to go. All those bears will turn into bulls before this market turns into a longer term correction.
The following is from Bulkowski’s pattern site where he analyzes candlestick patterns. No one is perfect including Bulkowski. But I find his site quite educational and helpful. For those interested, the link for the gravestone dogi is:
http://www.thepatternsite.com/Gravestone.html
————————————————————————————————————–
Gravestone Doji Discussion
The actual, tested, behavior of the gravestone doji matches the theoretical performance: indecision or randomness, packaged into a tight little bundle of joy. Price closes at the bottom of the candlestick and price should breakout downward most often, which it does.
The gravestone doji is rare in a bear market, which I find odd. That can be due to the dearth of bear markets, but the ratio of bullish to bearish sightings is about 15 to 1.
Once price breaks out, the performance is lousy, ranking 77 — near the bottom of the list. That means price does not trend far after a breakout. However, after an upward breakout in a bear market, price moves higher by 5.09% in 10 days, which is quite good. When you consider that price closed at the bottom of this candlestick, the climb is even higher (because I measure from a close above the top of the candlestick as the breakout, and do not start counting from the bottom of the doji). Using the height of the candle projected in the direction of the breakout shows that the trend meets the predicted target 79% of the time, which I consider acceptable.
———————————————————————————————————–
Bulkowski only measures results over a few hundred (often 100-200) actual cases.
That’s nowhere close to driving the average result close to any actual mean value for a variance system like the stick market. So the result he presents for all his patterns are essentially random. For high variance data (i.e., market behavior!) you need tens of thousands of data points to get to small confidence intervals on your results.
Note the opposite occurs when you get a small number of “all the same” events. Like some of Ciovacco’s historical tests where 16 out of 16 times the market was up substantially after 2 years. To get 16/16 implies a HUGE probability of success (95% or so). At 95%, you might get 16/16 about 50% of the time that you measure a fresh set of 16 such events.
But when you are measuring things that have for example a 55% of “going up” and 45% of “going down”…you need boatloads of data to “discover” those underlying probabilities, and small data sets like 150 will only mislead you. My $0.02!
Bulkowski only measures results over a few hundred (often 100-200) actual cases.
That’s nowhere close to driving the average result close to any actual mean value for a high variance system like the stick market. So the results he presents for all his patterns are little better than random…in my mathematical view. For high variance data (i.e., market behavior!) you need tens of thousands of data points to get to small confidence intervals on your results.
Note the opposite occurs when you get a small number of “all the same” events. Like some of Ciovacco’s historical tests where 16 out of 16 times the market was up substantially after 2 years. To get 16/16 implies a HUGE probability of success (95% or so). At 95%, you might get 16/16 about 50% of the time that you measure a fresh set of 16 such events.
But when you are measuring things that have for example a 55% of “going up” and 45% of “going down”…you need boatloads of data to “discover” those underlying probabilities, and small data sets like 150 will only mislead you. My $0.02!
#1 again? I’m on FIRE, ready to pounce on a sweet Wave 3 soon!
Where is everyone? Rodney?
Man, I just got home and I’m waiting for dinner. You still got me again. Perhaps I am defeated. No, the game continues. Tom Bradey is going for another Super Bowl, why can’t I win one more as well. We shall see Ron. We shall see.
BTW, my final long positions were acquired at the close today. Remember, surprises will be to the upside. I am locked and loaded, lets go bull.
Perhaps, “locked and loaded” wasn’t such a good choice of words. My apologies to anyone who may not like such words. I am perhaps the farthest thing from a man of violence. I have hunted to harvest meat. But I just couldn’t do it anymore.
Hopefully we’re all big boys and girls here, and not too easily “triggered”. (See what I did there?)