More upwards movement was expected from the S&P500 for Wednesday’s session, which is what has happened.
Summary: The low of December 2018 is expected to most likely remain intact.
The pullback may have ended. A new target for a third wave up is at 3,104.
The alternate wave count considers the possibility that a relatively short lived bear market may have begun. The target is at 2,080. This wave count has a fairly low probability, but it is a possibility that must be acknowledged. This possibility may now be discarded with a new high above 2,892.15.
The biggest picture, Grand Super Cycle analysis, is here.
Monthly charts were last published here, with video here. There are two further alternate monthly charts here, with video here.
ELLIOTT WAVE COUNTS
The first two Elliott wave counts below will be labelled First and Second. They may be about of even probability. When the fifth wave currently unfolding on weekly charts may be complete, then these two wave counts will diverge on the severity of the expected following bear market. To see an illustration of this future divergence monthly charts should be viewed.
The alternate Elliott wave count has a very low probability.
FIRST WAVE COUNT
WEEKLY CHART
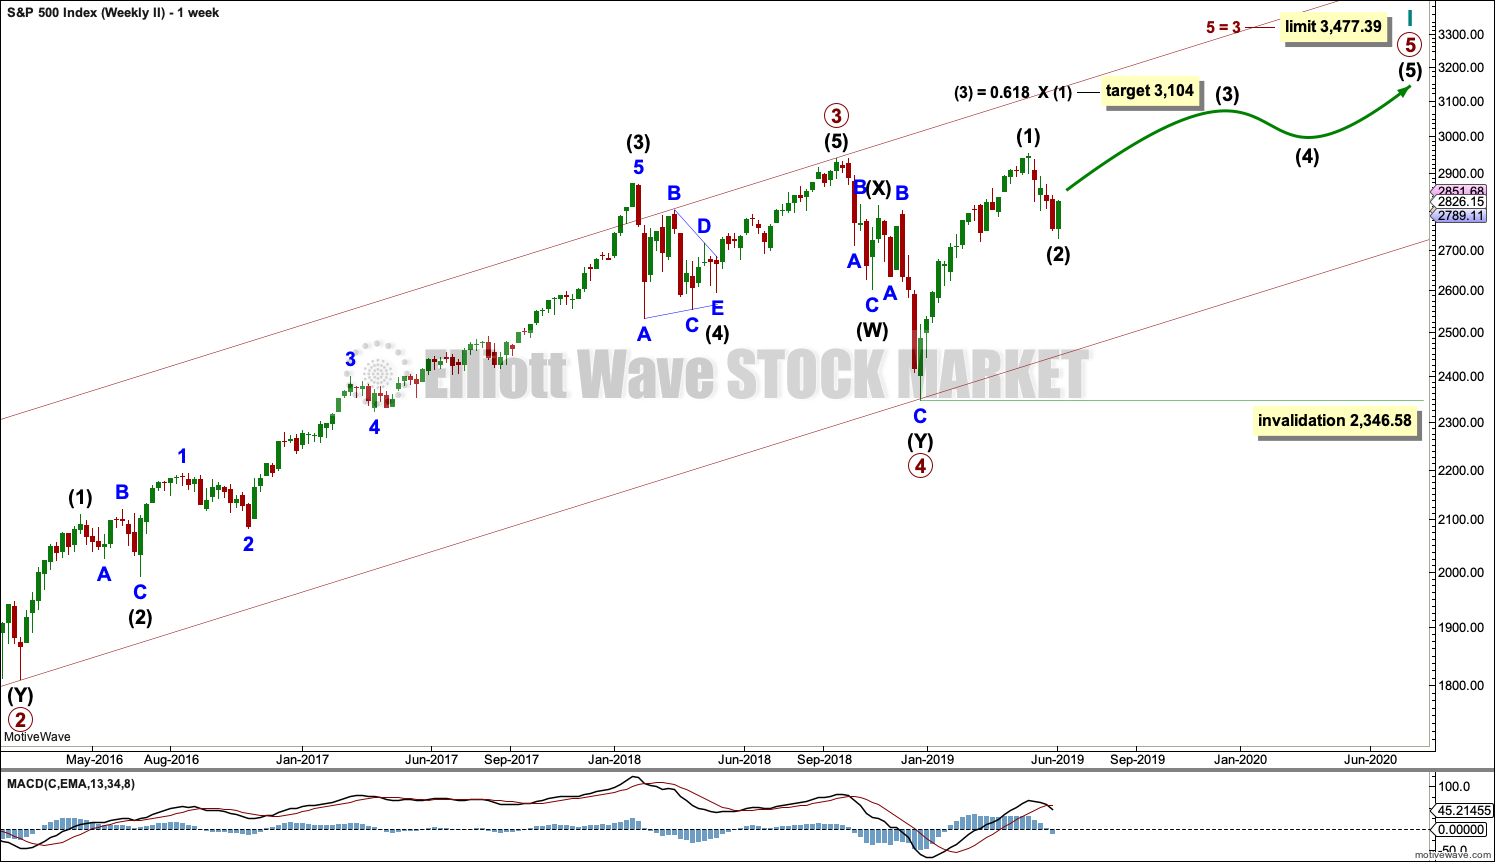
The basic Elliott wave structure consists of a five wave structure up followed by a three wave structure down (for a bull market). This wave count sees the bull market beginning in March 2009 as an incomplete five wave impulse and now within the last fifth wave, which is labelled cycle wave V. This impulse is best viewed on monthly charts. The weekly chart focusses on the end of it.
Elliott wave is fractal. This fifth wave labelled cycle wave V may end a larger fifth wave labelled Super Cycle wave (V), which may end a larger first wave labelled Grand Super Cycle wave I.
The teal Elliott channel is drawn using Elliott’s first technique about the impulse of Super Cycle wave (V). Draw the first trend line from the end of cycle wave I (off to the left of the chart, the weekly candlestick beginning 30th November 2014) to the end of cycle wave III, then place a parallel copy on the end of cycle wave II. This channel perfectly shows where cycle wave IV ended at support. The strongest portion of cycle wave III, the end of primary wave 3, overshoots the upper edge of the channel. This is a typical look for a third wave and suggests the channel is drawn correctly and the way the impulse is counted is correct.
Within Super Cycle wave (V), cycle wave III is shorter than cycle wave I. A core Elliott wave rule states that a third wave may never be the shortest. For this rule to be met in this instance, cycle wave V may not be longer in length than cycle wave III. This limit is at 3,477.39.
The structure of cycle wave V is focussed on at the daily chart level below.
Within cycle wave V, primary wave 2 may not move beyond the start of primary wave 1 below 2,346.58.
In historic analysis, two further monthly charts have been published that do not have a limit to upwards movement and are more bullish than this wave count. Members are encouraged to consider those possibilities (links below summary) alongside the wave counts presented on a daily and weekly basis.
DAILY CHART
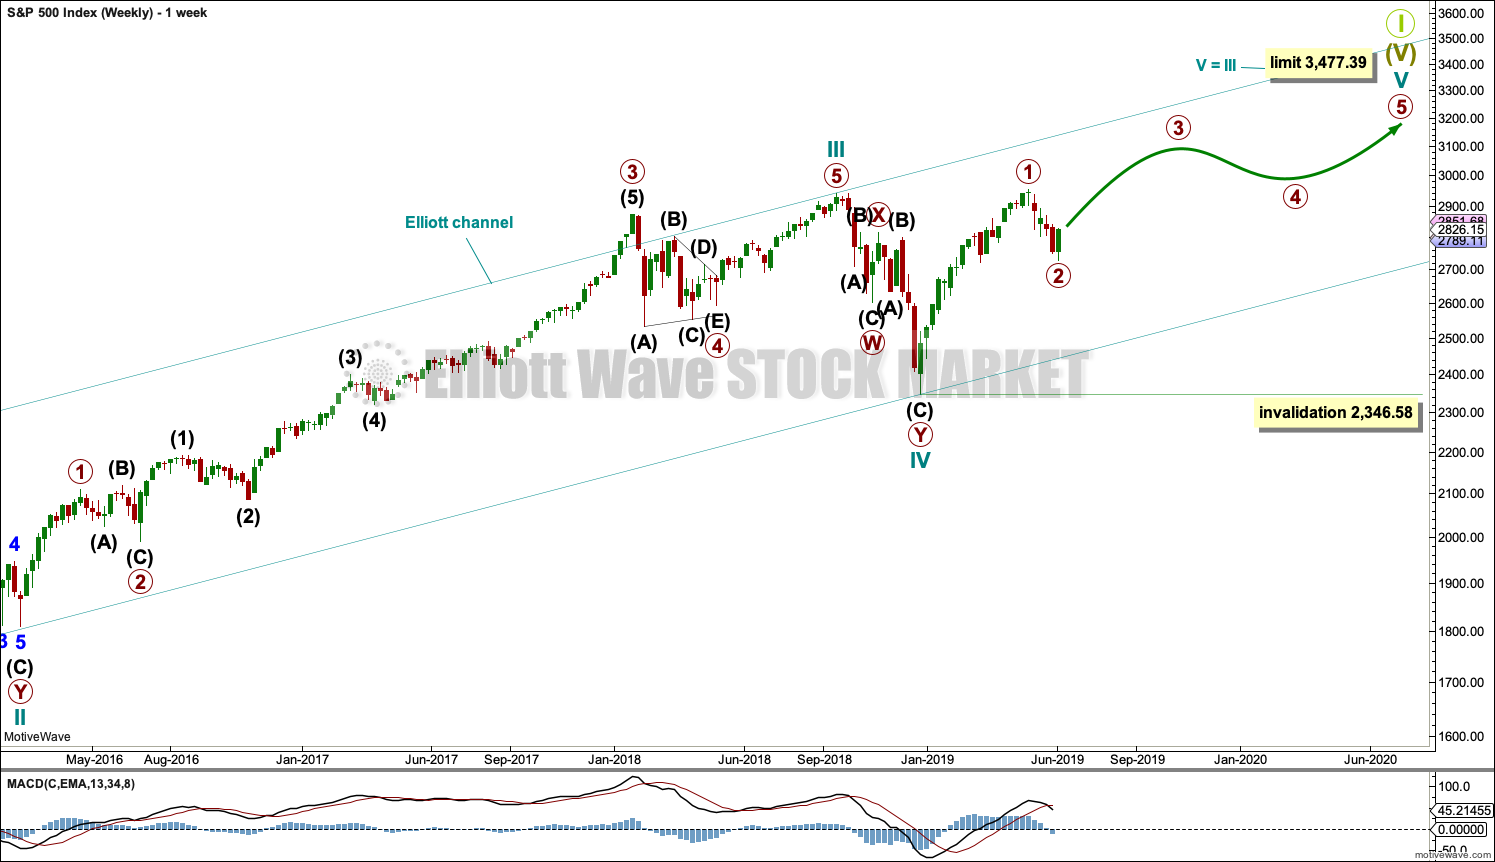
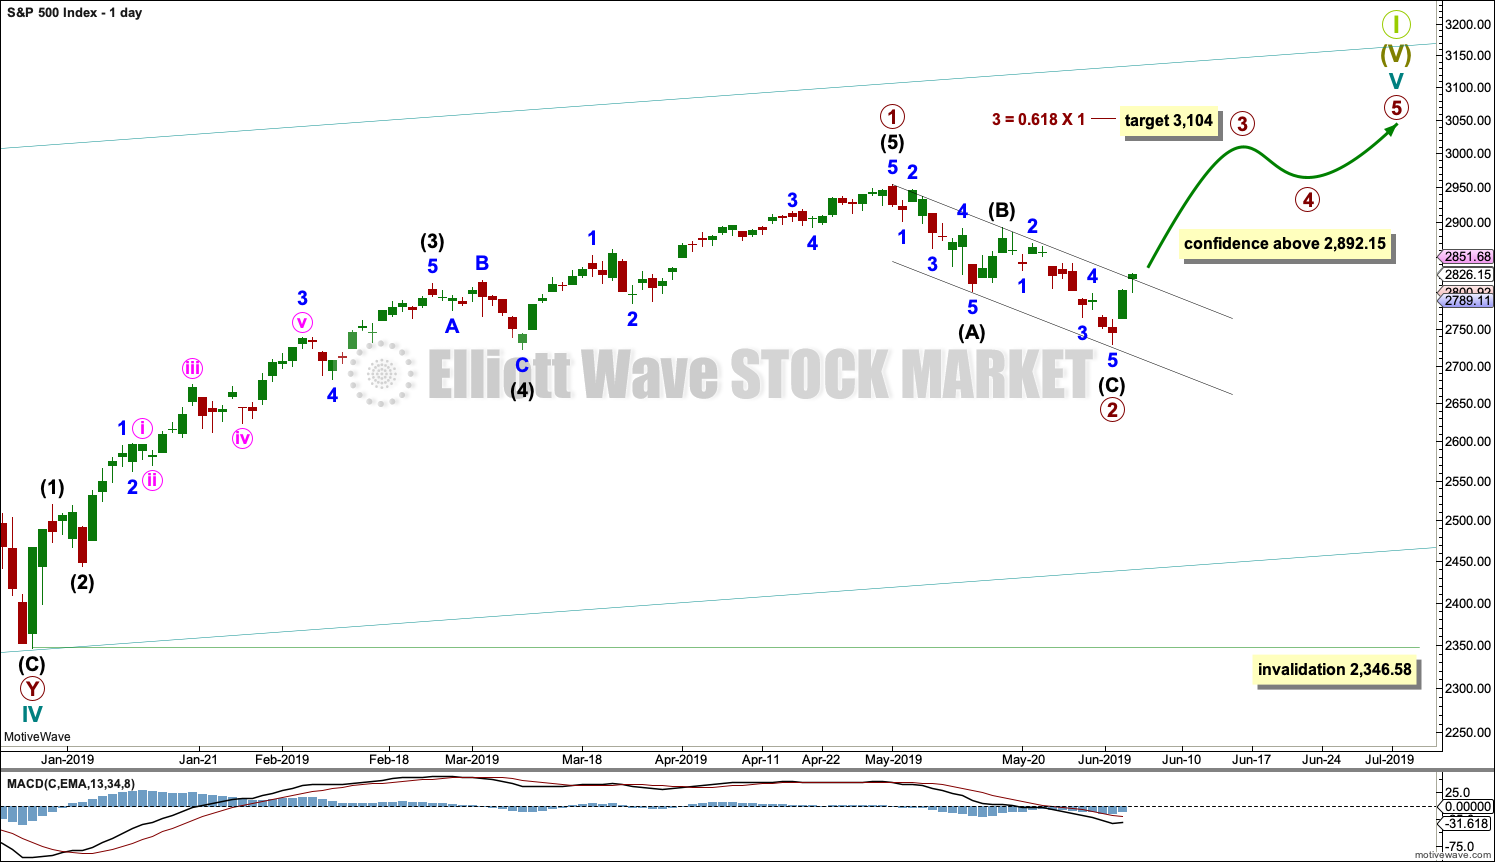
Cycle wave V must subdivide as a five wave motive structure. Within that five wave structure, primary wave 1 may be complete. Primary wave 2 may now be complete.
Primary wave 3 must move above the end of primary wave 1.
When primary wave 3 is over, then primary wave 4 may be a shallow sideways consolidation that may not move into primary wave 1 price territory below 2,954.13.
Thereafter, primary wave 5 should move above the end of primary wave 3 to avoid a truncation.
If it continues further, then primary wave 2 may not move beyond the start of primary wave 1 below 2,346.58.
Draw a channel about primary wave 2 using Elliott’s technique. Draw the first trend line from the start of intermediate wave (A) to the end of intermediate wave (B), then place a parallel copy on the end of intermediate wave (A). Intermediate wave (C) may have ended today almost perfectly at support at the lower edge of this channel.
When the channel is breached by upwards movement, it shall be used to provide confidence that the pullback for primary wave 2 is over and primary wave 3 would then be expected to be underway. Today price has closed above the upper edge of the channel, but the channel is not yet properly breached by a full daily candlestick above and not touching the upper edge.
At this stage, a new high above 2,892.15 would invalidate the alternate wave count below and offer some confidence to this wave count.
HOURLY CHART
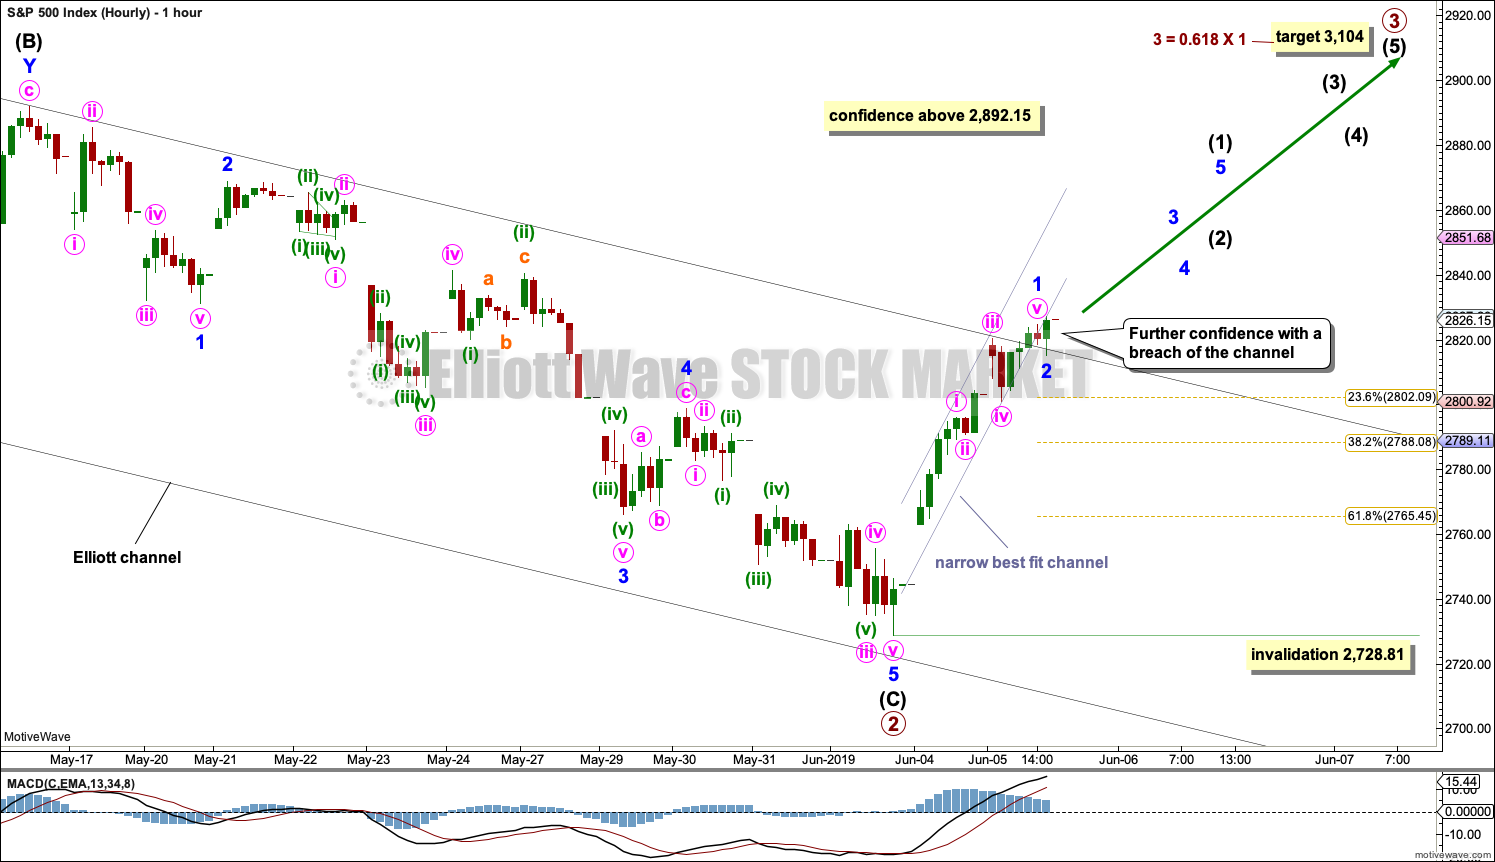
Price has just broken above the upper edge of the black Elliott channel with a full hourly candlestick above and not touching the upper edge. This adds further confidence that primary wave 2 may be over.
Further confidence would come with a new high above 2,892.15 and invalidation of the bearish alternate below.
Minor wave 1 is labelled as complete because a narrow channel drawn about it to contain all of it was broken at the end of the session. Minor wave 1 fits as a completed five wave impulse.
Minor wave 2 is now tentatively also labelled as complete; but if this short term analysis is wrong, it would be in expecting an end to minor wave 2 prematurely. It is entirely possible that minor wave 2 may continue lower or sideways for another one to two sessions.
Minor wave 2 may have found support about the upper edge of the channel for a back test. The S&P often exhibits surprisingly brief and shallow second wave corrections. There is a recent example on the daily chart: after the end of cycle wave IV, intermediate wave (2) lasted three sessions and was shallow at 0.44 of intermediate wave (1). The next second wave correction was minor wave 2 within intermediate wave (3). That lasted only one session and was very shallow at just 0.22 of minor wave 1.
If the current minor wave 2 is complete, then it may have been very brief and only 0.10 of minor wave 1. It is possible that support at the upper edge of the channel may force it to be very shallow.
If minor wave 2 does continue sideways or lower, then the Fibonacci Ratios of minor wave 1 would be reasonable targets, with the 0.236 and 0.382 Fibonacci Ratios favoured as the upwards pull of a third wave may force corrections to be relatively shallow.
Minor wave 2 may not move beyond the start of minor wave 1 below 2,728.81.
SECOND WAVE COUNT
WEEKLY CHART
This weekly chart is almost identical to the first weekly chart, with the sole exception being the degree of labelling.
This weekly chart moves the degree of labelling for the impulse beginning in March 2009 all down one degree. This difference is best viewed on monthly charts.
The impulse is still viewed as nearing an end; a fifth wave is still seen as needing to complete higher. This wave count labels it primary wave 5.
ALTERNATE WAVE COUNT
WEEKLY CHART
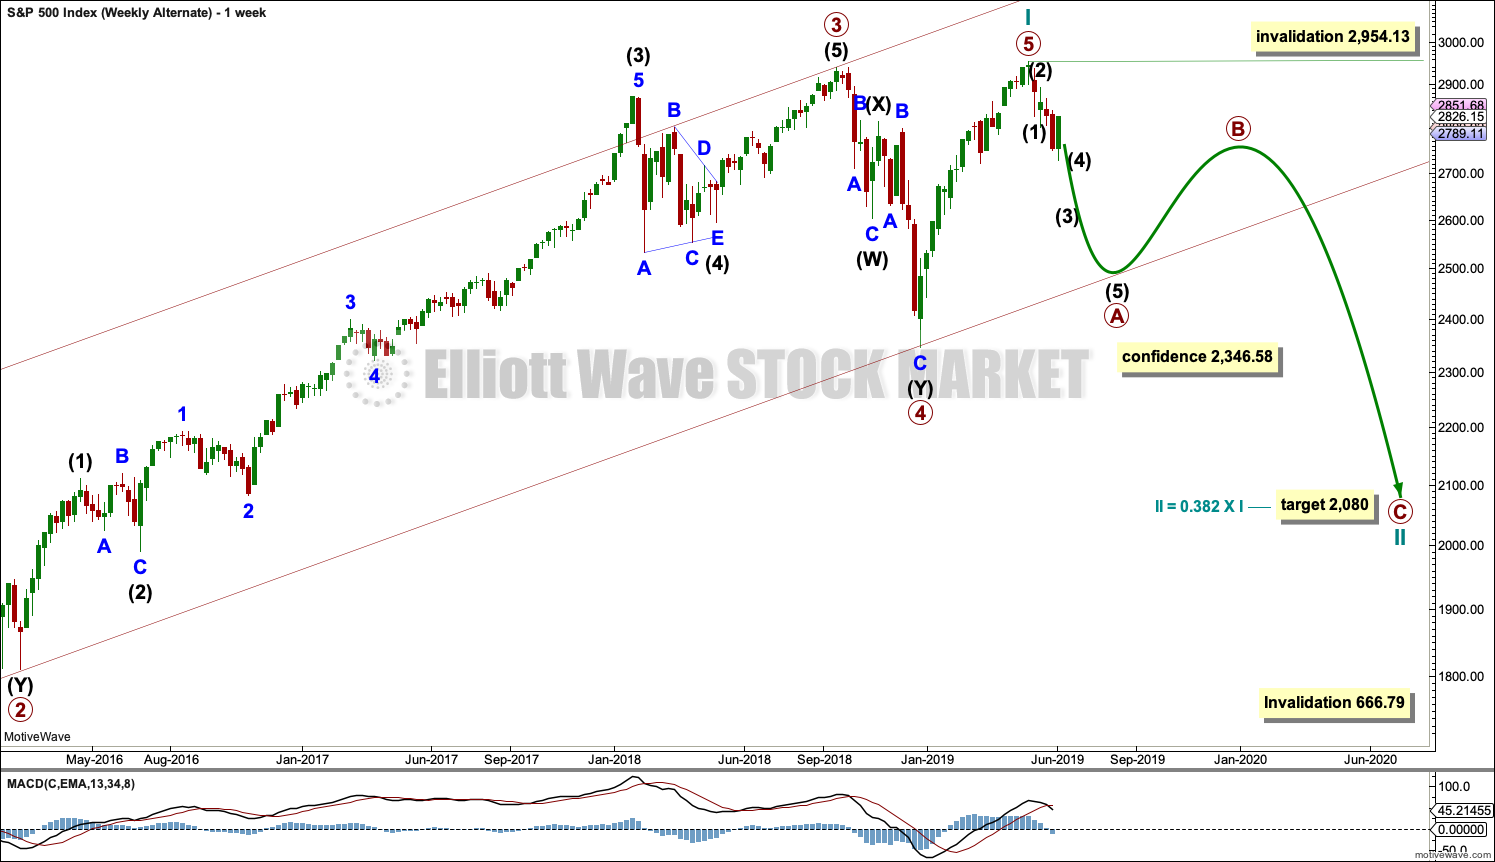
It is possible that for the second wave count cycle wave I could be complete. Primary wave 5 may be seen as a complete five wave impulse on the daily chart.
If cycle wave I is complete, then cycle wave II may meet the definition of a bear market with a 20% drop in price at its end.
Within cycle wave I, primary wave 1 was a very long extension and primary wave 3 was shorter than primary wave 1 and primary wave 5 was shorter than primary wave 3. Because primary wave 1 was a long extension cycle wave II may end within the price range of primary wave 2, which was from 2,132 to 1,810. The 0.382 retracement of cycle wave I is within this range.
Cycle wave II may not move beyond the start of cycle wave I below 666.79.
This wave count does not have support at this time from classic technical analysis.
DAILY CHART
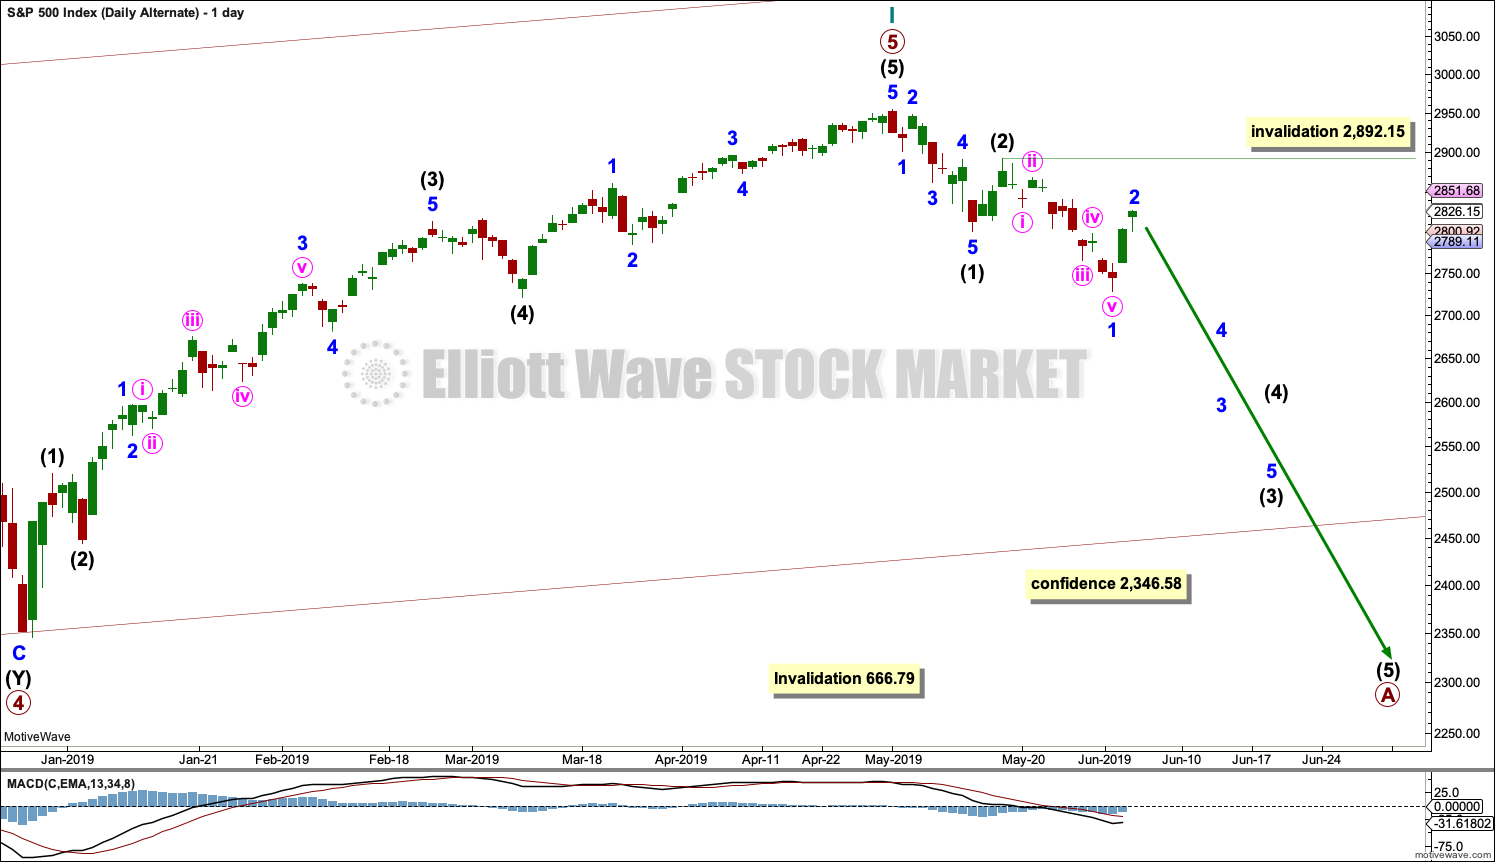
The most likely structure for cycle wave II would be a zigzag. Within a zigzag, primary wave A would subdivide as a five wave structure, most likely an impulse. Within the impulse of primary wave A, so far intermediate waves (1) and (2) may be complete and intermediate wave (3) has moved below the end of intermediate wave (1) and may be incomplete.
Intermediate wave (3) would reach 1.618 the length of intermediate wave (1) at 2,645.
Intermediate wave (3) may only subdivide as an impulse. Within the impulse, minor wave 1 may be complete. Minor wave 2 may not move beyond the start of minor wave 1 above 2,892.15. At this stage, a new high above this point would see this alternate wave count discarded.
Within the zigzag, primary wave B may not move beyond the start of primary wave A.
TECHNICAL ANALYSIS
WEEKLY CHART
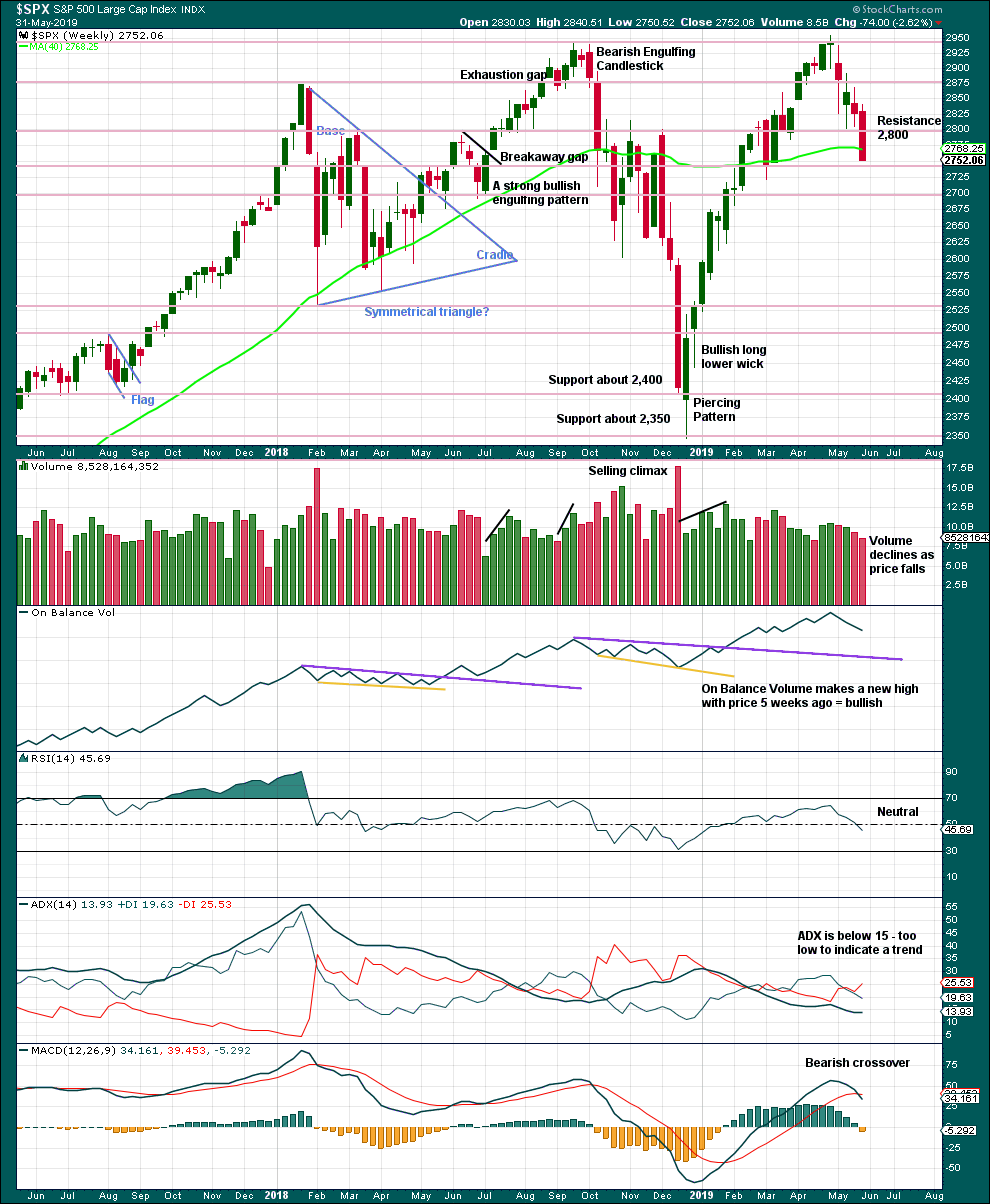
Click chart to enlarge. Chart courtesy of et=”_blank”>StockCharts.com.
There is an upwards trend from the low in December 2018, a series of higher highs and higher lows with a new all time high on the 30th of April 2019. The last swing low at 2,785.02 on the 25th of March has now been breached, so a trend change is now possible.
Last weekly candlestick closes with strong downwards movement and almost no lower wick. The lack of a lower wick strongly suggests more downwards movement this week. It is possible that downwards movement to begin the week for Monday has fulfilled this expectation, but it is also possible that it may continue.
DAILY CHART
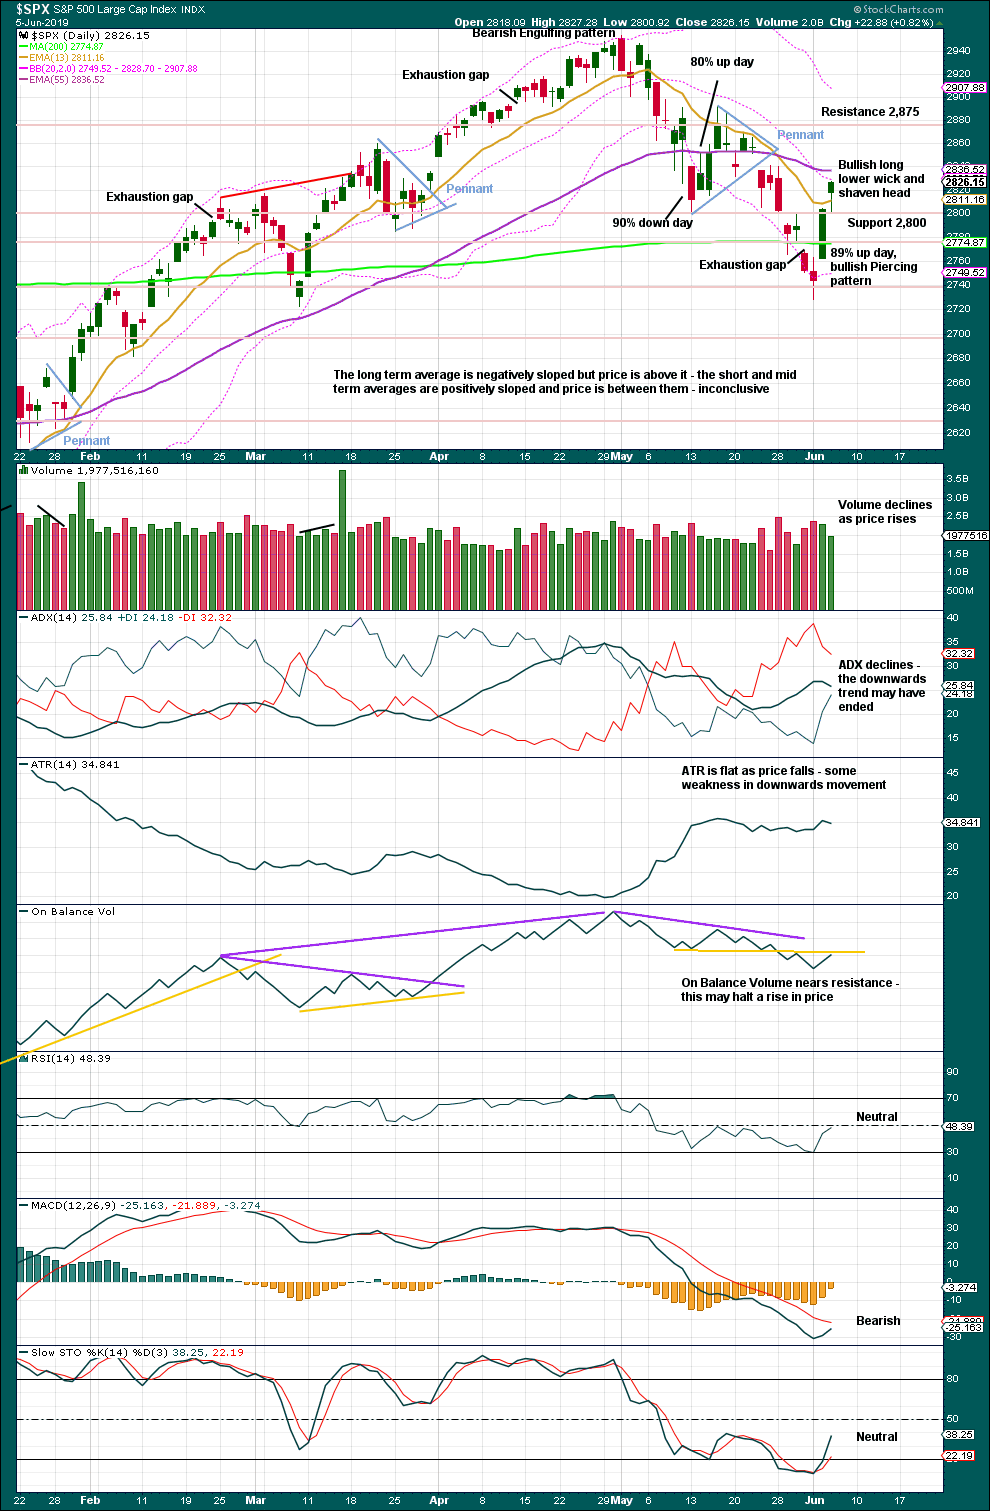
Click chart to enlarge. Chart courtesy of StockCharts.com.
Today completes Hanging Man, but the long lower wick and almost shaven head are bullish. A Hanging Man candlestick pattern is essentially a two candlestick pattern as the bullish implications of the long lower wick require bearish confirmation in the following candlestick.
Declining to flat ATR as price falls supports the first two Elliott wave counts and indicates the alternate looks less likely.
Lowry’s data indicates Buying Power has crossed back above Selling Pressure. This supports the main Elliott wave count.
BREADTH – AD LINE
WEEKLY CHART
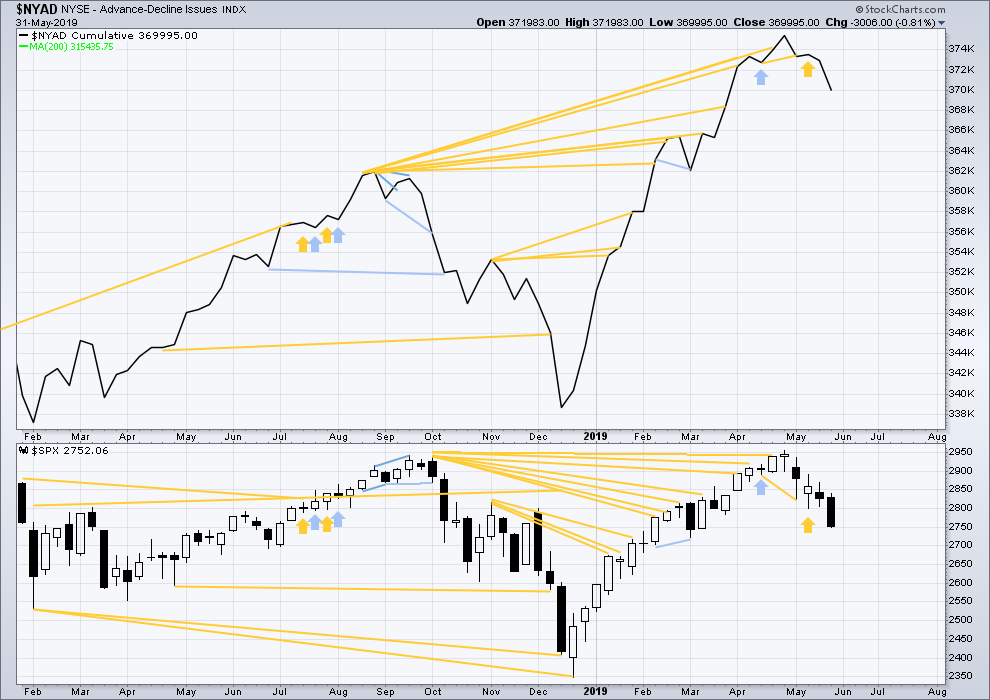
Click chart to enlarge. Chart courtesy of StockCharts.com. So that colour blind members are included, bearish signals
will be noted with blue and bullish signals with yellow.
Bear markets from the Great Depression and onwards have been preceded by an average minimum of 4 months divergence between price and the AD line with only two exceptions in 1946 and 1976. With the AD line making a new all time high on the 3rd of May, the end of this bull market and the start of a new bear market is very likely a minimum of 4 months away, which is the beginning of September 2019.
In all bear markets in the last 90 years there is some positive correlation (0.6022) between the length of bearish divergence and the depth of the following bear market. No to little divergence is correlated with more shallow bear markets. Longer divergence is correlated with deeper bear markets.
If a bear market does develop here, it comes after no bearish divergence. It would therefore more likely be shallow. The alternate Elliott wave count outlines this potential scenario.
Price has moved lower last week. Neither price nor the AD line have made new lows below the prior swing low of the week of the 4th of March. There is no new mid-term divergence.
DAILY CHART
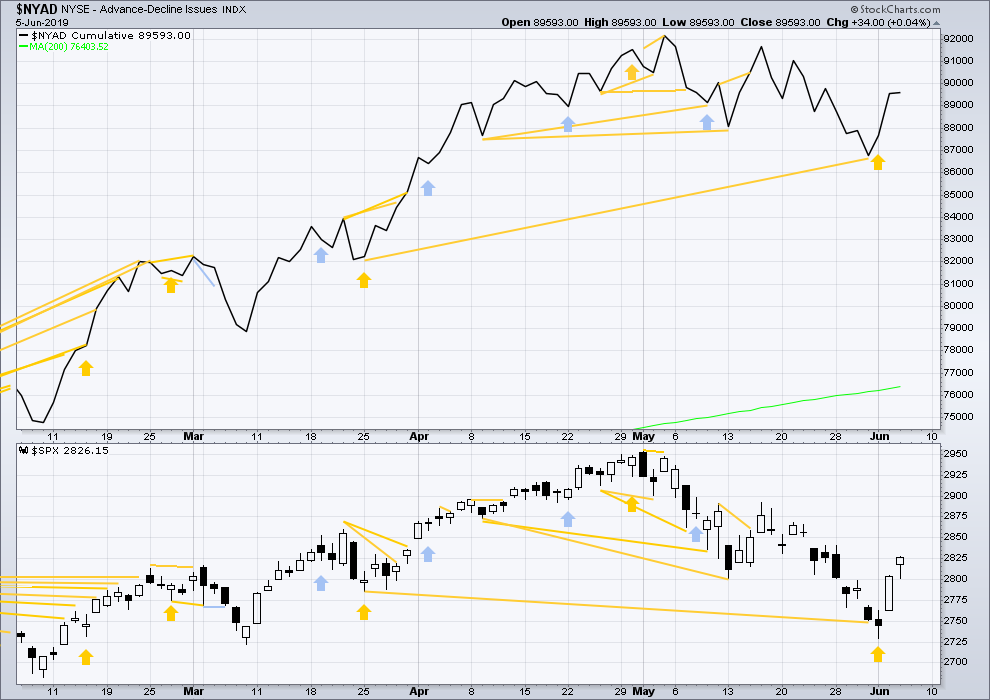
Click chart to enlarge. Chart courtesy of StockCharts.com. So that colour blind members are included, bearish signals
will be noted with blue and bullish signals with yellow.
Breadth should be read as a leading indicator.
Today price has moved higher. The AD line has also moved higher, but only slightly. It is closer to flat. This is not divergence, but it does indicate a very little weakness.
VOLATILITY – INVERTED VIX CHART
WEEKLY CHART
Click chart to enlarge. Chart courtesy of StockCharts.com. So that colour blind members are included, bearish signals
will be noted with blue and bullish signals with yellow.
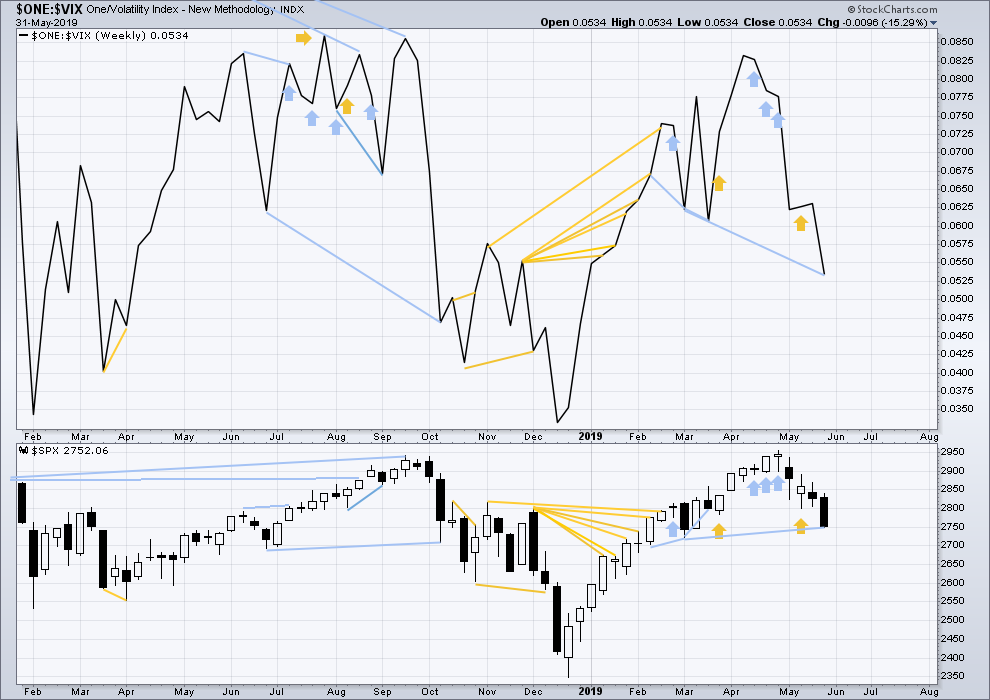
Inverted VIX has made a new low below the low of the 4th of March, but price has not. Downwards movement comes with a strong increase in VIX, which is increasing faster than price. This divergence is bearish, but will not be given much weight in this analysis at this time.
If bearish divergence develops further, then it may be given some weight.
DAILY CHART
Click chart to enlarge. Chart courtesy of StockCharts.com. So that colour blind members are included, bearish signals
will be noted with blue and bullish signals with yellow.
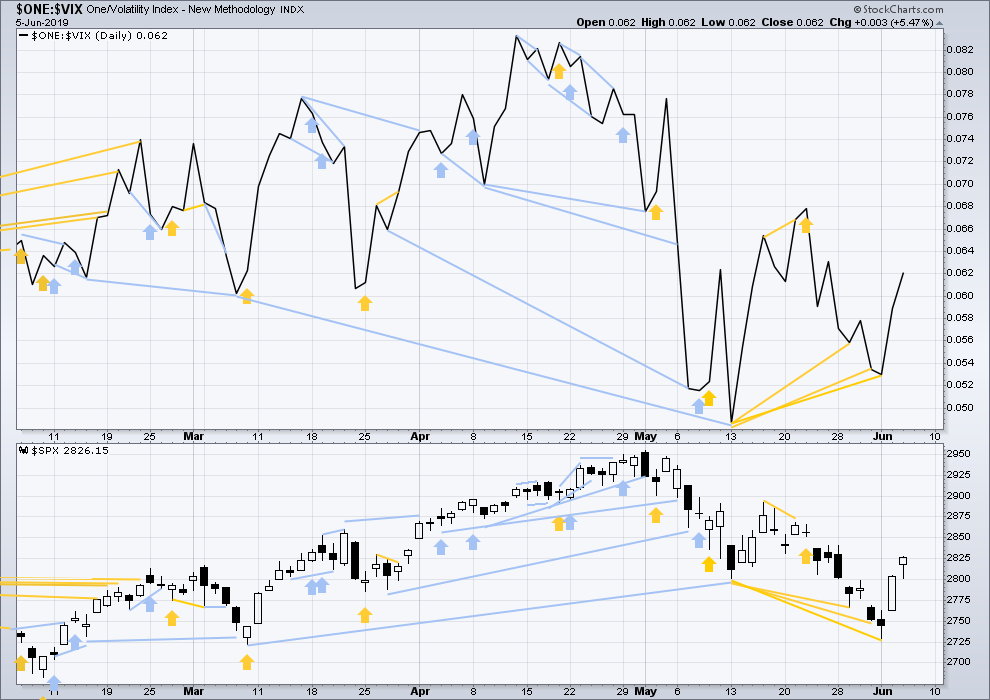
Both price and inverted VIX have moved higher today. There is no new divergence.
DOW THEORY
Dow Theory confirmed a bear market in December 2018. This does not necessarily mean a bear market at Grand Super Cycle degree though; Dow Theory makes no comment on Elliott wave counts. On the 25th of August 2015 Dow Theory also confirmed a bear market. The Elliott wave count sees that as part of cycle wave II. After Dow Theory confirmation of a bear market in August 2015, price went on to make new all time highs and the bull market continued.
DJIA: 23,344.52 – a close on the 19th of December at 23,284.97 confirms a bear market.
DJT: 9,806.79 – price has closed below this point on the 13th of December.
S&P500: 2,532.69 – a close on the 19th of December at 2,506.96 provides support to a bear market conclusion.
Nasdaq: 6,630.67 – a close on the 19th of December at 6,618.86 provides support to a bear market conclusion.
With all the indices having moved higher following a Dow Theory bear market confirmation, Dow Theory would confirm a bull market if the following highs are made:
DJIA: 26,951.81
DJT: 11,623.58
S&P500: 2,940.91 – a new all time high has been made on the 29th of April 2019.
Nasdaq: 8,133.30 – a new high has been made on 24th of April 2019.
Published @ 07:00 p.m. EST.
—
Careful risk management protects your trading account(s).
Follow my two Golden Rules:
1. Always trade with stops.
2. Risk only 1-5% of equity on any one trade.
—
New updates to this analysis are in bold.

RUT hourly trend now up, and price is up and through the 21 ema. Big up bar action, which in general I find is strongly bullish for the next several hours to days in RUT. I’m wondering if we don’t get big 3 of 3 action in multiple markets over night/tomorrow.
Hourly chart updated:
The invalidation point can be moved up. When minor 3 is over, minor 4 may not move into minor 1 price territory.
Okay, now you guys have me questioning my labelling of minor waves 1 and 2 complete.
Maybe I need to move them down one degree. But I’m expecting primary 3 to be shorter than primary 1, and so it all should look condensed in labelling on all time frames….
I will be questioning the degree of labelling on the hourly chart and also trying to see if there’s another way to label it.
Intermediate (1) either way would be incomplete. Intermediate (2) may be a pullback to last two or so sessions, maybe a week.
Anyone trading bitcoin/$GBTC? Thoughts here as it grinds along the trend line?
looks like the correction at the daily chart level is very incomplete, maybe it’s in the last stages of an A down? Probably will be a corrective mess here for a few weeks, my best guess.
SPX question for the seasoned veterans out there:
I don’t see a Minor 2 on the hourly chart. We’re still in Minor 1 struggling up? Really a lazy looking “impulse”. Would that imply a sharp Minor 2 down coming later?
I’ve got it there… I could of course be wrong.
I’m labelling it like that because I’m expecting primary wave 3 to be shorter than primary wave 1. And so I’d expect everything to be condensed within primary wave 3.
Just an FYI observation:
—GLD spending its 5th consecutive day above its BB
—UNG spending its 5th consecutive day below its BB.
I think shorting GLD here is a good risk/reward play. It may surely go higher, but already being above the BB, pretty unlikely.
Lara’s gold analysis has been very useful in navigating this… 🙂
I have it going sideways for a consolidation, before a short sharp upwards thrust.
If that’s right, then a short position may be a little premature here?
Of course, my wave count could be wrong.
I also notice that when Gold has blow off tops, they rarely come right at the high. They’re often followed by a pullback or more likely some consolidation, then the last move up.
Understood. I’m playing the next leg down to complete minor 4, and will short again if/when gold makes a new high above 1346
If Minor 2 was over yesterday, Minor 3 is not starting out with much strength or momentum. This is one piece of evidence I submit that supports the count with Minor 2 still to come over the next 2 or 3 days.
RUT now has an ABC zig-zag corrective ii structure with C = A. And is giving the very early signs of a possible turn back up.
Happy hump day everybody! 🙂
I want to be bullish, but the Russel 2000 (IWM) looks terrible …. I hope I am wrong.
It makes me think of the X wave scenario…… below all the moving averages, maybe I’m just paranoid….. China trade war, Mexico tariffs, Bernie …. and I’m a moderate, should have called myself Purple Pete
Cab sav is purple…. can’t be that bad. Made my way up today to Santa Cruz, Napa tomorrow!
Enjoy Santa Cruz! I was a ucsc slug. Lara would be jealous you’re in the surfing capital of northern California-cant miss lighthouse point/steamers lane surf spot. Enjoy a walk along the west cliff promenade starting at the light house! be sure to stay on the hwy 1 headed north- checkout Sam’s chowder house just off hwy1 in halfmoon bay
I don’t think (could be wrong) that the market is discounting the 2020 election yet. Too far out and too uncertain. My understanding is market discounting tends to be centered around roughly 9 months out.
Look at the bright side…lots of “bad news” recently, so it’s time to go the other way!
thanks for ragging on RUT Peter…helped me see my best play was to get out with a bit of a loss and reenter “some where below”. Very happy with that decision only 20 minutes later!
Ari, I’d say you guys are making me look bad. But then someone might get the wrong idea. Yesterday I said that after two people posted before me, one of whom was profitable on some long positions. Kevin got the wrong idea and thought I was speaking about looking bad as a trader.
However, in ‘looking bad’ I was only referring to the fact that I was not the first to post! He was assuming I was lamenting my 1/3 long position instead of having gone 100% long. That was not even on my mind. Quite the contrary. I was very pleased with the progress and profit of my long position. However, Kevin wrote a multi-paragraph piece of good advice in not comparing oneself to other traders. It was quite long and quite good. Even Lara noted it was good advice.
I thought the whole thing was hysterical. I got a very good laugh once I figured out what was happening. But, hey, thanks for all the advice Kevin.
So, I am not going to say you are making me look bad ever again!
Sorry for mis-interpreting you Rodney.
It just brought up lots of my own personal struggles in this craft, I guess!! I’m hyper-competitive myself, and you have to set that aside in trading, is all.
Absolutely no need to be sorry, Kevin. But I do think it was funny. You meant to help and encourage. I appreciate that and like you said, perhaps others would benefit by your comments. You did not offend me in any way. You are one of my favorite guys!
BTW, I still remain in the dilemna of when to purchase the remainder of my long position. I am still waiting for a Minor 2 to materialize. I think the odds favor a larger pull back than what we have seen. But nothing is for certain.