Yesterday’s Elliott wave and technical analysis expected the pullback may have ended and a third wave up may have begun. A strong upwards day exactly fits this expectation. The target for a third wave remains the same.
Summary: The low of December 2018 is expected to most likely remain intact.
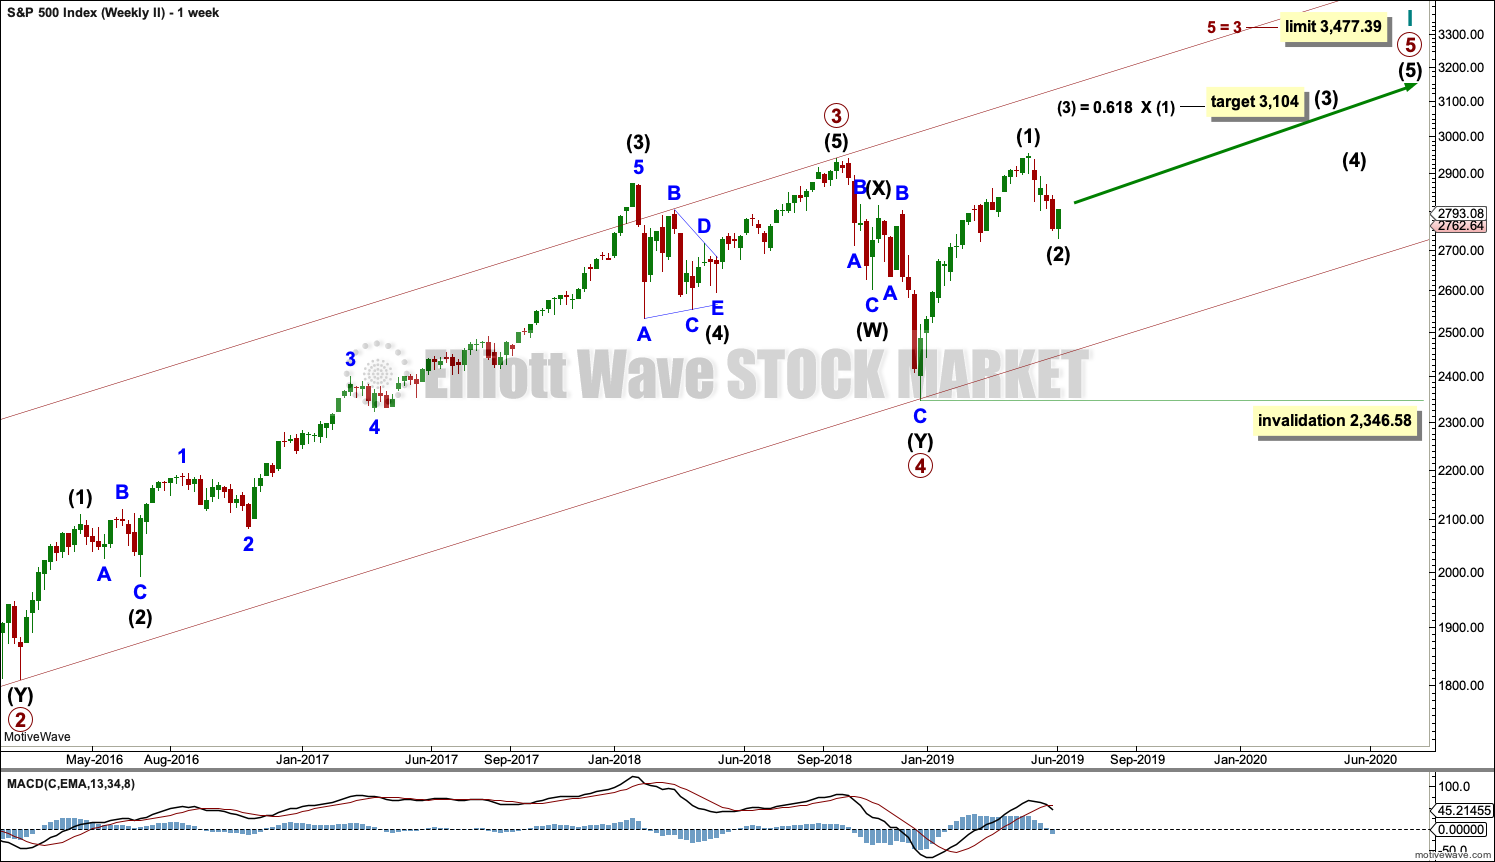
The pullback may have ended. A new target for a third wave up is at 3,104.
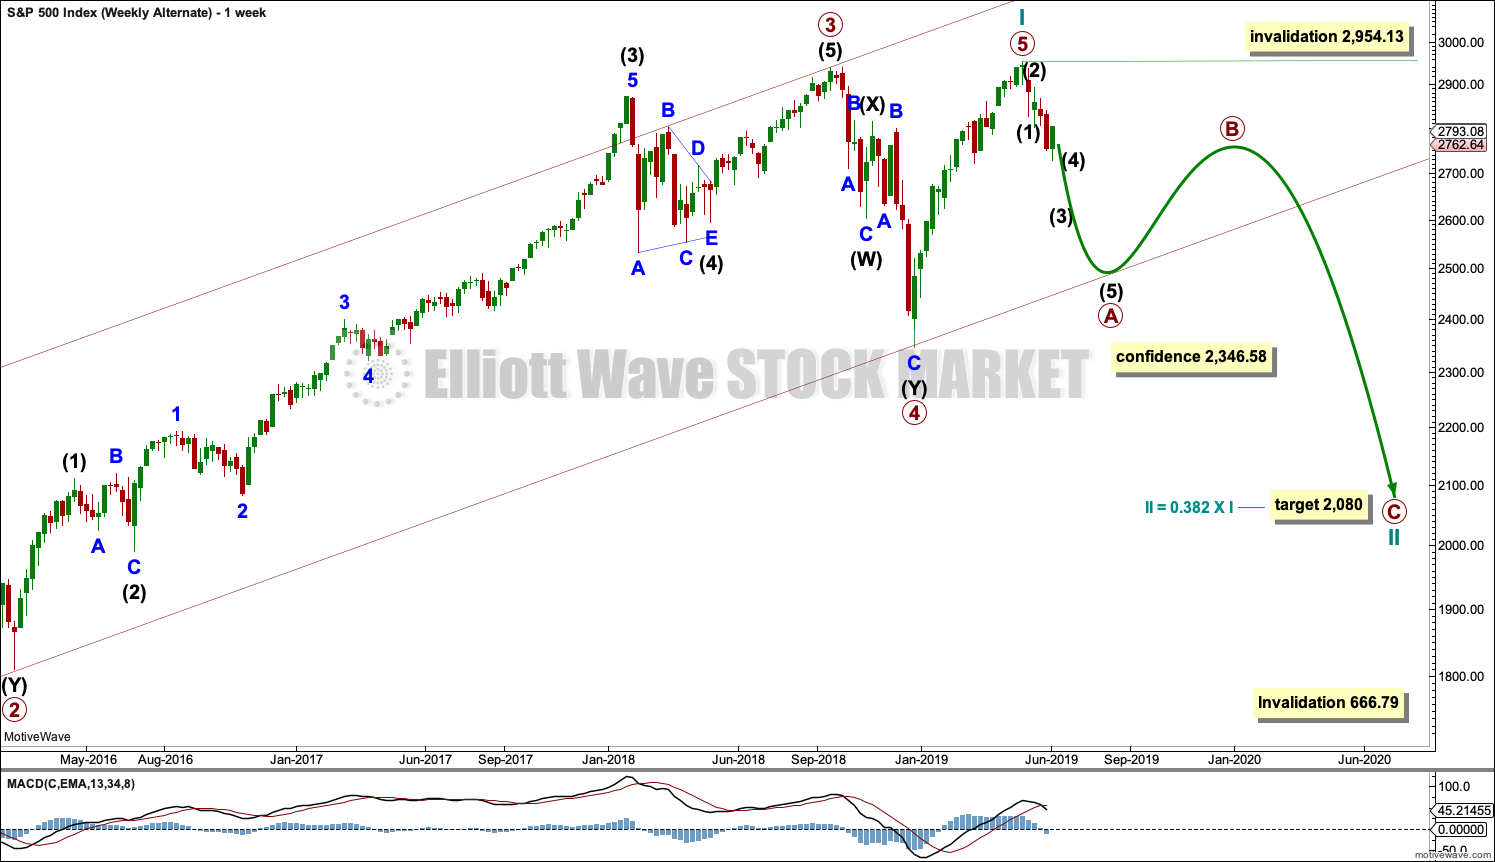
The alternate wave count considers the possibility that a relatively short lived bear market may have begun. The target is at 2,080. This wave count has a fairly low probability, but it is a possibility that must be acknowledged. This possibility may now be discarded with a new high above 2,892.15.
The biggest picture, Grand Super Cycle analysis, is here.
Monthly charts were last published here, with video here. There are two further alternate monthly charts here, with video here.
ELLIOTT WAVE COUNTS
The first two Elliott wave counts below will be labelled First and Second. They may be about of even probability. When the fifth wave currently unfolding on weekly charts may be complete, then these two wave counts will diverge on the severity of the expected following bear market. To see an illustration of this future divergence monthly charts should be viewed.
The alternate Elliott wave count has a very low probability.
FIRST WAVE COUNT
WEEKLY CHART
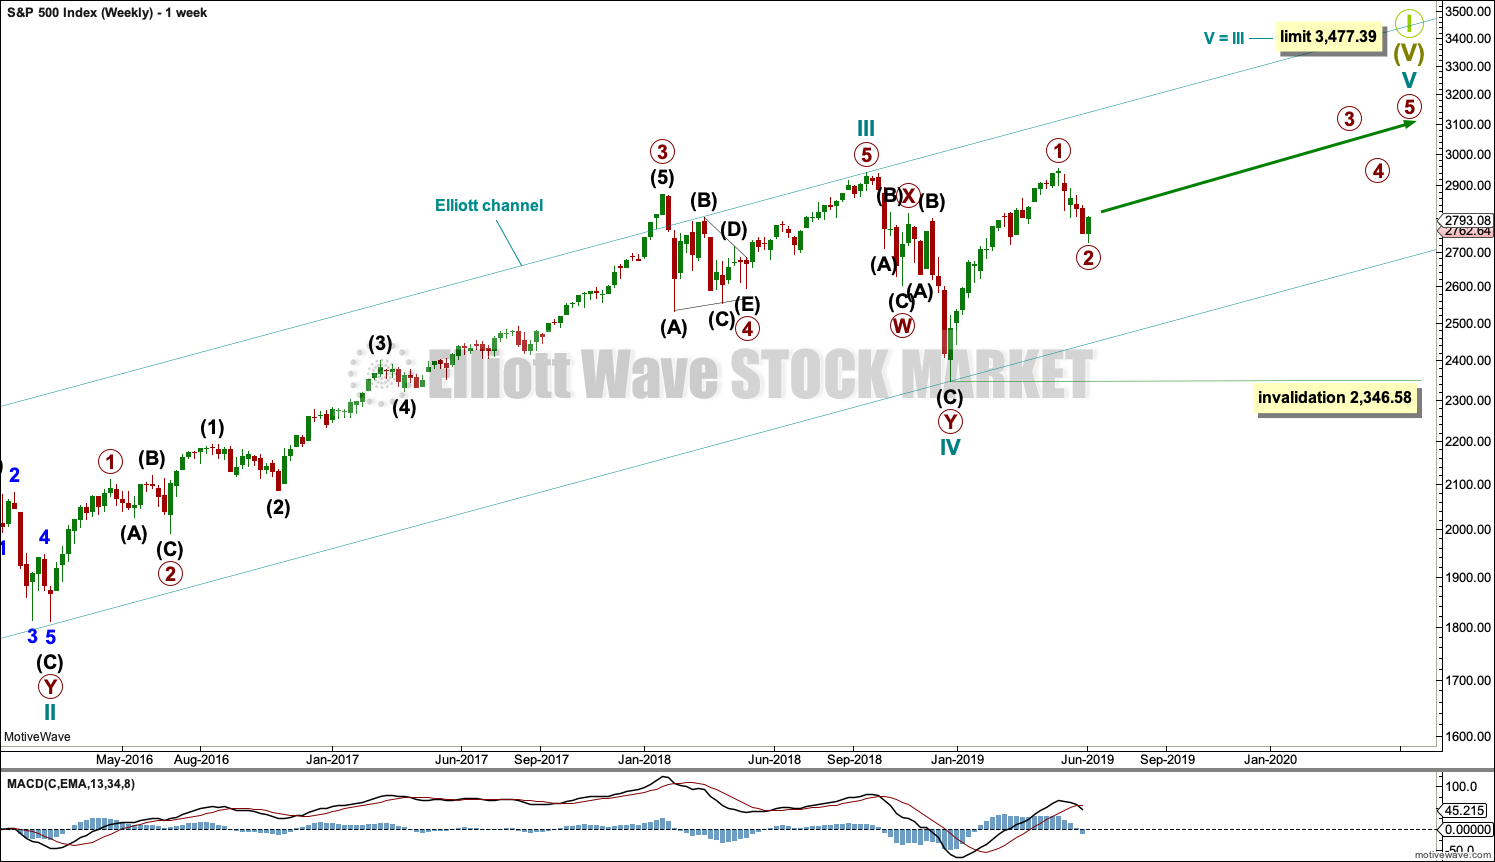
The basic Elliott wave structure consists of a five wave structure up followed by a three wave structure down (for a bull market). This wave count sees the bull market beginning in March 2009 as an incomplete five wave impulse and now within the last fifth wave, which is labelled cycle wave V. This impulse is best viewed on monthly charts. The weekly chart focusses on the end of it.
Elliott wave is fractal. This fifth wave labelled cycle wave V may end a larger fifth wave labelled Super Cycle wave (V), which may end a larger first wave labelled Grand Super Cycle wave I.
The teal Elliott channel is drawn using Elliott’s first technique about the impulse of Super Cycle wave (V). Draw the first trend line from the end of cycle wave I (off to the left of the chart, the weekly candlestick beginning 30th November 2014) to the end of cycle wave III, then place a parallel copy on the end of cycle wave II. This channel perfectly shows where cycle wave IV ended at support. The strongest portion of cycle wave III, the end of primary wave 3, overshoots the upper edge of the channel. This is a typical look for a third wave and suggests the channel is drawn correctly and the way the impulse is counted is correct.
Within Super Cycle wave (V), cycle wave III is shorter than cycle wave I. A core Elliott wave rule states that a third wave may never be the shortest. For this rule to be met in this instance, cycle wave V may not be longer in length than cycle wave III. This limit is at 3,477.39.
The structure of cycle wave V is focussed on at the daily chart level below.
Within cycle wave V, primary wave 2 may not move beyond the start of primary wave 1 below 2,346.58.
In historic analysis, two further monthly charts have been published that do not have a limit to upwards movement and are more bullish than this wave count. Members are encouraged to consider those possibilities (links below summary) alongside the wave counts presented on a daily and weekly basis.
DAILY CHART
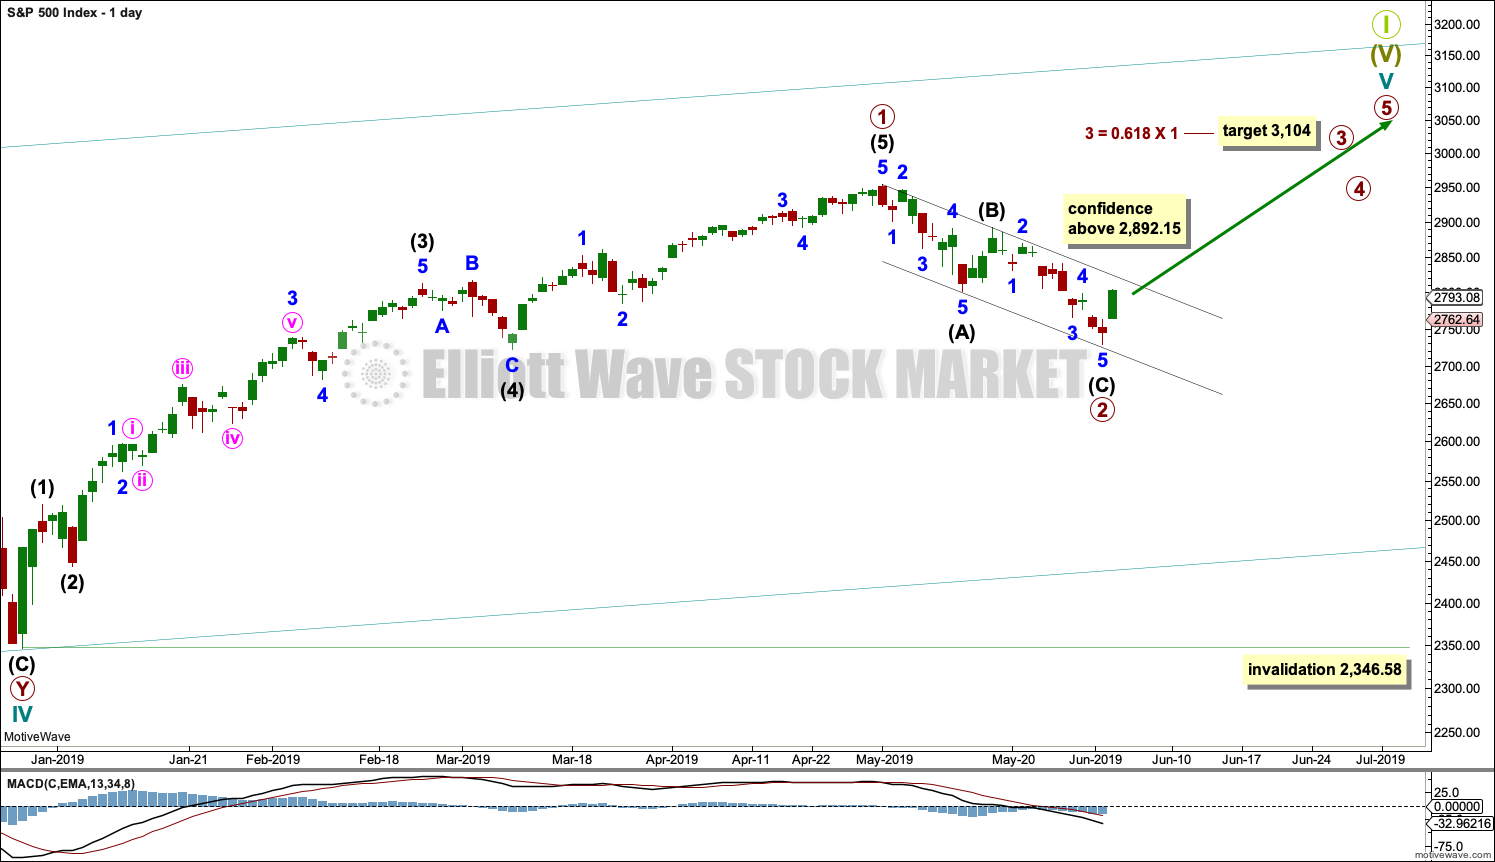
Cycle wave V must subdivide as a five wave motive structure. Within that five wave structure, primary wave 1 may be complete. Primary wave 2 may now be complete.
Primary wave 3 must move above the end of primary wave 1.
When primary wave 3 is over, then primary wave 4 may be a shallow sideways consolidation that may not move into primary wave 1 price territory below 2,954.13.
Thereafter, primary wave 5 should move above the end of primary wave 3 to avoid a truncation.
If it continues further, then primary wave 2 may not move beyond the start of primary wave 1 below 2,346.58.
Draw a channel about primary wave 2 using Elliott’s technique. Draw the first trend line from the start of intermediate wave (A) to the end of intermediate wave (B), then place a parallel copy on the end of intermediate wave (A). Intermediate wave (C) may have ended today almost perfectly at support at the lower edge of this channel.
When the channel is breached by upwards movement, it shall be used to provide confidence that the pullback for primary wave 2 is over and primary wave 3 would then be expected to be underway. Along the way up, it is possible that the upper edge of the channel may provide some resistance and initiate a small pullback or consolidation.
At this stage, a new high above 2,892.15 would invalidate the alternate wave count below and offer some confidence to this wave count.
HOURLY CHART
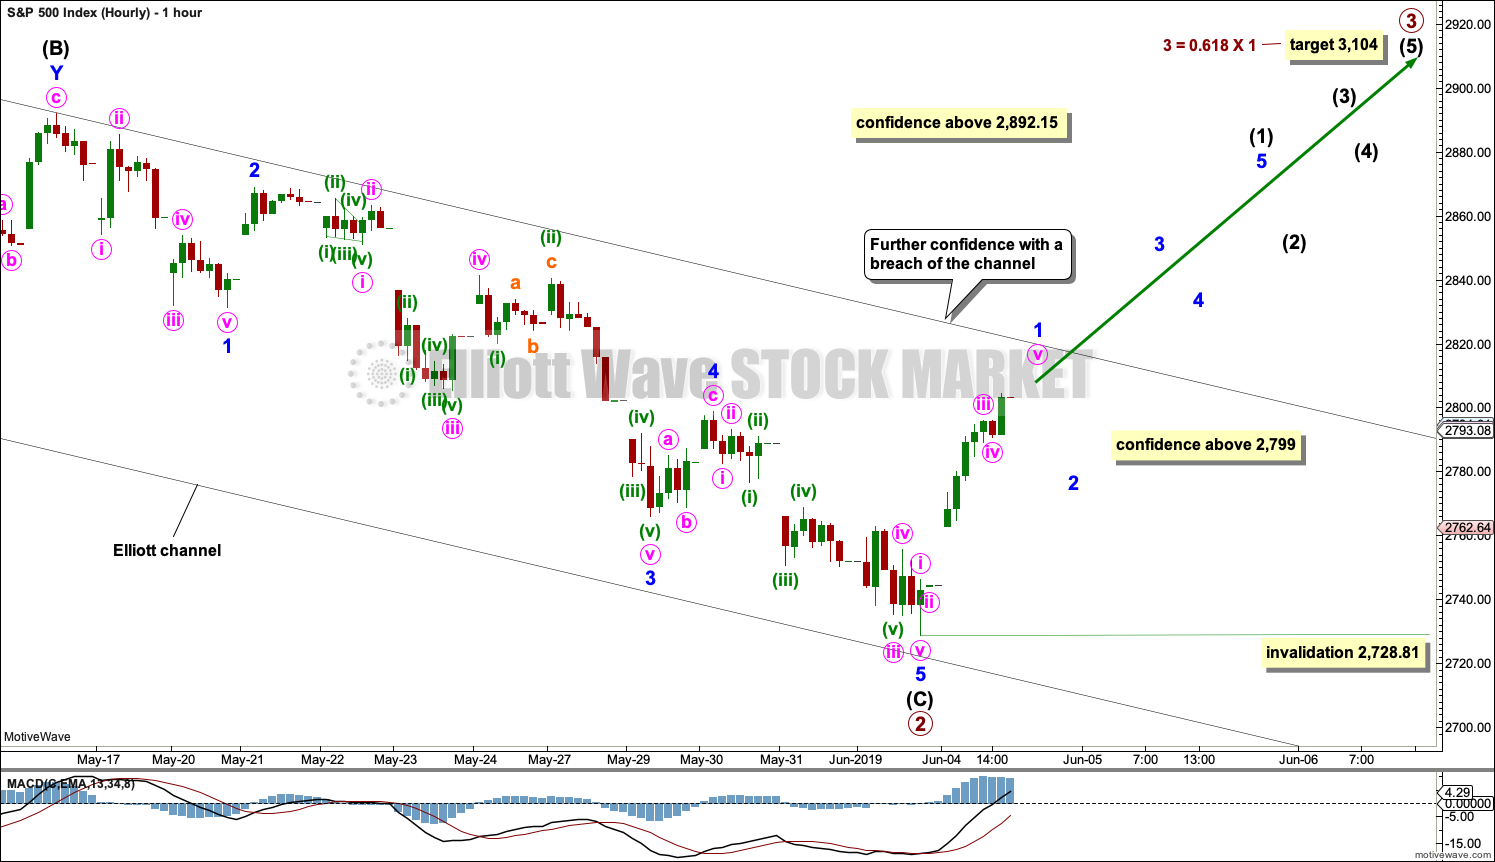
Primary wave 2 may be a complete zigzag.
Intermediate wave (C) may have ended very slightly short of the lower edge of the black Elliott channel.
The first confidence at 2,799 was today passed.
Next confidence in this wave count would come if price breaks above the upper edge of the black Elliott channel.
Further confidence would come with a new high above 2,892.15 and invalidation of the bearish alternate below.
SECOND WAVE COUNT
WEEKLY CHART
This weekly chart is almost identical to the first weekly chart, with the sole exception being the degree of labelling.
This weekly chart moves the degree of labelling for the impulse beginning in March 2009 all down one degree. This difference is best viewed on monthly charts.
The impulse is still viewed as nearing an end; a fifth wave is still seen as needing to complete higher. This wave count labels it primary wave 5.
ALTERNATE WAVE COUNT
WEEKLY CHART
It is possible that for the second wave count cycle wave I could be complete. Primary wave 5 may be seen as a complete five wave impulse on the daily chart.
If cycle wave I is complete, then cycle wave II may meet the definition of a bear market with a 20% drop in price at its end.
Within cycle wave I, primary wave 1 was a very long extension and primary wave 3 was shorter than primary wave 1 and primary wave 5 was shorter than primary wave 3. Because primary wave 1 was a long extension cycle wave II may end within the price range of primary wave 2, which was from 2,132 to 1,810. The 0.382 retracement of cycle wave I is within this range.
Cycle wave II may not move beyond the start of cycle wave I below 666.79.
This wave count does not have support at this time from classic technical analysis.
DAILY CHART
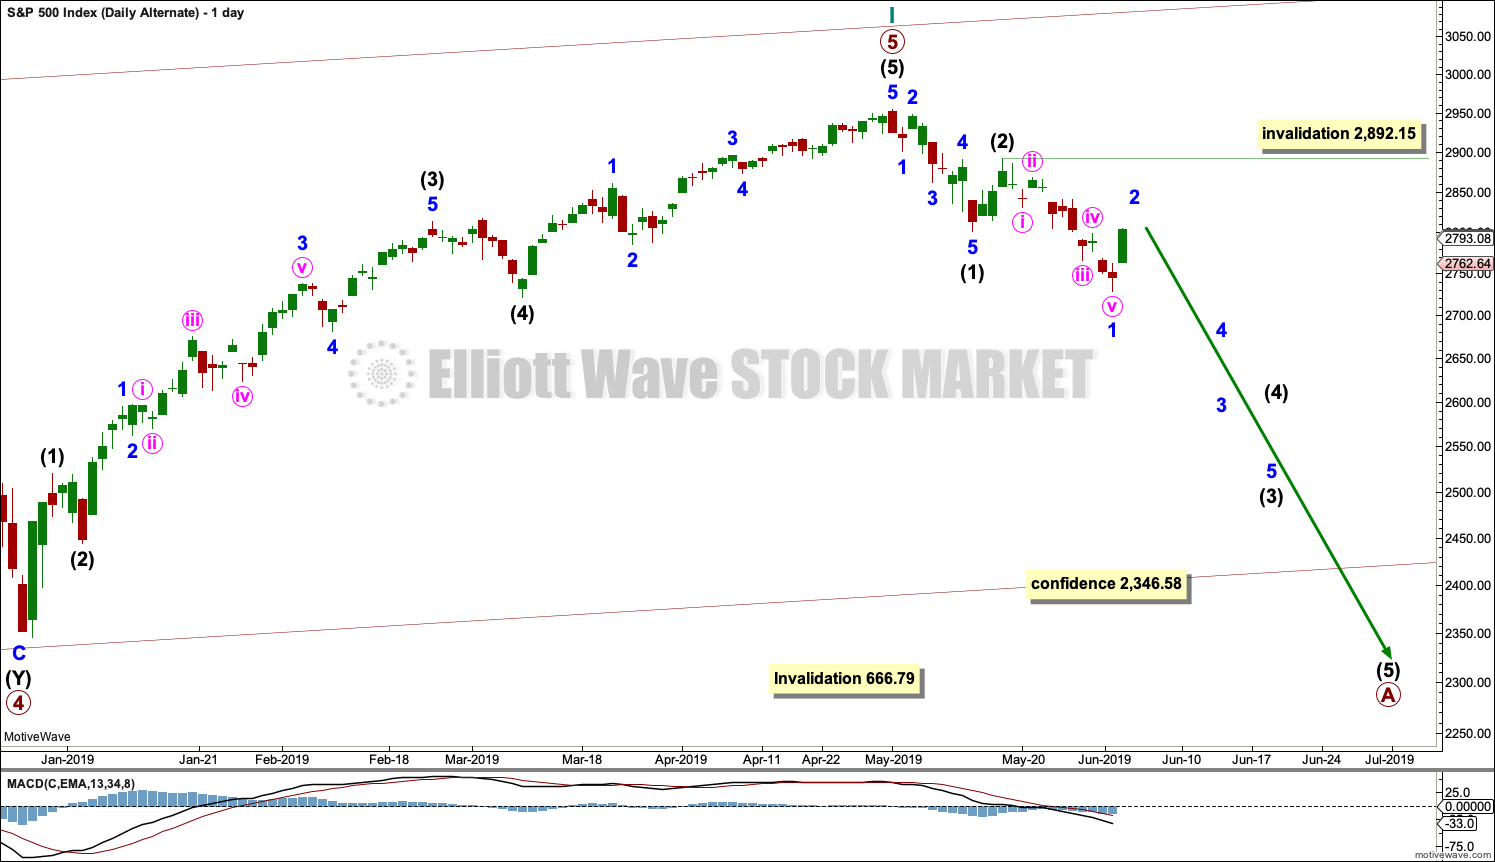
The most likely structure for cycle wave II would be a zigzag. Within a zigzag, primary wave A would subdivide as a five wave structure, most likely an impulse. Within the impulse of primary wave A, so far intermediate waves (1) and (2) may be complete and intermediate wave (3) has moved below the end of intermediate wave (1) and may be incomplete.
Intermediate wave (3) would reach 1.618 the length of intermediate wave (1) at 2,645.
Intermediate wave (3) may only subdivide as an impulse. Within the impulse, minor wave 1 may be complete. Minor wave 2 may not move beyond the start of minor wave 1 above 2,892.15. At this stage, a new high above this point would see this alternate wave count discarded.
Within the zigzag, primary wave B may not move beyond the start of primary wave A.
TECHNICAL ANALYSIS
WEEKLY CHART
Click chart to enlarge. Chart courtesy of et=”_blank”>StockCharts.com.
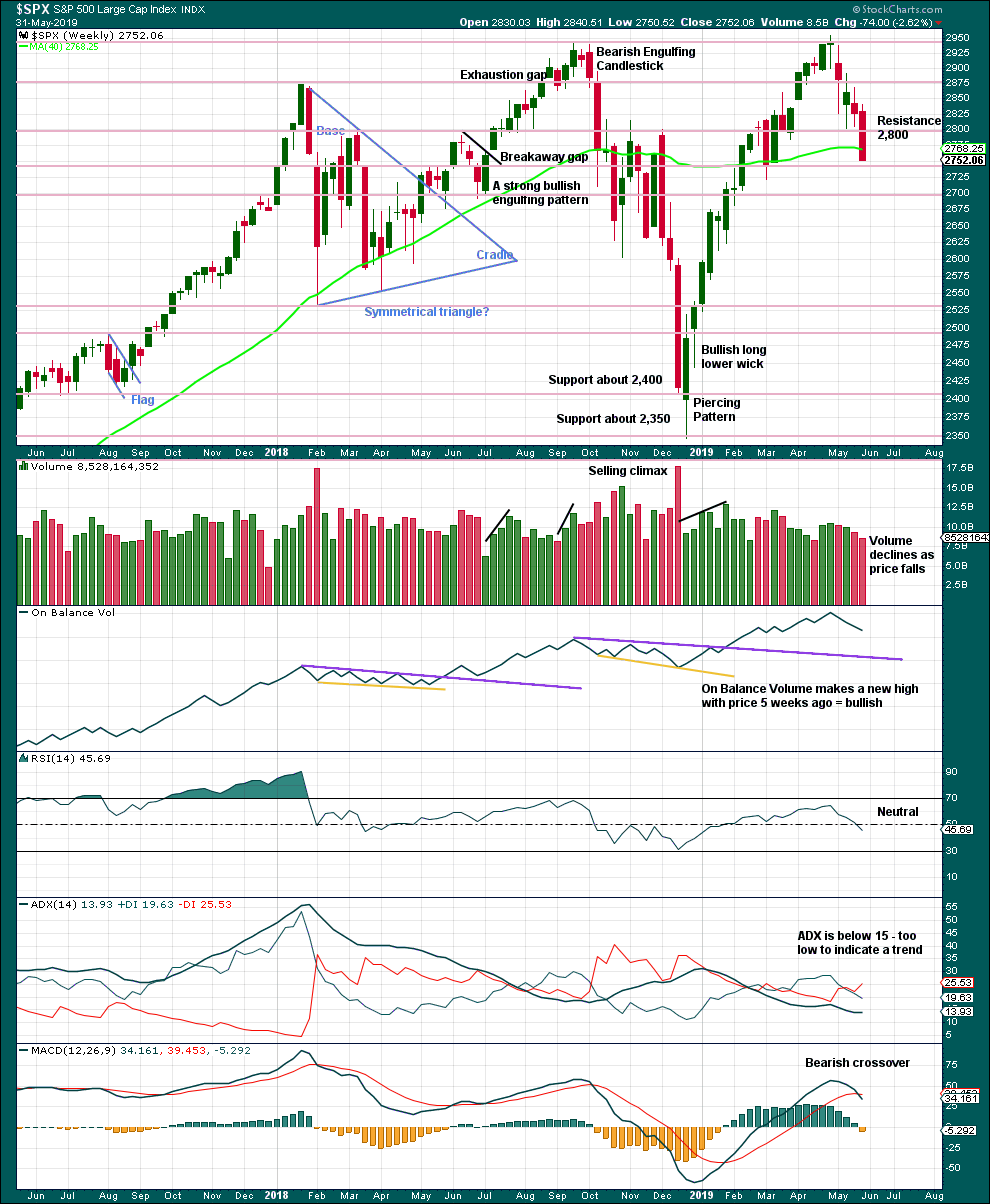
There is an upwards trend from the low in December 2018, a series of higher highs and higher lows with a new all time high on the 30th of April 2019. The last swing low at 2,785.02 on the 25th of March has now been breached, so a trend change is now possible.
Last weekly candlestick closes with strong downwards movement and almost no lower wick. The lack of a lower wick strongly suggests more downwards movement this week. It is possible that downwards movement to begin the week for Monday has fulfilled this expectation, but it is also possible that it may continue.
DAILY CHART
Click chart to enlarge. Chart courtesy of StockCharts.com.
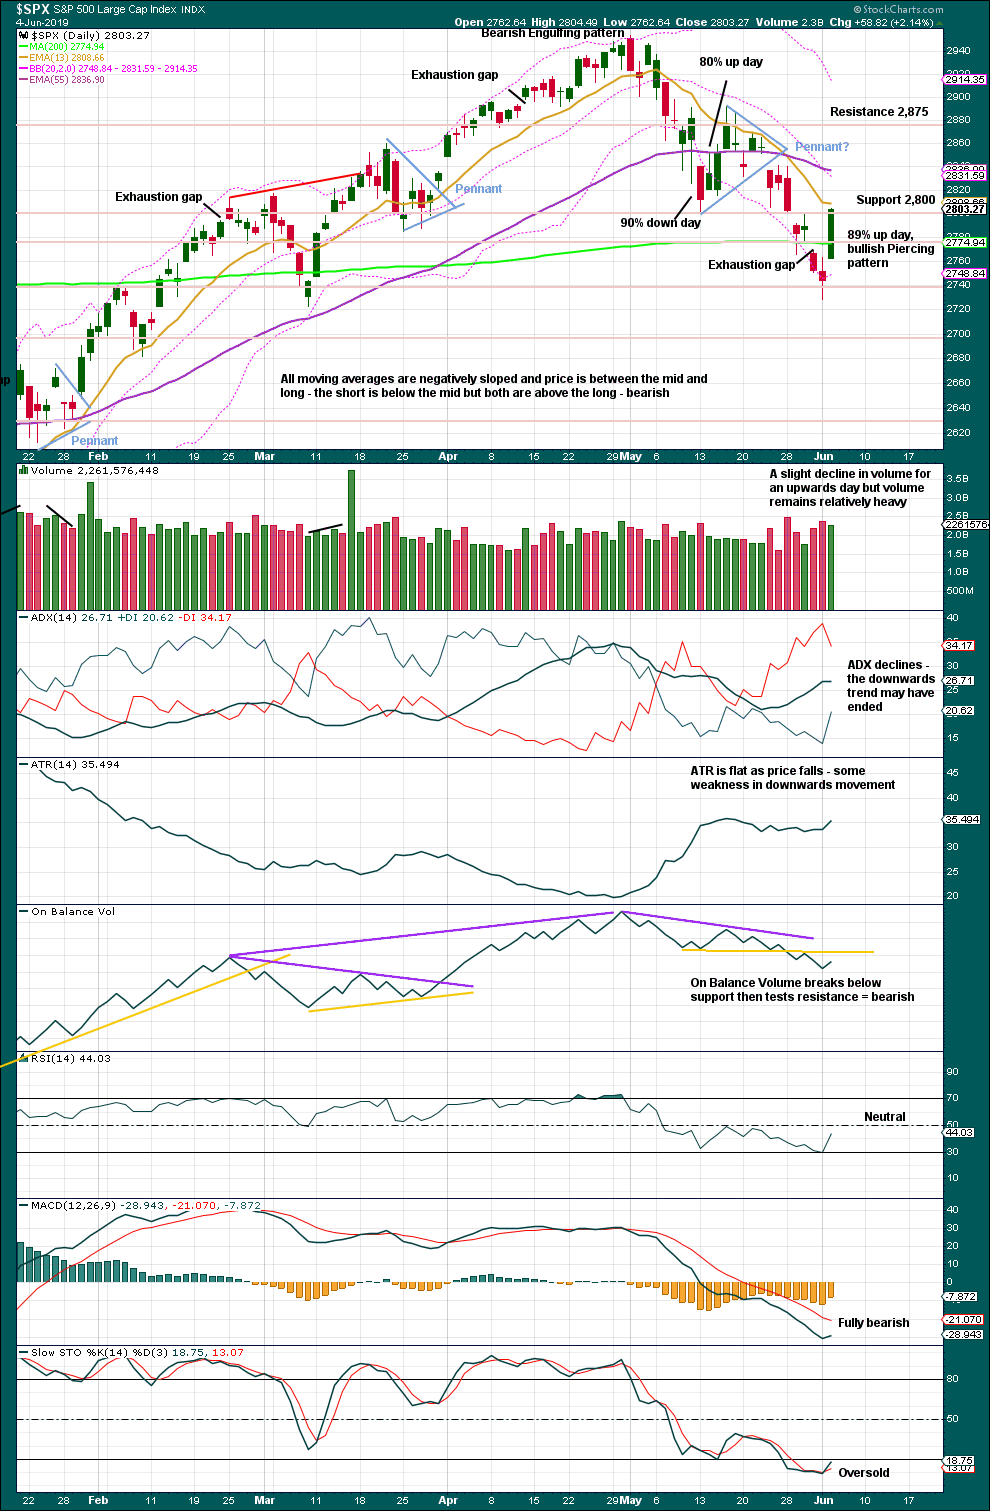
Today completes a bullish reversal pattern in a Piercing pattern with a shaven head. The shaven head strongly suggests more upwards movement tomorrow.
A small pennant pattern may be complete and followed by a downwards breakout, which has support from volume. The target is about 2,690.
However, the last gap is today closed, so it is renamed an exhaustion gap. This is an indication that the pullback may be over, and it supports the main Elliott wave count.
Declining to flat ATR as price falls supports the first two Elliott wave counts and indicates the alternate looks less likely.
Lowry’s data today indicates Buying Power has crossed back above Selling Pressure. This supports the main Elliott wave count.
BREADTH – AD LINE
WEEKLY CHART
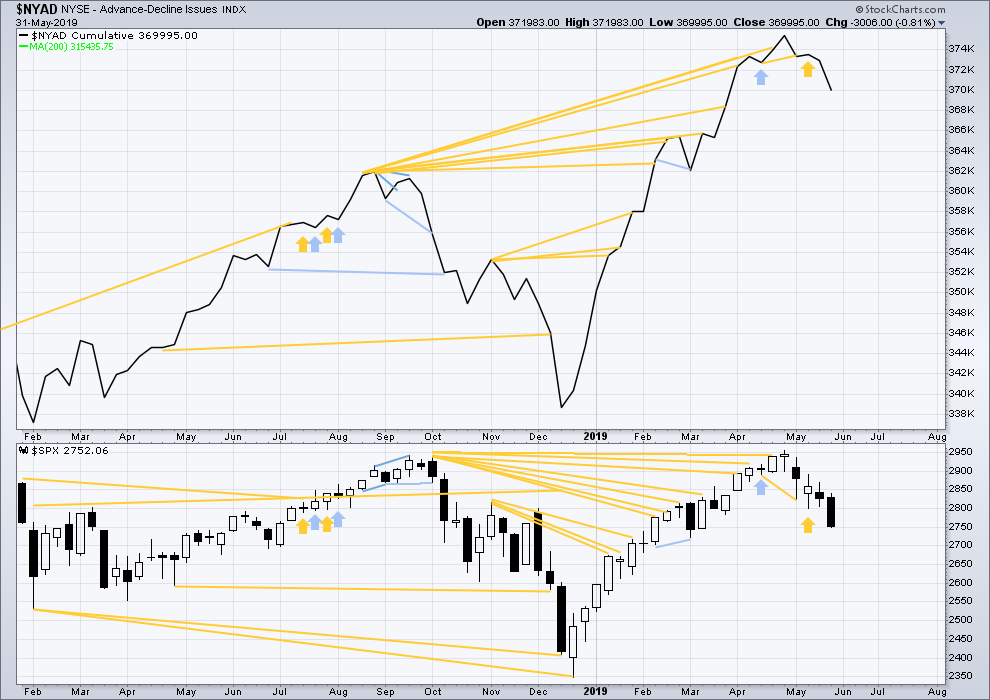
Click chart to enlarge. Chart courtesy of StockCharts.com. So that colour blind members are included, bearish signals
will be noted with blue and bullish signals with yellow.
Bear markets from the Great Depression and onwards have been preceded by an average minimum of 4 months divergence between price and the AD line with only two exceptions in 1946 and 1976. With the AD line making a new all time high on the 3rd of May, the end of this bull market and the start of a new bear market is very likely a minimum of 4 months away, which is the beginning of September 2019.
In all bear markets in the last 90 years there is some positive correlation (0.6022) between the length of bearish divergence and the depth of the following bear market. No to little divergence is correlated with more shallow bear markets. Longer divergence is correlated with deeper bear markets.
If a bear market does develop here, it comes after no bearish divergence. It would therefore more likely be shallow. The alternate Elliott wave count outlines this potential scenario.
Price has moved lower last week. Neither price nor the AD line have made new lows below the prior swing low of the week of the 4th of March. There is no new mid-term divergence.
DAILY CHART
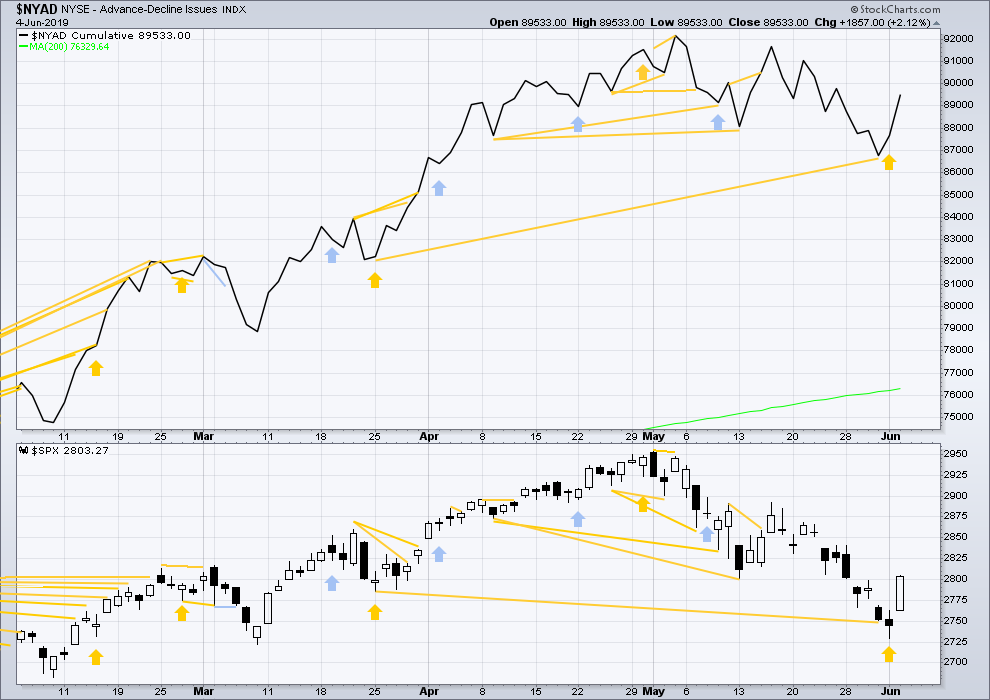
Click chart to enlarge. Chart courtesy of StockCharts.com. So that colour blind members are included, bearish signals
will be noted with blue and bullish signals with yellow.
Breadth should be read as a leading indicator.
Price has now made a new mid-term low below the prior low of the 25th of March, but the AD line has not. Price is falling faster than market breadth. This divergence is bullish for the mid term and supports the view that this pullback is a counter trend movement within an ongoing bull market and not the start of a fully fledged bear market.
Mid-term bullish divergence is now being followed by upwards movement.
Today there is no new divergence.
VOLATILITY – INVERTED VIX CHART
WEEKLY CHART
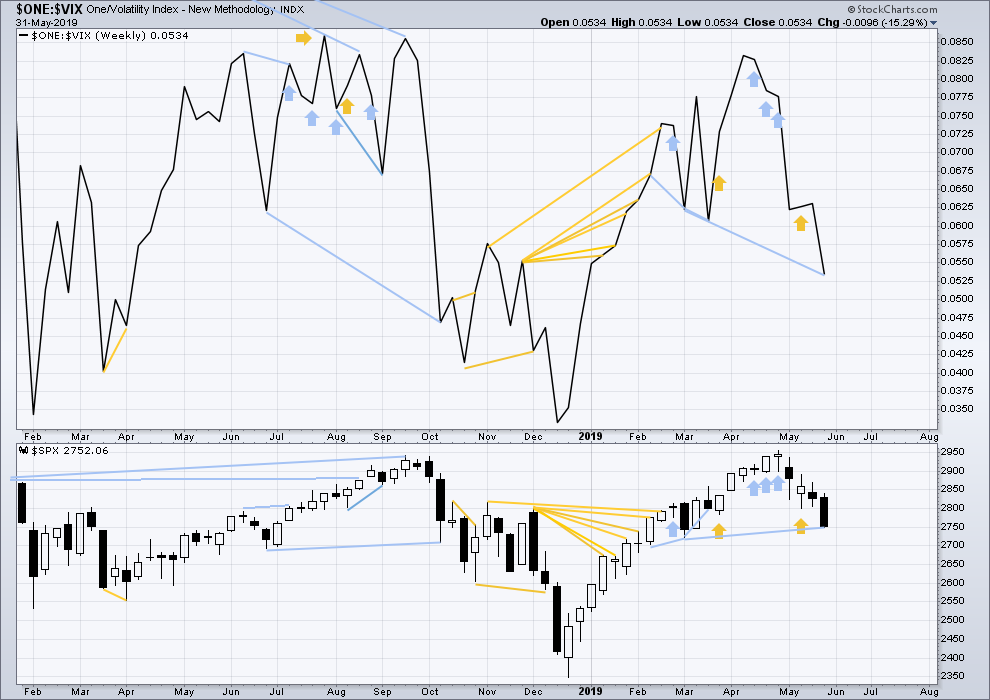
Click chart to enlarge. Chart courtesy of StockCharts.com. So that colour blind members are included, bearish signals
will be noted with blue and bullish signals with yellow.
Inverted VIX has made a new low below the low of the 4th of March, but price has not. Downwards movement comes with a strong increase in VIX, which is increasing faster than price. This divergence is bearish, but will not be given much weight in this analysis at this time.
If bearish divergence develops further, then it may be given some weight.
DAILY CHART

Click chart to enlarge. Chart courtesy of StockCharts.com. So that colour blind members are included, bearish signals
will be noted with blue and bullish signals with yellow.
Mid-term bullish divergence is being followed by upwards movement.
Today there is no new divergence.
DOW THEORY
Dow Theory confirmed a bear market in December 2018. This does not necessarily mean a bear market at Grand Super Cycle degree though; Dow Theory makes no comment on Elliott wave counts. On the 25th of August 2015 Dow Theory also confirmed a bear market. The Elliott wave count sees that as part of cycle wave II. After Dow Theory confirmation of a bear market in August 2015, price went on to make new all time highs and the bull market continued.
DJIA: 23,344.52 – a close on the 19th of December at 23,284.97 confirms a bear market.
DJT: 9,806.79 – price has closed below this point on the 13th of December.
S&P500: 2,532.69 – a close on the 19th of December at 2,506.96 provides support to a bear market conclusion.
Nasdaq: 6,630.67 – a close on the 19th of December at 6,618.86 provides support to a bear market conclusion.
With all the indices having moved higher following a Dow Theory bear market confirmation, Dow Theory would confirm a bull market if the following highs are made:
DJIA: 26,951.81
DJT: 11,623.58
S&P500: 2,940.91 – a new all time high has been made on the 29th of April 2019.
Nasdaq: 8,133.30 – a new high has been made on 24th of April 2019.
Published @ 07:58 p.m. EST.
—
Careful risk management protects your trading account(s).
Follow my two Golden Rules:
1. Always trade with stops.
2. Risk only 1-5% of equity on any one trade.
—
New updates to this analysis are in bold.

Kevin and all interested, you have to look at my post at the bottom of this thread. You might just get a laugh like I did.
Hourly chart updated:
I can now count a five up from the low. Minor 1 could be over here, or it may extend higher.
If it is over here then use Fibonacci Ratios as targets for minor wave 2.
BUT
for any confidence whatsoever that minor 1 is over and minor 2 has begun the following things must be seen:
1. A breach of the narrow best fit channel by downwards or sideways movement.
2. A new low below 2,800.92; this is the start of minute v. A new low below the start of minute v may not be a second wave correction within minute v, so at that stage minute v must be over.
While second waves can be deep, this market will often produce surprisingly shallow second waves. They can also be brief. There is a perfect example on the daily charts; the first pullback from the December 2018 low lasted only 3 days and was only 0.44 of the first wave up.
Now, minor wave 2 does not have to be the same this time. But be warned it is a tendency of this market to surprise us with brief shallow second waves.
As I prepare this chart a couple of concerns are coming to mind. I am drawing a Fibonacci ratio about minor 1, but that does not mean minor 2 has to start here. Minor 1 could extend higher first. The Fibonacci retracement may need to be adjusted. Just because I am labelling minor 1 as complete does not mean I have confidence yet that it is.
The narrow channel is steep which reduces the technical significance of it. A breach would be a signal of a possible interruption, but the signal would not be loud.
I think Minor 1 was not completed at this morning’s gap up open to 2820.42. Rather, that would be the high of Minute iii and we are currently in Minute 5 at 2823 to moving up to complete Minor 1 sometime today.
That call is consistent with price hitting “top of channel” (shown) resistance very soon. And there’s the big fat 61.8% of the entire primary 2 down at 2830 just above that. Very like price area for a pivot turn and start of a real minor 2, which certainly should show up as more than a single hourly down bar.
On the other hand…the white line up and to the right is a projection of the 3/8 to 3/19 up move, off a rather similar correction. That move barely turned down during it’s entire run. This projection (the market does like symmetry, i.e. equal sized moves, often!) points right up to the 78.6%, which of course is about as popular a pivot level at 61.8%.
So don’t be shocked if this market just keeps rocking upward overall for several more days here.
I agree Rodney.
Minute iii looks like it ended at the upper edge of the channel, minute iv reacted down from there, and now minute v has breached the channel… so far. The current hourly candlestick is not closed yet.
“So don’t be shocked if this market just keeps rocking upward overall for several more days here.”
Absolutely. It could just keep on going up. If one is waiting for the perfect entry on a second wave, remember how brief and shallow they were from the low in December 2018. Be warned, that could happen again. This market often does that.
Took a small high leverage short here with SPXU. Stop at SPX back above today’s high. “Trust the wave count Luke”….(and manage risk, always!).
If you look at RUT daily bars in Dec, leading up to and including Dec 27…
then compare that to the last 4 weeks or so up to and including today.
Virtually identical. Very good things for the bulls happened in RUT after Dec 27.
We’ll see!!
SPX is painting the big Fibo cluster at 2811-14: opened over it, now has sold off below it. High right at the down trend lines off the May ATH, “perfect” structure.
“Should be” the minor 2 down in play. Don’t think it’ll go as far as the top of yesterday’s gap though.
I agree. The pullback may, in fact, be relatively small and short which would attest to the strength of this Primary 3 up. Both the 38% and 50% retrace levels are above the top of the gap. We should be able to see the three waves down on the hourly chart just as we can see the five waves up on the hourly.
Fun fact: RUT daily has clearly broken through it’s down trend line. NDX daily has clearly broken through it’s down trend line.
SPX has not yet broken through it’s down trend line.
So a little divergence, probably not really significant.
After Minor 1 completes (most likely today) I will be looking for a test of the open gap from yesterday morning. I suspect we will retrace between 38% and 50% of the move and hold above the top of the gap. If we get there, I will deploy my remaining cash to complete a my long positions. In my long term account I use unleveraged vehicles to reduce risk because of the size of the positions. In my short term trading account I will use 3X leveraged UPRO which has smaller positions by dollar amount.
The short term account recently completed a leveraged short gold position just before the gold blast off. The position paid off handsomely and the timing was right on. If you are not already on Lara’s Weekly seeing SPX along with Gold and Oil, you really ought to check it out.
thanks for letting us into you mind!
Your most welcome. But when you get into my mind, you may not find much!
LOL! You know Rod, some people have to practice a lifetime to benefit a quiet mind! 🙂
Yay! First!
I did very well daytrading SPY calls today, thanks to Lara’s great road map.
Agreed
Ron, you and others are making me look bad. Dag-nabbit!
Dangerous thinking. Kind of like looking over the market (casino) landscape at the end of any day and thinking “look at all the money I COULD HAVE MADE!!!”. Bad robot!!!
Of course you know this Rodney, I’m just sayin’ for other member’s benefit who may not be quite so experienced and disciplined: the market is a giant casino and it’s trivial look at it at day’s
end and say “my gosh I could have made so much money!” Similar to exiting a trade “early” and thinking “I could have made so much more!”. Similar to looking at the guy over there who scored big yesterday (my closest trading colleague scored probably 10x of what I made yesterday) and thinking “why don’t I try to do what he does”?
No, no, no and no. That’s all fantasy and delusion. And following any of those fantasies can quickly lead to seriously effed up trading on whims, on hope, to chasing, instead of TO A DETAILED, WRITTEN, THOUGHTFUL, MEASURED and NON-DISCRETIONARY SYSTEMATIC PLAN.
If it makes anyone feel better it’s always the fact that the person who risks more makes more…and loses more as well, at times. There is a huge “tendency to even out” in this game. And always remember that very few traders who talk up their big days open their mouth on the sour ones. I certainly don’t, which is generally why I try to just not get into “personal results”. They vary!!! Lol!
Plan and trade your plan.
Sound advice Kevin. Thank you.
However, in ‘looking bad’ I was only referring to the fact that I was not the first to post! You are assuming I was speaking of my 1/3 position when that was not even on my mind. Quite the contrary. I was very please with the progress and profit of my long position. Funny! Hey, but thanks for all the advice.