Yesterday’s analysis expected a sideways consolidation to continue for a few sessions. Some upwards movement today changes the short-term view slightly to see a bounce continuing, but the mid-term expectation and target remains the same.
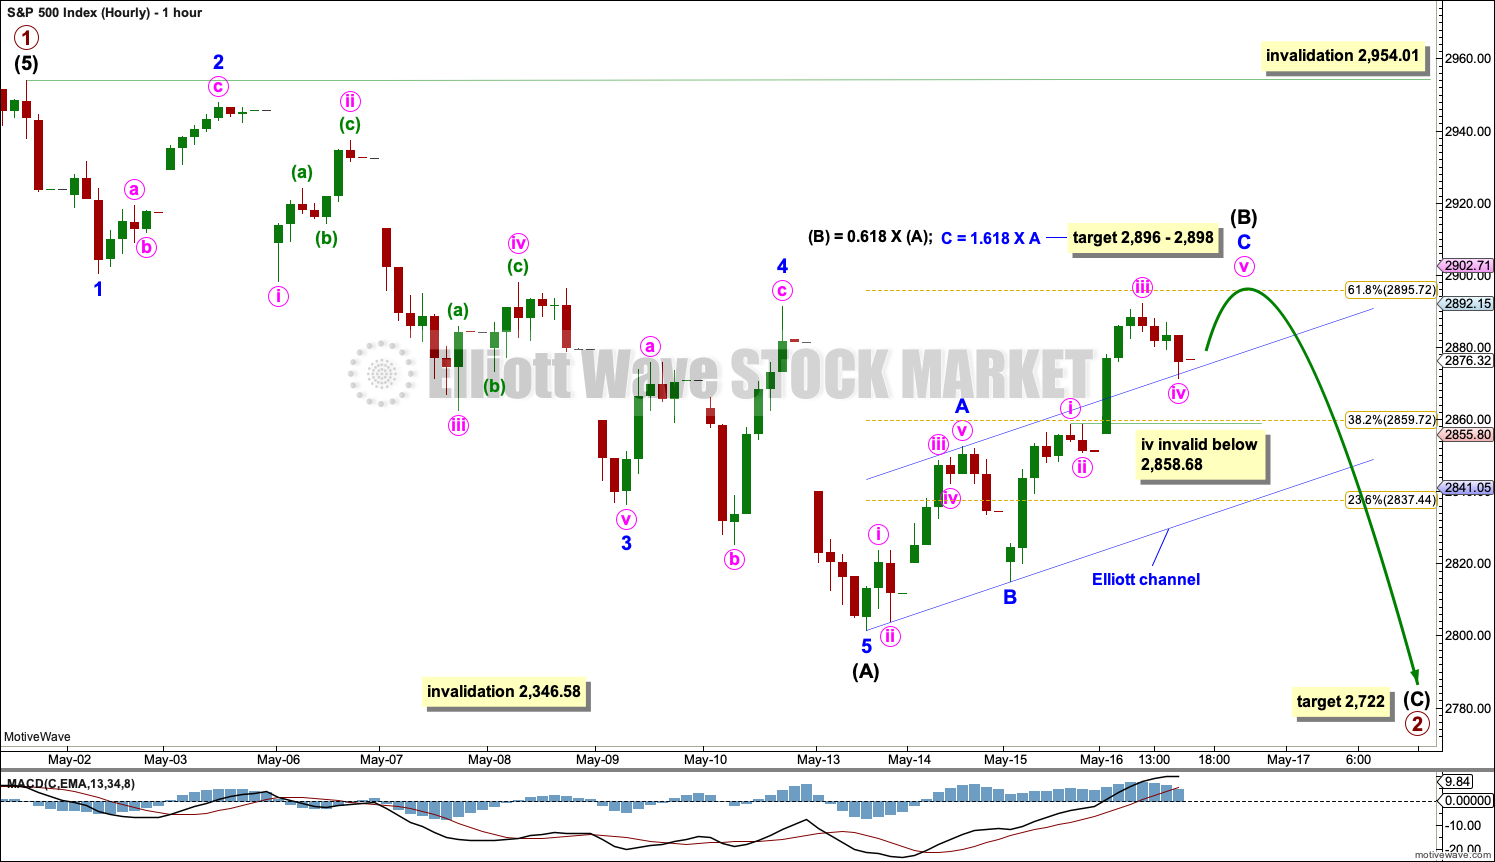
Summary: The target for this bounce to end is now at 2,896 to 2,898.
Thereafter, the pullback is expected to continue lower. It may continue now for another one to two weeks.
The first target is at 2,722 and thereafter at 2,579. The low of December 2018 is expected to remain intact, and this pullback is expected to be followed by a strong third wave up to new all time highs.
The biggest picture, Grand Super Cycle analysis, is here.
Monthly charts were last published here, with video here. There are two further alternate monthly charts here, with video here.
ELLIOTT WAVE COUNTS
The two Elliott wave counts below will be labelled First and Second rather than main and alternate as they may be about of even probability. When the fifth wave currently unfolding on weekly charts may be complete, then these two wave counts will diverge on the severity of the expected following bear market. To see an illustration of this future divergence monthly charts should be viewed.
FIRST WAVE COUNT
WEEKLY CHART
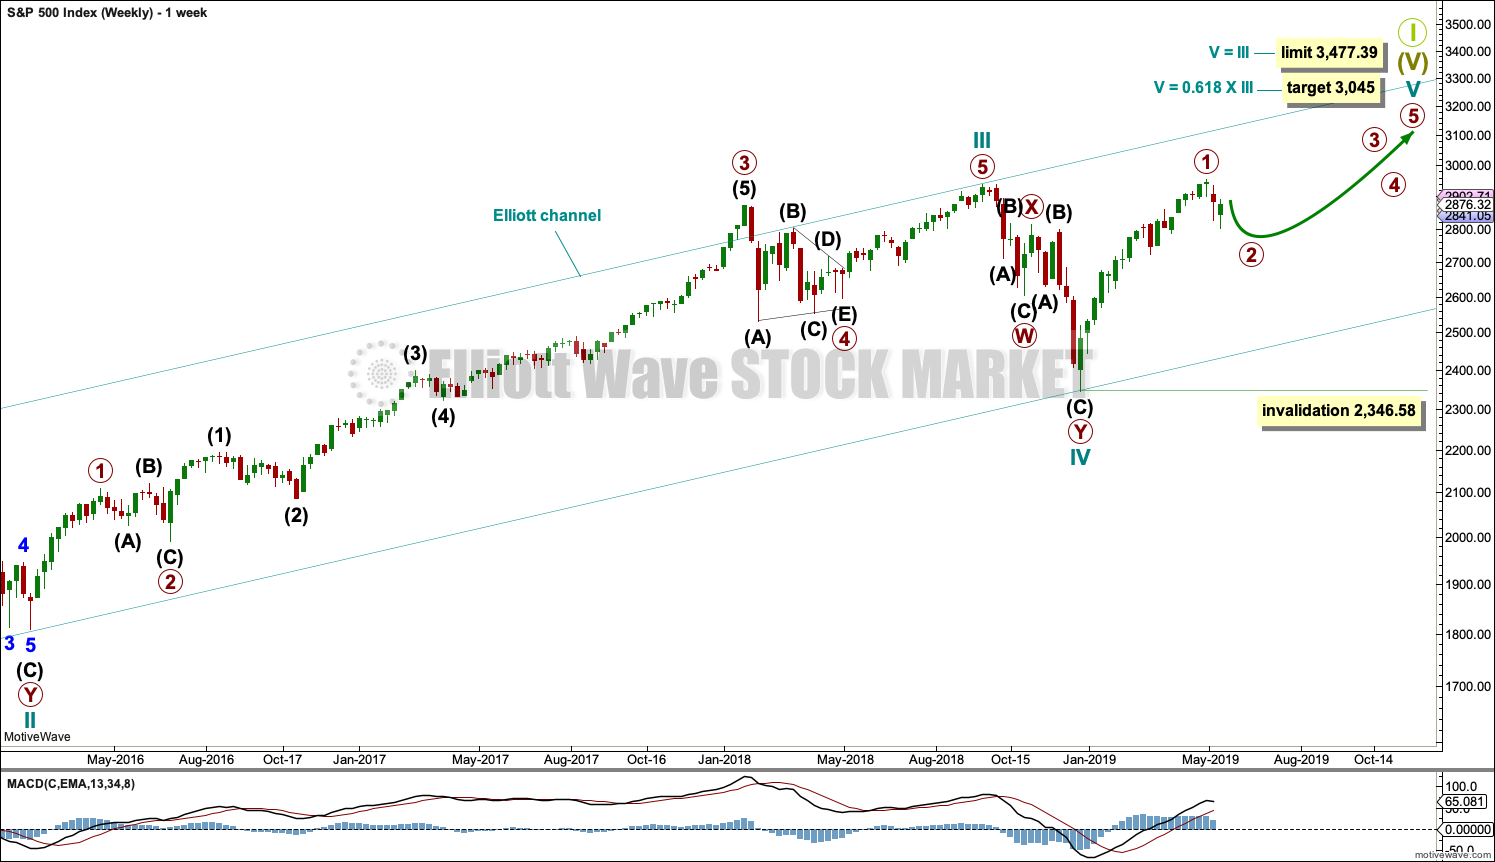
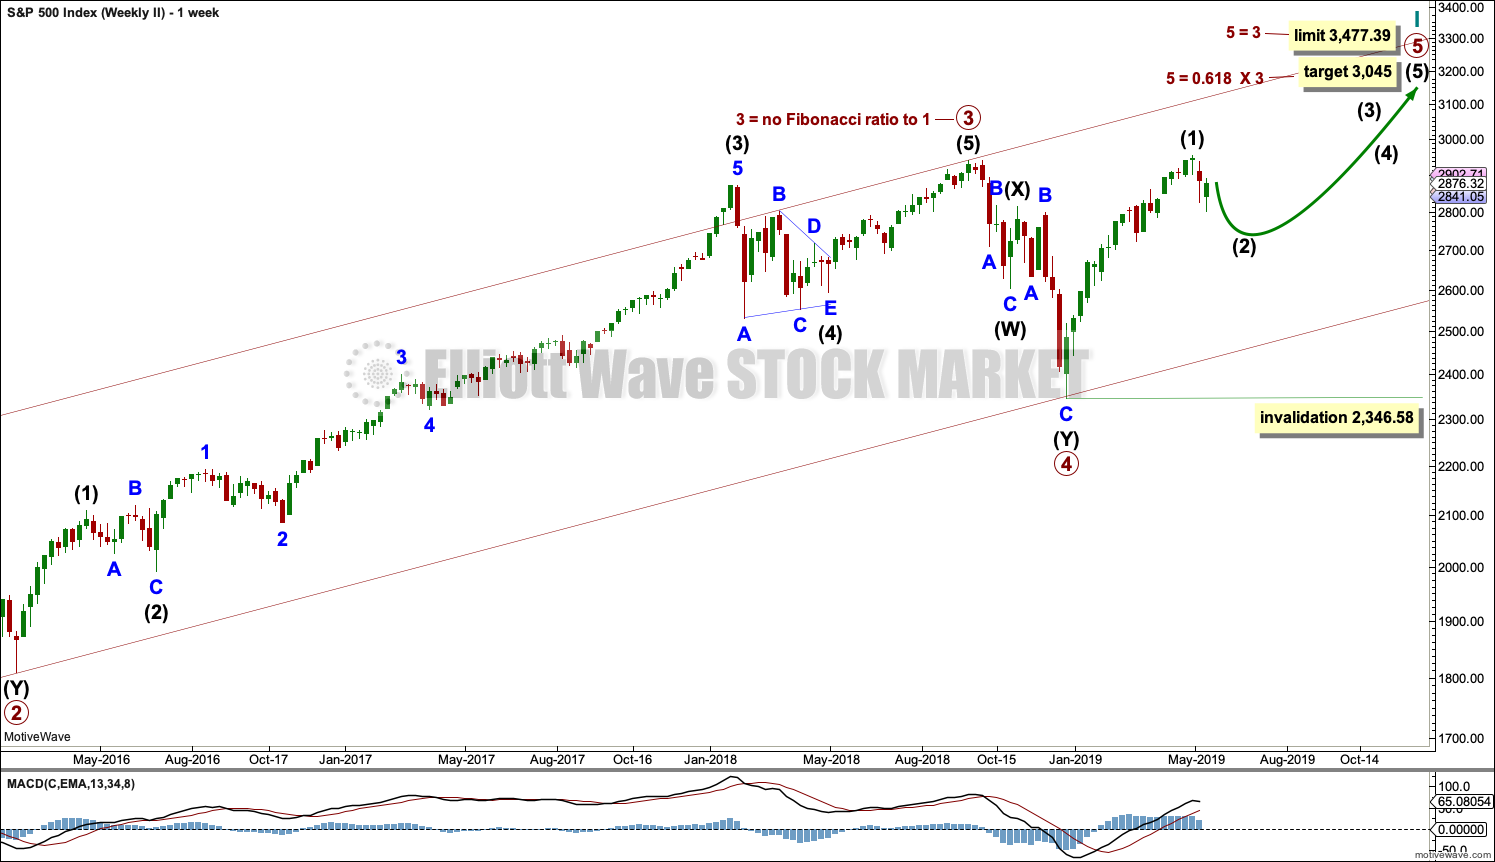
The basic Elliott wave structure consists of a five wave structure up followed by a three wave structure down (for a bull market). This wave count sees the bull market beginning in March 2009 as an incomplete five wave impulse and now within the last fifth wave, which is labelled cycle wave V. This impulse is best viewed on monthly charts. The weekly chart focusses on the end of it.
Elliott wave is fractal. This fifth wave labelled cycle wave V may end a larger fifth wave labelled Super Cycle wave (V), which may end a larger first wave labelled Grand Super Cycle wave I.
The teal Elliott channel is drawn using Elliott’s first technique about the impulse of Super Cycle wave (V). Draw the first trend line from the end of cycle wave I (off to the left of the chart, the weekly candlestick beginning 30th November 2014) to the end of cycle wave III, then place a parallel copy on the end of cycle wave II. This channel perfectly shows where cycle wave IV ended at support. The strongest portion of cycle wave III, the end of primary wave 3, overshoots the upper edge of the channel. This is a typical look for a third wave and suggests the channel is drawn correctly and the way the impulse is counted is correct.
Within Super Cycle wave (V), cycle wave III is shorter than cycle wave I. A core Elliott wave rule states that a third wave may never be the shortest. For this rule to be met in this instance, cycle wave V may not be longer in length than cycle wave III. This limit is at 3,477.39. This limit may still apply if the degree of labelling within cycle wave V is changed all down one degree.
A final target is calculated at cycle degree for the impulse to end.
The structure of cycle wave V is focussed on at the daily chart level below.
Within cycle wave V, primary wave 2 may not move beyond the start of primary wave 1 below 2,346.58.
DAILY CHART
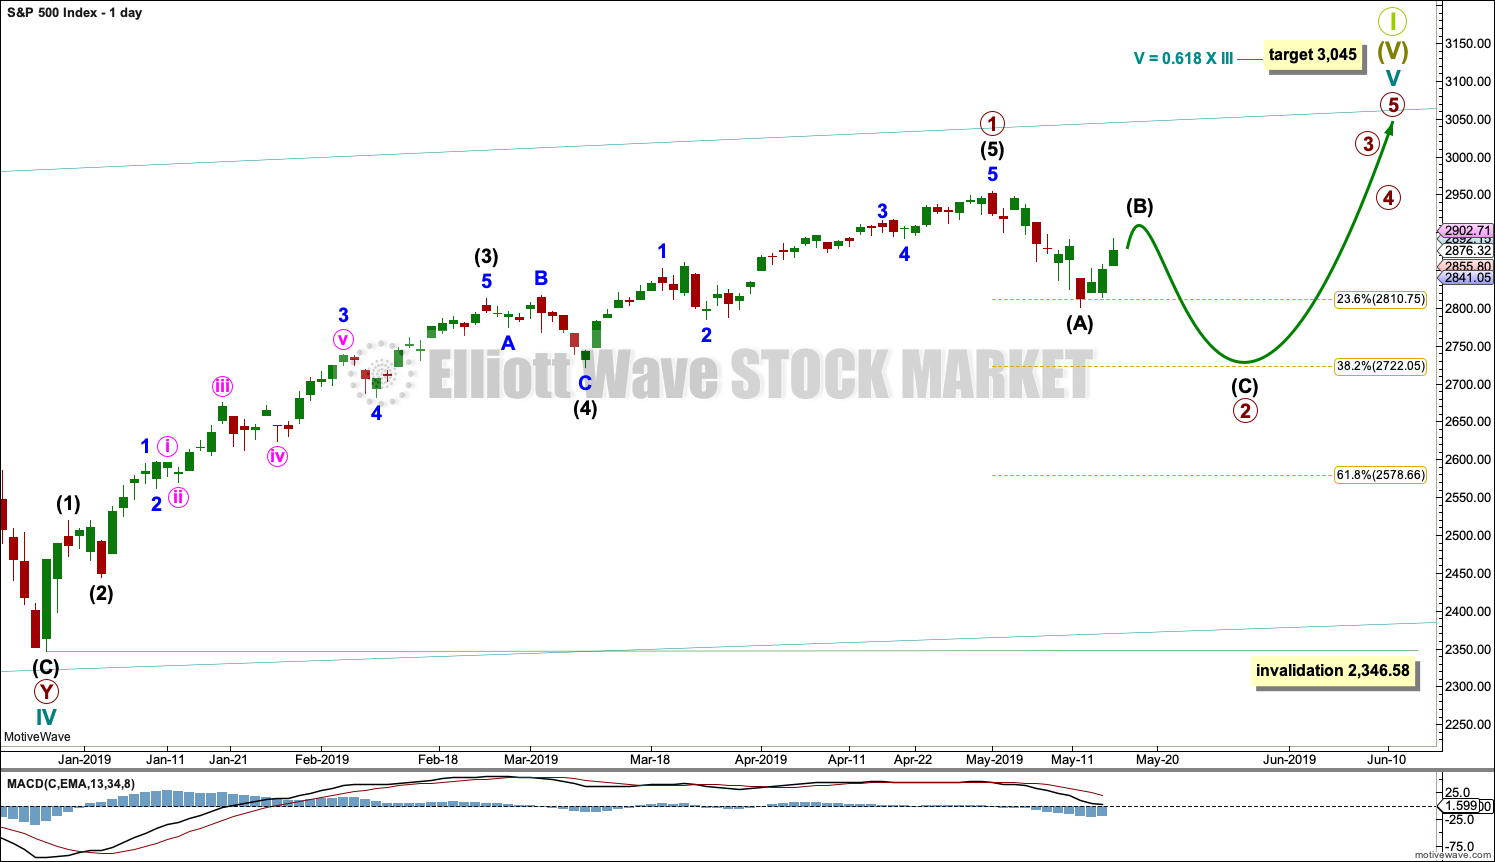
Cycle wave V must subdivide as a five wave motive structure. The current pullback will be labelled primary wave 2.
A best fit channel drawn about primary wave 1, to contain all of it, has been breached by primary wave 2.
The most likely structures for primary wave 2 would be a single or multiple zigzag. The first target for primary wave 2 is the 0.382 Fibonacci ratio at 2,722. The next target is the 0.618 Fibonacci ratio at 2,579.
Primary wave 1 may have lasted 18 weeks. Primary wave 2 so far is within its second week. It may continue for another 3 weeks to total a Fibonacci 5 or another 6 weeks to total a Fibonacci 8.
HOURLY CHART
The most likely structures for primary wave 2 are a single or double zigzag. Both would begin with a five wave structure downwards at the hourly chart level. This may now be complete.
A zigzag would subdivide 5-3-5. Intermediate wave (A) may now be a complete five wave structure. Intermediate wave (B) may now unfold. Intermediate wave (B) may not move beyond the start of intermediate wave (A) above 2,954.01.
Intermediate wave (B) may be any one of more than 23 possible Elliott wave corrective structures. It may be a quick sharp single or double zigzag, or it may be a more time consuming complicated consolidation subdividing as a triangle, combination or flat. Focus over the next few sessions will be on identifying when intermediate wave (B) may be complete and intermediate wave (C) downwards may then begin. The most common Elliott wave corrective structure by a very wide margin is a single zigzag.
Today it looks like intermediate wave (B) may be unfolding as a zigzag. Within the zigzag, minor waves A and B look to be complete and minor wave C may require a final fifth wave up to complete its structure. A target is calculated for minor wave C to end.
When the zigzag upwards that is labelled intermediate wave (B) may be complete, then a new wave down for intermediate wave (C) may begin. At that stage, the Fibonacci ratios between intermediate waves (A) and (C) may be used to calculate a target for intermediate wave (C) to end. At that stage, the target may change or widen to a small zone.
Draw a small channel about intermediate wave (B) using Elliott’s technique. The upper edge has been overshot by minor wave C and may provide support for minute wave iv. When this channel is breached by downwards movement, it may be used as an indication that the zigzag upwards should be over and the next wave down may be underway.
At that stage, technical analysis will be used to identify which of these two hourly wave counts would be most likely.
ALTERNATE HOURLY CHART
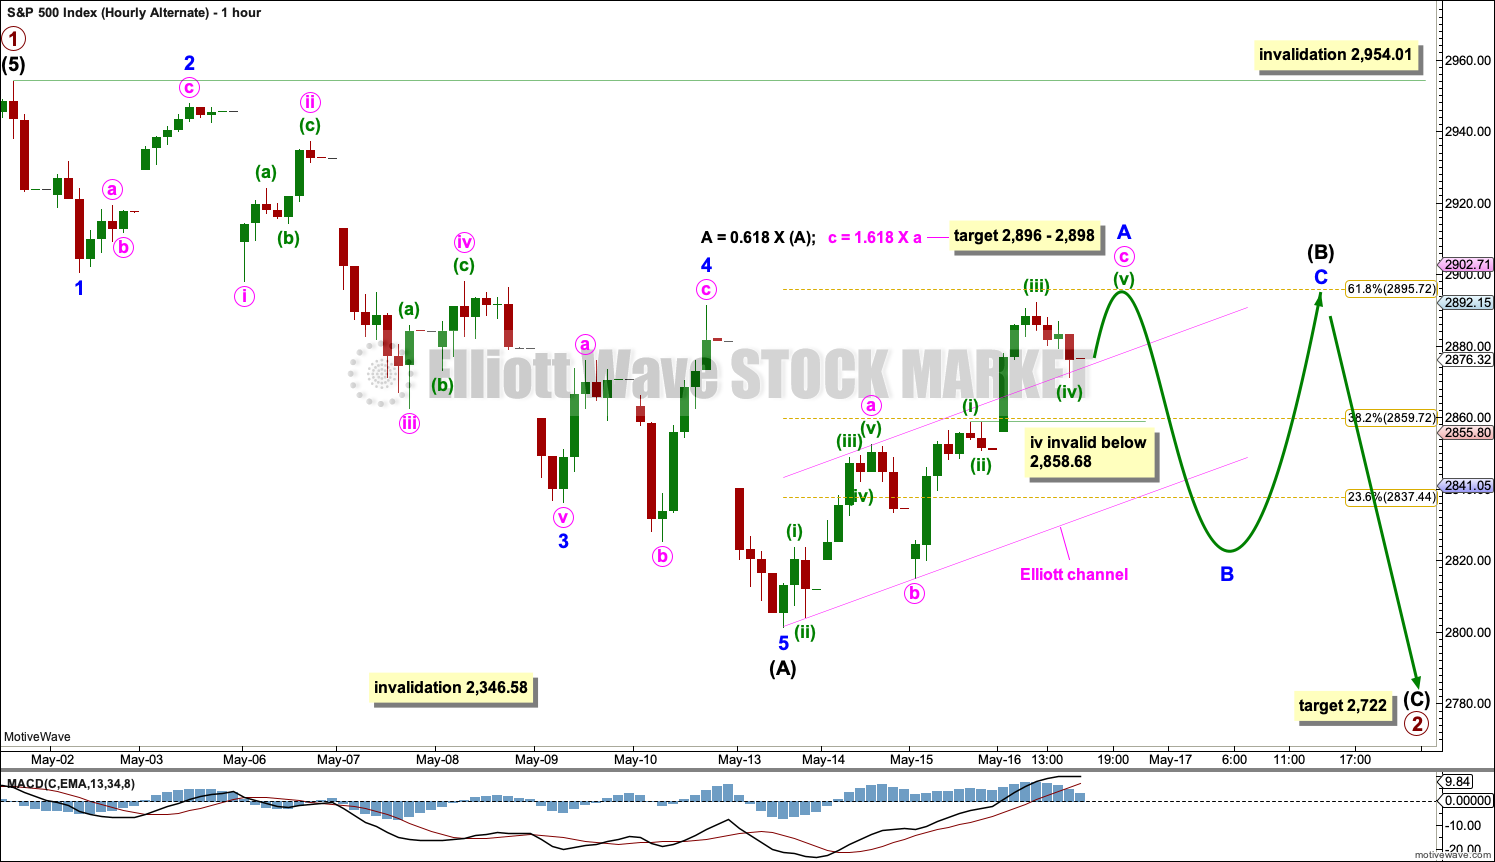
Intermediate wave (B) may be continuing sideways as a flat, triangle or combination if the degree of labelling within it is moved down one degree. Flats are the most common of these three structures followed by triangles and then by combinations, the least common.
Flat corrections subdivide 3-3-5. When minor wave A may be a complete three, then minor wave B may move lower to retrace a minimum 0.9 length of minor wave A. Thereafter, minor wave C may end above the end of minor wave A.
Triangles subdivide 3-3-3-3-3. Minor wave A may be an almost complete zigzag. Thereafter, a triangle would expect sideways movement in an ever decreasing range for another two to three weeks.
Combinations most commonly are composed of one zigzag and one flat correction. When the current zigzag is complete, it may be minor wave W within a double combination. Minor wave X may then move lower as a three wave structure. Thereafter, minor wave Y would most likely move sideways as a flat correction. A double combination may continue for another two to three weeks.
SECOND WAVE COUNT
WEEKLY CHART
This weekly chart is identical to the first weekly chart, with the sole exception being the degree of labelling.
This weekly chart moves the degree of labelling for the impulse beginning in March 2009 all down one degree. This difference is best viewed on monthly charts.
The impulse is still viewed as nearing an end; a fifth wave is still seen as needing to complete higher. This wave count labels it primary wave 5.
TECHNICAL ANALYSIS
WEEKLY CHART
Click chart to enlarge. Chart courtesy of et=”_blank”>StockCharts.com.
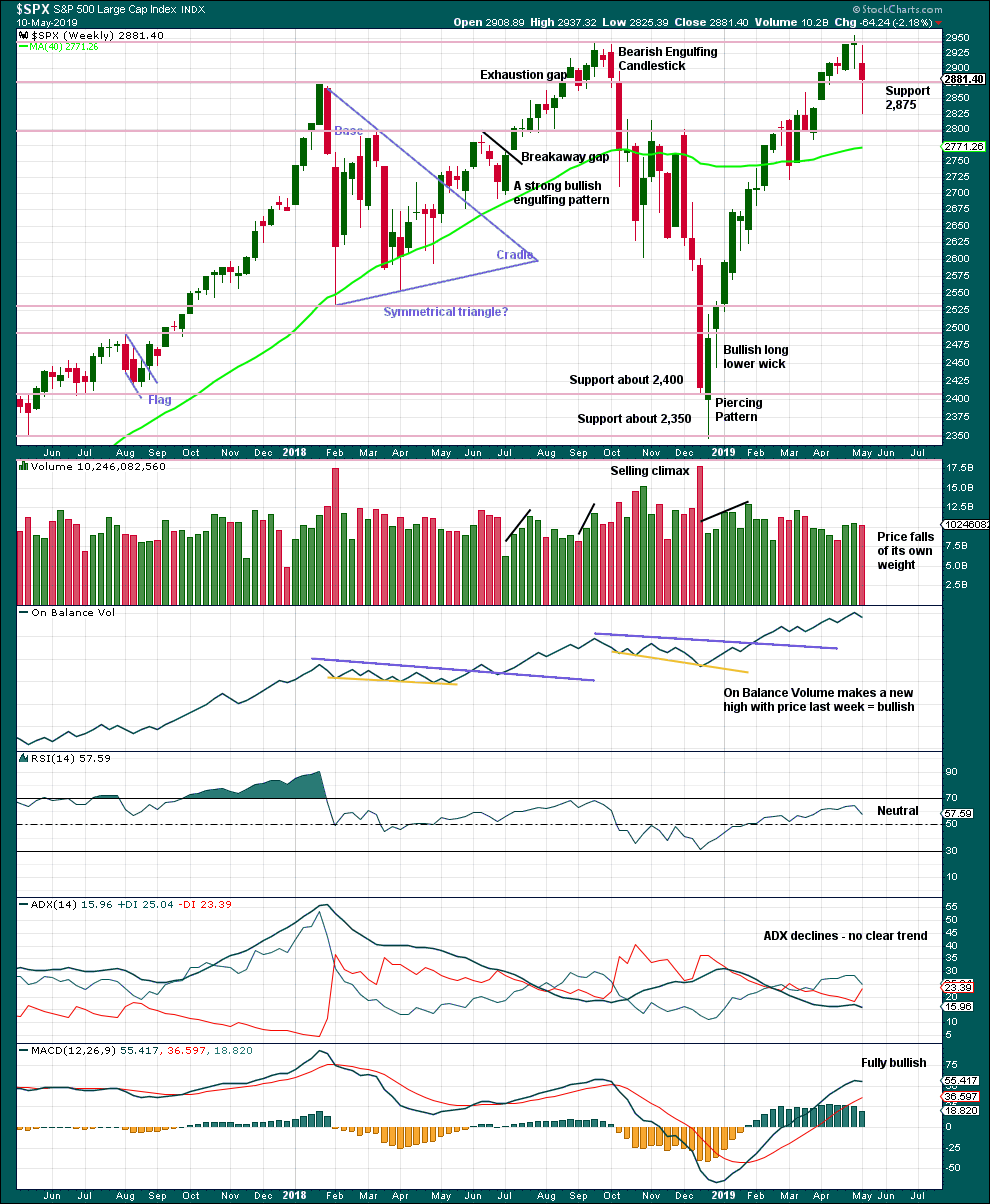
The longer lower wick last week is bullish, but the reasonable length of the upper wick reduces the bullishness here.
DAILY CHART
Click chart to enlarge. Chart courtesy of StockCharts.com.
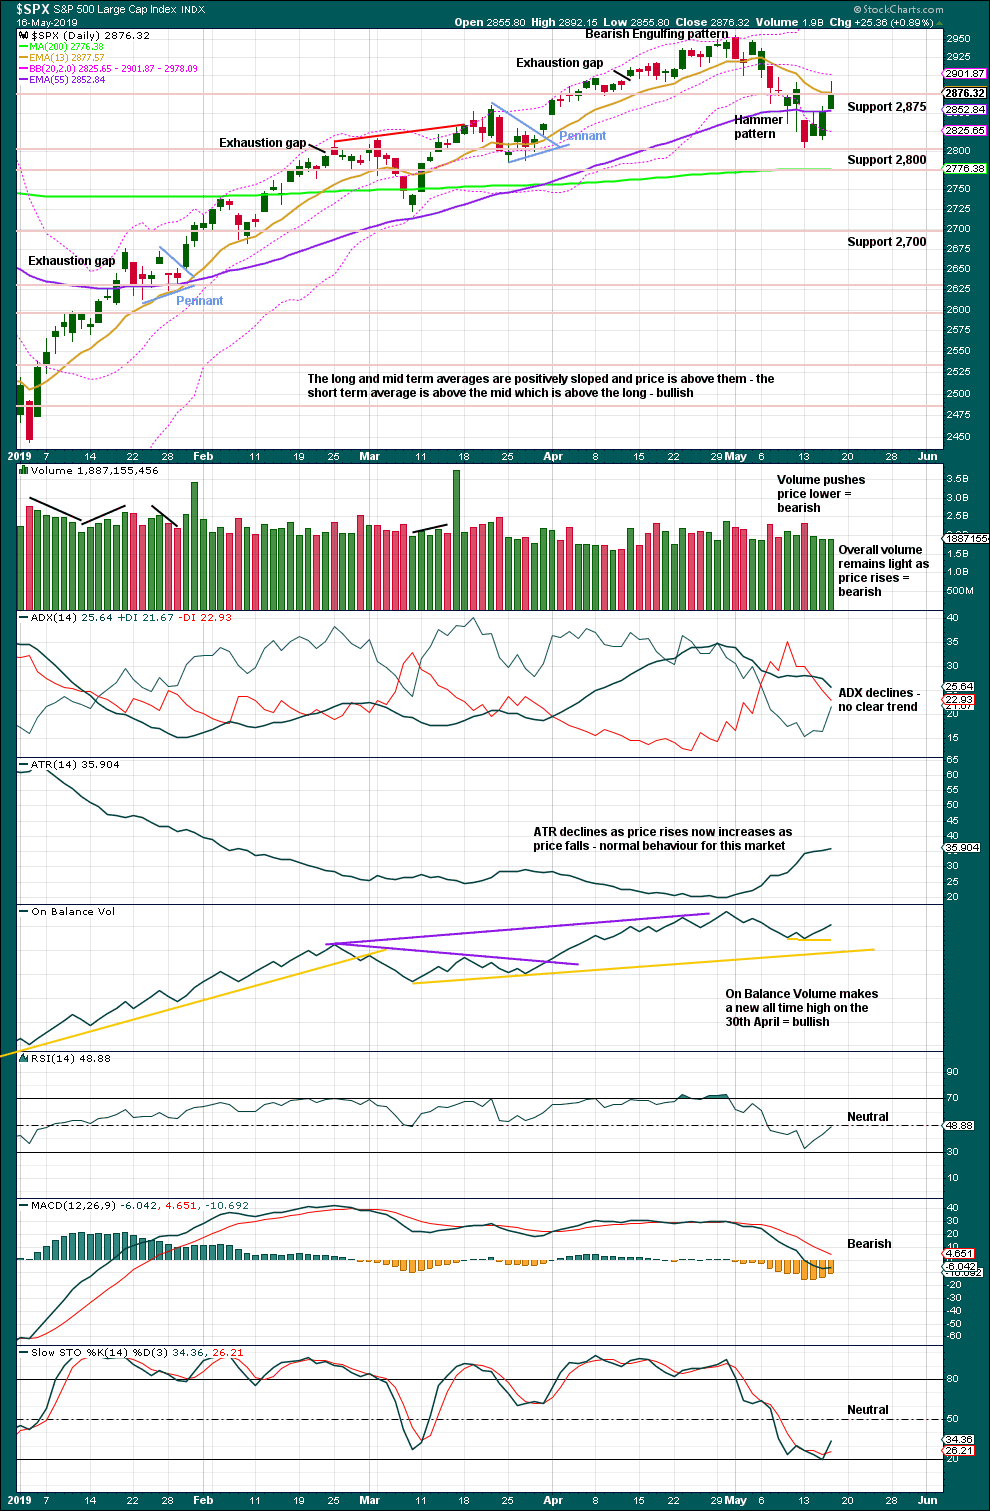
A modest increase in volume today is not enough to change the view of a bearish short-term volume profile. This upwards movement is weak; this looks like a B wave. Lowry’s data shows flat buying power. This does not look like the start of the next rally to new highs.
BREADTH – AD LINE
WEEKLY CHART
Click chart to enlarge. Chart courtesy of StockCharts.com. So that colour blind members are included, bearish signals
will be noted with blue and bullish signals with yellow.
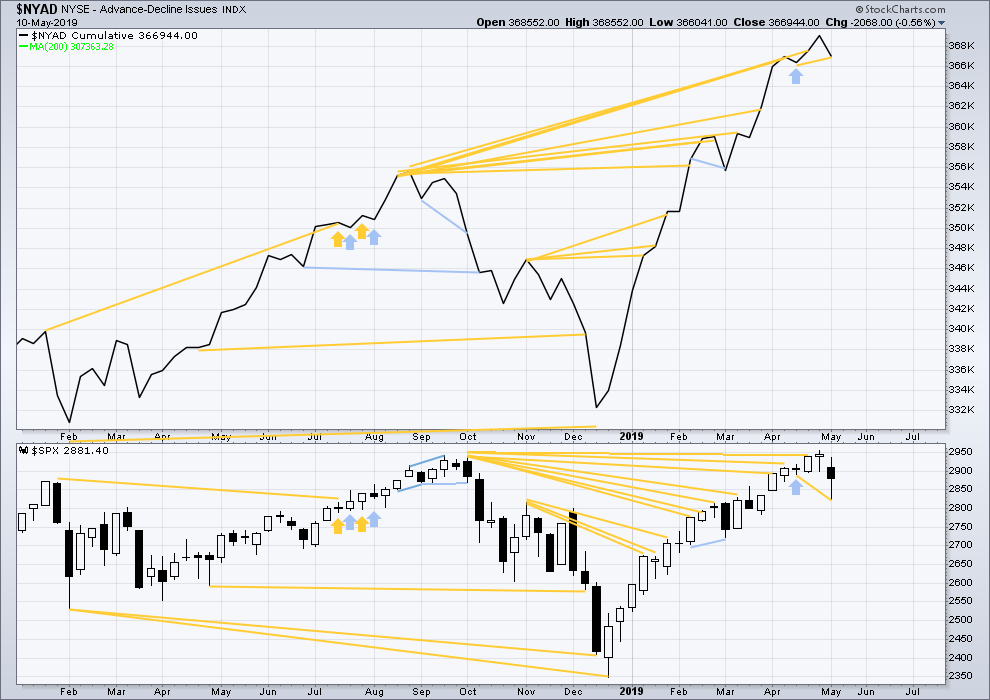
Every single bear market from the Great Depression and onwards has been preceded by a minimum of 4 months divergence between price and the AD line. With the AD line making a new all time high again last week, the end of this bull market and the start of a new bear market must be a minimum of 4 months away, which is the beginning of September 2019 at this time.
Last week price has made a new low below the low three weeks prior, but the AD line has not. Downwards movement in price this week has not come with a corresponding decline in market breadth. This divergence is bullish for the short term.
Last week all of large, mid and small caps have moved lower. None have made new swing lows below the low of the 25th of March. There is no divergence.
DAILY CHART
Click chart to enlarge. Chart courtesy of StockCharts.com. So that colour blind members are included, bearish signals
will be noted with blue and bullish signals with yellow.
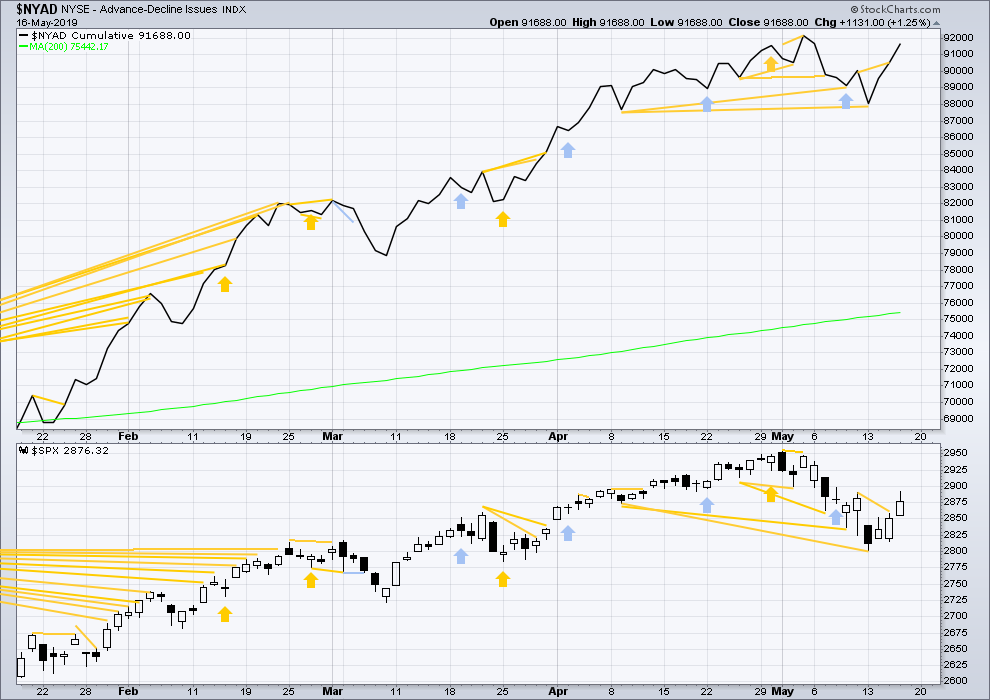
Breadth should be read as a leading indicator.
Short-term bullish divergence noted in yesterday’s analysis has now been followed by an upwards day. It may now be resolved.
Today both price and the AD line have made new highs above the prior short-term swing high of the 10th of May. There is no short-term divergence.
VOLATILITY – INVERTED VIX CHART
WEEKLY CHART
Click chart to enlarge. Chart courtesy of StockCharts.com. So that colour blind members are included, bearish signals
will be noted with blue and bullish signals with yellow.
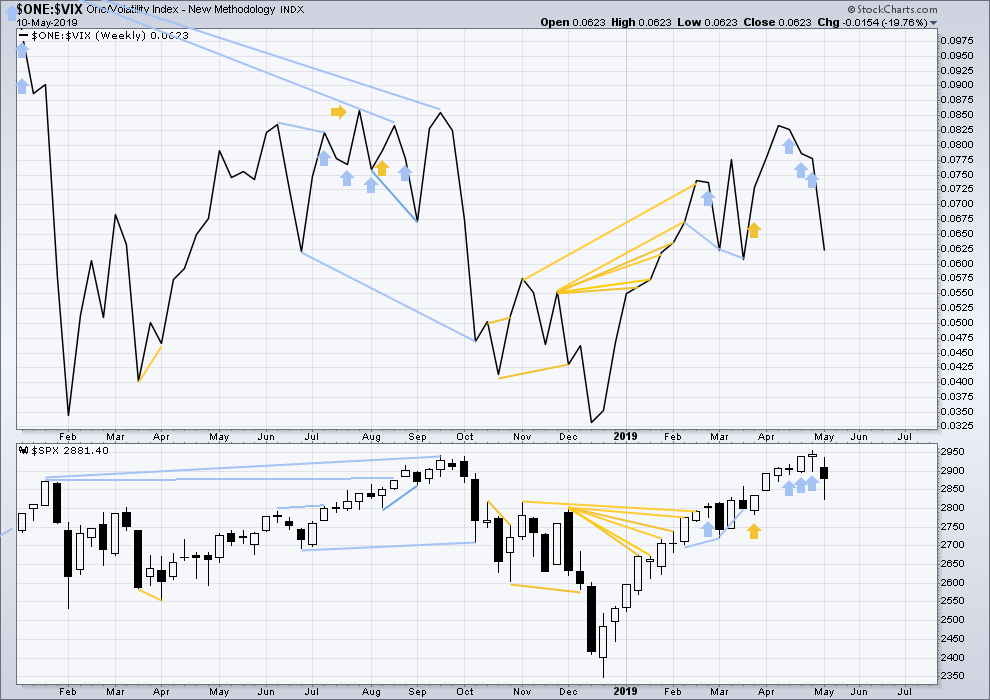
Three weeks in a row of weekly bearish divergence has now been followed by a reasonable downwards week. It may be resolved here, or it may yet be an indication of further downwards movement in price.
Last week both price and inverted VIX have moved lower. Inverted VIX is not moving any faster than price. There is no short-term divergence.
DAILY CHART
Click chart to enlarge. Chart courtesy of StockCharts.com. So that colour blind members are included, bearish signals
will be noted with blue and bullish signals with yellow.
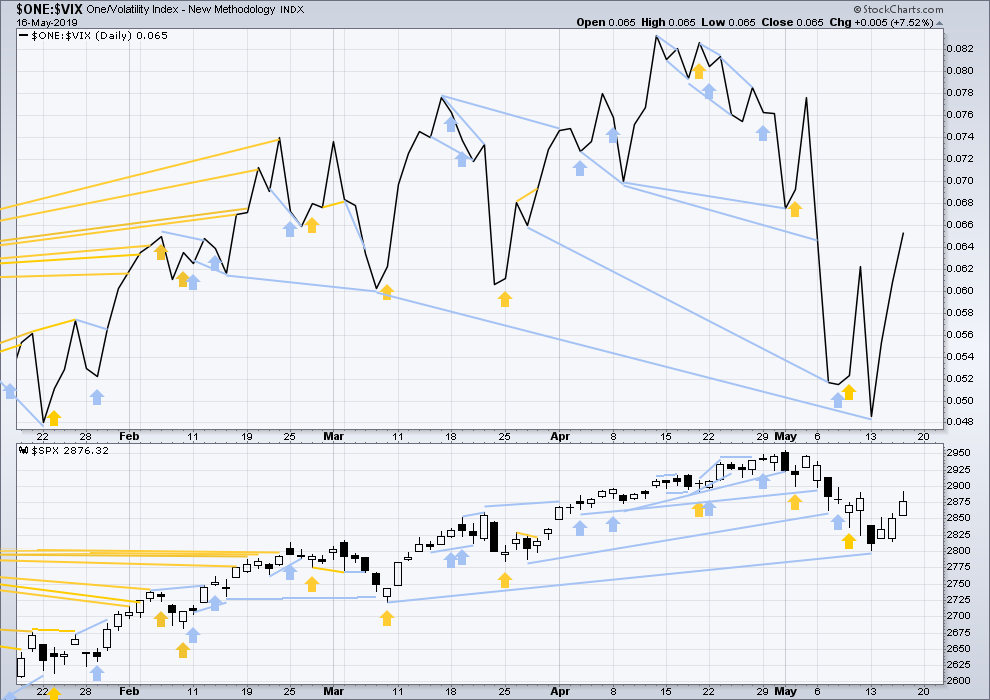
Today both price and inverted VIX have moved higher. There is no new short-term divergence.
DOW THEORY
Dow Theory confirmed a bear market in December 2018. This does not necessarily mean a bear market at Grand Super Cycle degree though; Dow Theory makes no comment on Elliott wave counts. On the 25th of August 2015 Dow Theory also confirmed a bear market. The Elliott wave count sees that as part of cycle wave II. After Dow Theory confirmation of a bear market in August 2015, price went on to make new all time highs and the bull market continued.
DJIA: 23,344.52 – a close on the 19th of December at 23,284.97 confirms a bear market.
DJT: 9,806.79 – price has closed below this point on the 13th of December.
S&P500: 2,532.69 – a close on the 19th of December at 2,506.96 provides support to a bear market conclusion.
Nasdaq: 6,630.67 – a close on the 19th of December at 6,618.86 provides support to a bear market conclusion.
With all the indices moving now higher, Dow Theory would confirm a bull market if the following highs are made:
DJIA: 26,951.81
DJT: 11,623.58
S&P500: 2,940.91 – a new all time high has been made on the 29th of April 2019.
Nasdaq: 8,133.30 – a new high has been made on 24th of April 2019.
Published @ 08:35 p.m. EST.
—
Careful risk management protects your trading account(s).
Follow my two Golden Rules:
1. Always trade with stops.
2. Risk only 1-5% of equity on any one trade.
—
New updates to this analysis are in bold.

“Lara The Nimble”
(btw… that’s a high compliment!)
LOL
I’m having a wee chuckle at that one. Thanks!
First hourly chart updated:
Intermediate (B) may be complete as a double zigzag. These are fairly common structures.
Alternate hourly updated:
Intermediate (B) could continue sideways next week and maybe into the following week also as a flat. It could also be a triangle. Or a combination.
Of these options I have found flats the most common (particularly for B waves), followed by triangles and lastly combinations. In my research (this surprised me) I have found combinations uncommon. Which shows me that my “feeling” of what may be more common was wrong. Data is better.
To distinguish between the two counts I’ll use technical analysis. I’ll look for strength or weakness in downwards movement from here, and any bearish signals from the AD line, On Balance Volume or VIX (weighted in that order).
There are so many possibilities here. Intermediate B may be morphing into a triangle or combination. And of course, we do not yet know the overall pattern Primary 2 will take. There could be lots of volatile days in both directions ahead of us. For that reason, I will not take a short position using VIX derivatives. The leverage and need for close stops can end up whipsawing me as I have seen in so many B waves before.
However, using a less volatile derivative of SPX such as an inverse ETF may be the way to go as a short strategy looking for the 2722 target. Note: 2722 is the higher of two targets. It is certainly possible that the lower target of 2579 may be reached.
For a few weeks there has been LOTS of overnight price movement. I think looking at futures with overnight data can be a valuable “additional view”. Here’s /ES hourly from the recent market high (which you might note occurred during an overnight session, not a day session) to the present.
This view indicates to me that the movement upward over this week (B wave) was a WXY combination, because I can fairly easily trace out a 3-3-3 movement. Now I suspect we’ve got a C down with a starting impulse which is now in a small wave iv back up (maybe completed already).
Warning: my EW skills are weak at best, take my notions as “ideas only”.
Now what I suspect is a little iv up of an impulse down is “coiling”, after entry from above. Consistent with the model. “Should” break out downward to complete a v. But that may not be very large. Since this C wave down so far isn’t close to the recent lows, I presume it’s just the start of a large C wave structure.
Open to different takes on what’s happening here. I’m keeping my bullets dry here; way to much uncertainty and significant data that lower lows are likely before the market shifts back to motive wave action upward (big 4 is complete and a big 5 launches). Maybe more careful/small tactical shorts, is all.
wrong again, Einstein!!! Lol!!!!
it’s an ugly corrective mess, I can say that with certainty. Wake me up when a motive wave up starts, please.
Just using up time in complexity moving sideways.
Lara (or anyone else who might like to answer),
Under the Hourly Count you wrote:
—————————————————————————————————
Draw a small channel about intermediate wave (B) using Elliott’s technique. The upper edge has been overshot by minor wave C and may provide support for minute wave iv. When this channel is breached by downwards movement, it may be used as an indication that the zigzag upwards should be over and the next wave down may be underway.
—————————————————————————————————
I need a bit of clarification to understand. First, I am not sure what is Elliott’s technique for drawing this channel. Please clarify. Second, when you state that the breach of the channel by downwards movement may be used, which channel line must be breached? Is it the upper one which may now provide support, or is it the lower channel line which is the usual one we use to show a potential change in direction?
Thanks in advance for your answer. Since market futures are down 18 before the open, these questions may no longer be relevant, but I would like to understand for similar situations in the future .
The channel for a corrective movement is drawn from the start of wave A to the end of wave B, then a parallel copy is placed upon the end of wave A. Wave C often ends about the upper edge of the channel (for an upwards sloping movement). Sometimes wave C overshoots the channel.
When the lower edge of the channel is breached that indicates a trend change.
Because by that stage price has turned. The channel containing the upwards movement is now breached by downwards movement.
#1
I’m back, I’m back, I’m back in the saddle again…
Dog gone it cowboy.
I thought I saw dat silly wabbit…