A very small range sideways day has prompted a slight change to the short-term outlook. The mid and long-term outlook remains the same and has support from classic technical analysis.
Summary: For the short term, while price remains now above 2,520.27, a small fourth wave may be completing. Thereafter, the upwards trend should resume.
The bigger picture still expects that a low may now be in place. Confidence in this view may be had if price makes a new high above 2,631.09. The target is at 3,045 with a limit at 3,477.39. This primary view has support from strongly rising market breadth and a 90% up day on the 4th of January.
The alternate wave count expects one more low before cycle wave IV is complete. Targets are either 2,269 or 2,242 – 2,240, although when intermediate wave (4) may be complete the target would be recalculated.
New updates to this analysis are in bold.
The biggest picture, Grand Super Cycle analysis, is here.
The monthly chart was last published here.
MAIN ELLIOTT WAVE COUNT
WEEKLY CHART
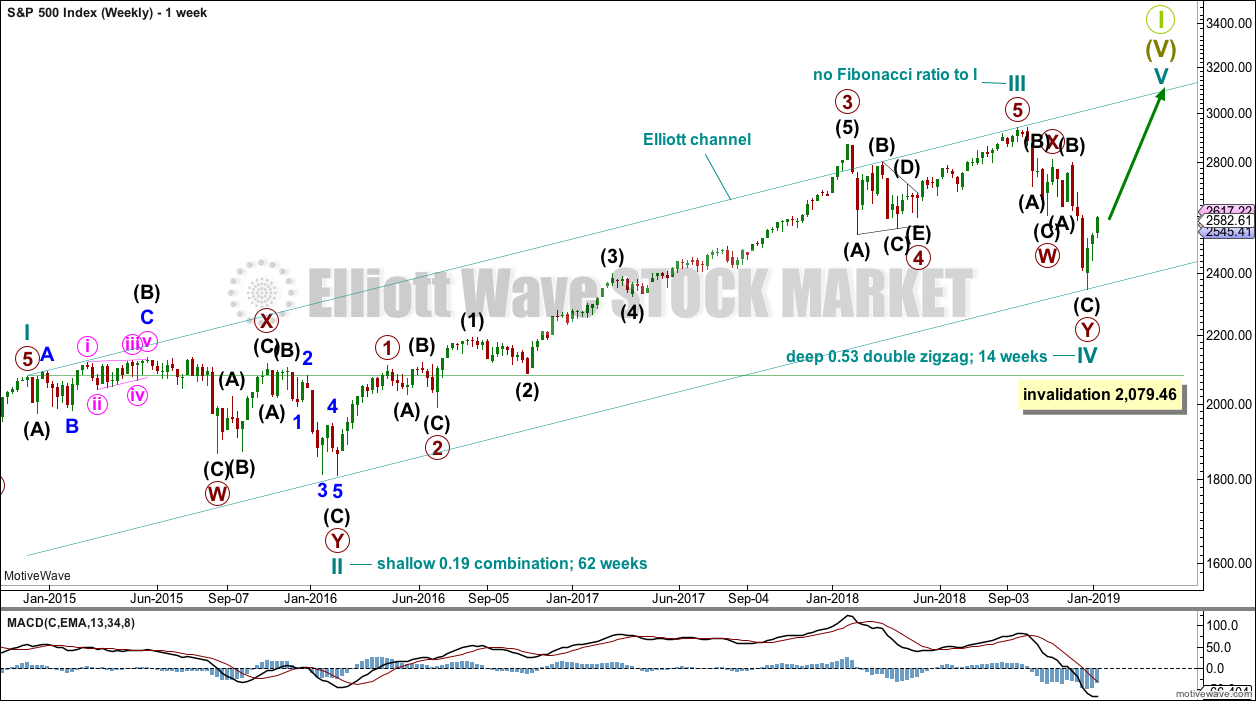
This weekly chart shows all of cycle waves II, III and IV so far.
Cycle wave II fits as a time consuming double combination: flat – X – zigzag. Combinations tend to be more time consuming corrective structures than zigzags. If cycle wave IV completes as a single or multiple zigzag, then it should be expected to be more brief than cycle wave II.
Cycle wave IV may have ended at the lower edge of the Elliott channel. Fourth waves are not always contained within Elliott channels. If the alternate daily wave count below is correct, then cycle wave IV may breach this channel.
Cycle wave IV may not move into cycle wave I price territory below 2,079.46.
Although both cycle waves II and IV are labelled W-X-Y, they are different corrective structures. There are two broad groups of Elliott wave corrective structures: the zigzag family, which are sharp corrections, and all the rest, which are sideways corrections. Multiple zigzags belong to the zigzag family and combinations belong to the sideways family. There is perfect alternation between the possible double zigzag of cycle wave IV and the combination of cycle wave II.
Although there is gross disproportion between the duration of cycle waves II and IV, the size of cycle wave IV in terms of price makes these two corrections look like they should be labelled at the same degree. Proportion is a function of either or both of price and time.
Draw the Elliott channel about Super Cycle wave (V) as shown. Cycle wave V may find resistance about the upper edge.
DAILY CHART
The daily chart will focus on the structure of cycle waves IV and V.
Cycle wave IV may be a complete double zigzag. This would provide perfect alternation with the combination of cycle wave II. Double zigzags are fairly common corrective structures.
Within Super Cycle wave (V), cycle wave III may not be the shortest actionary wave. Because cycle wave III is shorter than cycle wave I, this limits cycle wave V to no longer than equality in length with cycle wave III at 3,477.39. A target is calculated for cycle wave V to end prior to this point.
Cycle wave V must subdivide as a five wave motive structure, either an impulse or an ending diagonal. An impulse is much more common and that will be how it is labelled. A diagonal would be considered if overlapping suggests it.
Within the five wave structure for cycle wave V, primary wave 1 would be incomplete. Within primary wave 1, intermediate wave (1) may be incomplete. The degree of labelling within cycle wave V may need to be adjusted as it unfolds further.
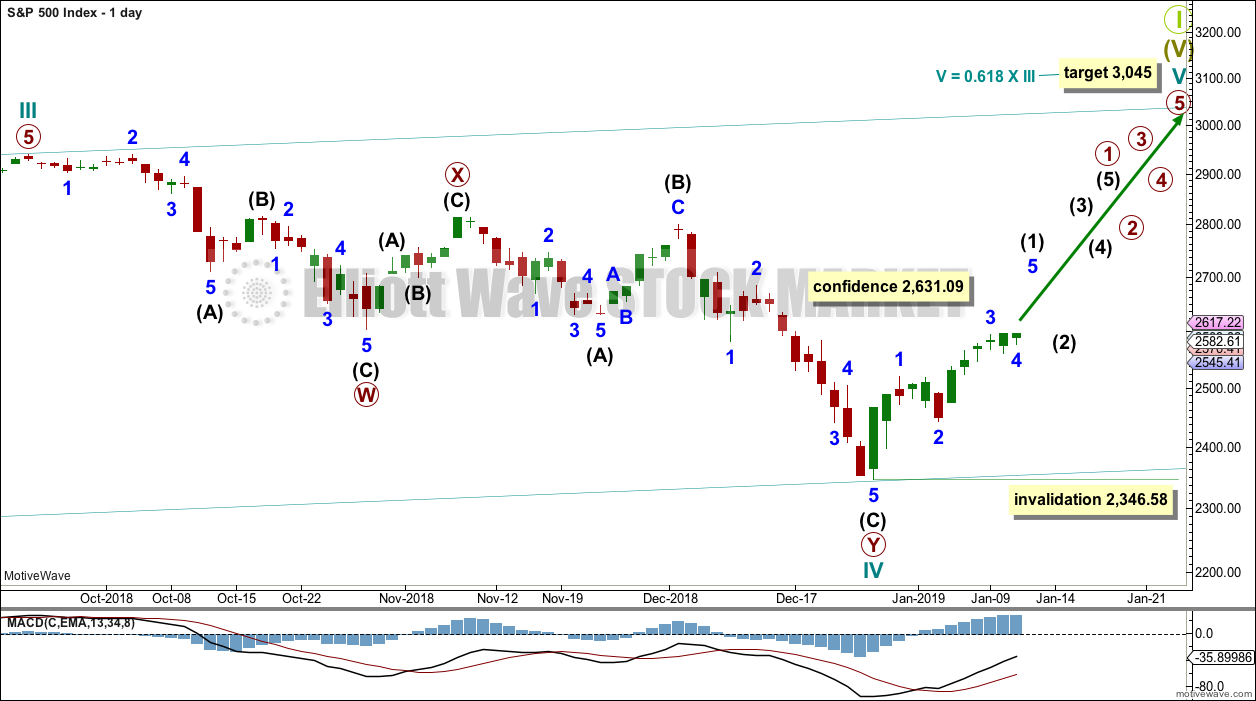
Within cycle wave V, no second wave correction may move beyond the start of its first wave below 2,346.58.
At this stage, a new high by any amount at any time frame above 2,631.09 would invalidate the alternate wave count below and provide confidence in this main wave count.
HOURLY CHART
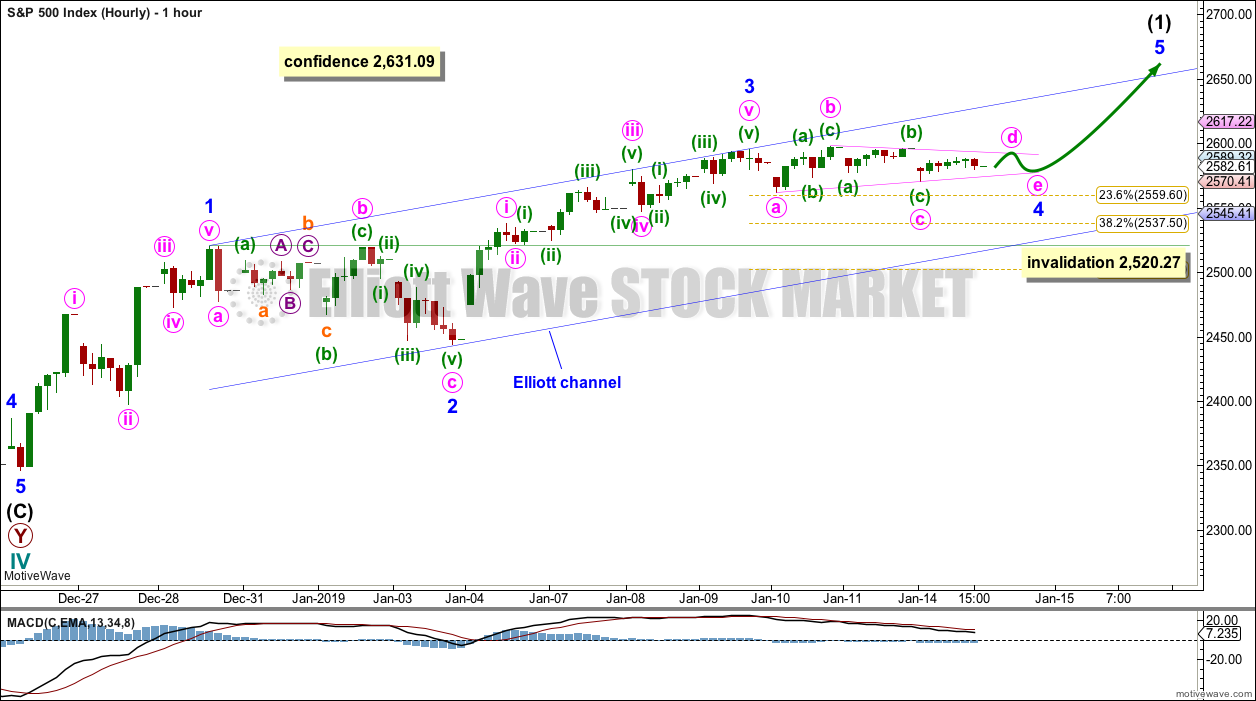
Intermediate wave (1) may be incomplete and may be unfolding as an impulse.
Within the impulse, minor waves 1, 2 and 3 may now be complete. Minor wave 4 may be moving sideways as a running contracting triangle. These are relatively common structures for fourth waves.
Minor wave 4 may not move into minor wave 1 price territory below 2,520.27.
Within this wave count, minor wave 3 is shorter than minor wave 1. Third waves may never be the shortest actionary wave, so minor wave 5 would be limited to no longer than equality in length with minor wave 3 at 151.36 points, so that this core Elliott wave rule is met.
SECOND HOURLY CHART
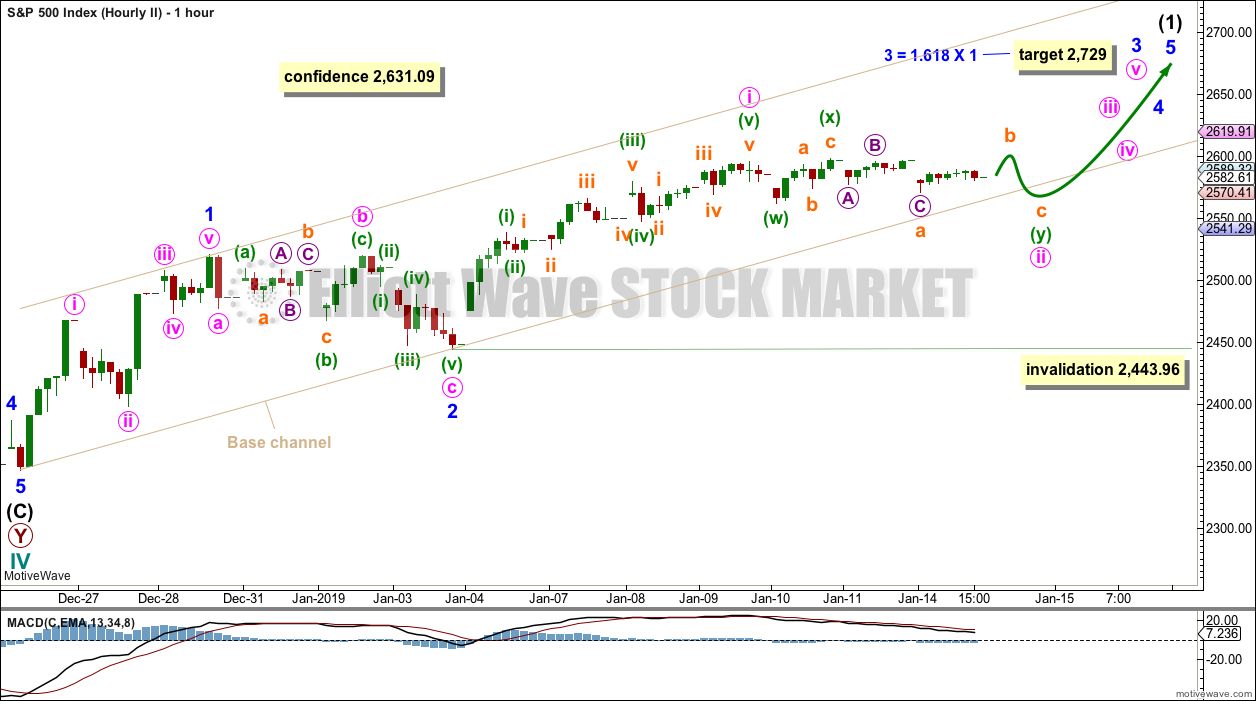
This wave count moves the degree of labelling within minor wave 3 down one degree. Minor wave 3 may be incomplete. Within minor wave 3, only minute wave i may be complete.
Minute wave ii may not subdivide as a triangle. Minute wave ii may be subdividing as a double combination: zigzag – X – flat.
Within the flat correction of minuette wave (ii), subminuette wave b must retrace a minimum 0.9 length of subminuette wave a at 2,595.08. Thereafter, subminuette wave c should move beyond the end of subminuette wave a to make a new low below 2,570.41, avoiding a truncation.
This wave count would expect minute wave ii to breach the lower edge of the base channel. Base channels most often provide support to lower degree second waves. They may be breached, but this is not common.
Minute wave ii may not move beyond the start of minute wave i below 2,443.96.
ALTERNATE DAILY CHART
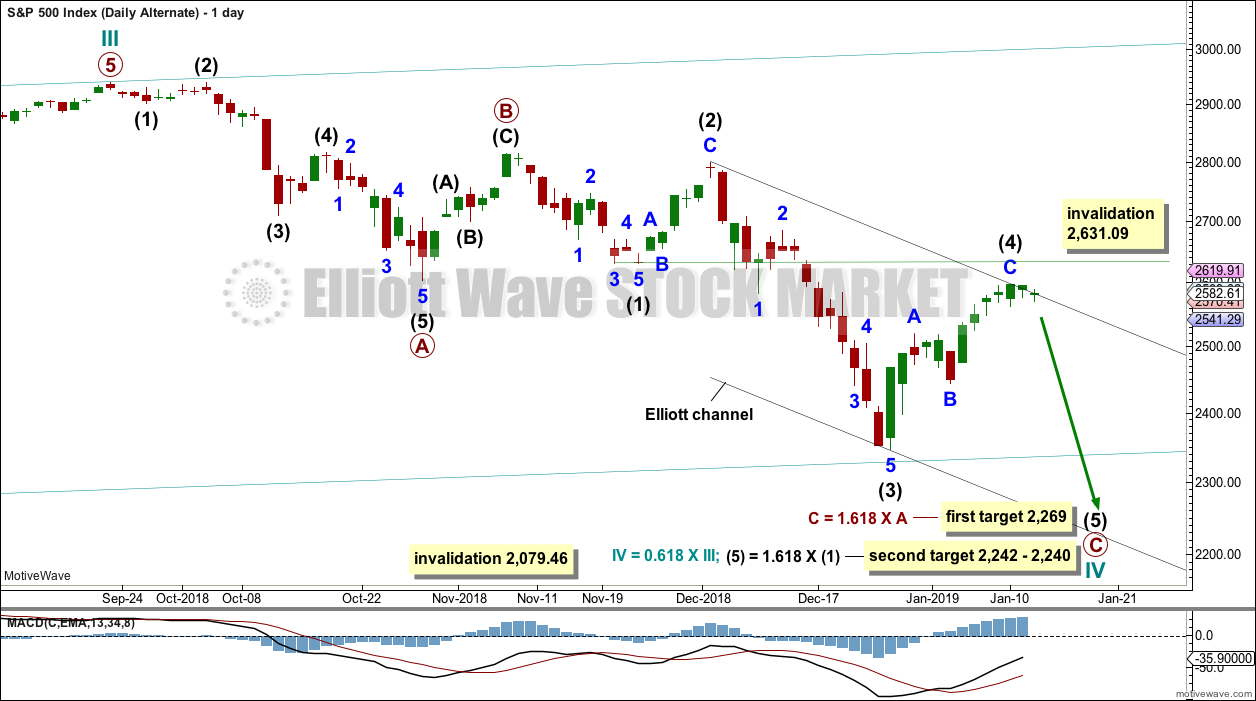
Cycle wave IV may be a an incomplete single zigzag. This would provide perfect alternation with the combination of cycle wave II. Zigzags are the most common corrective structures.
Within this zigzag, primary wave C may be completing as a five wave impulse.
Intermediate wave (2) shows up on the weekly and daily charts. Intermediate wave (4) now also shows on weekly and daily charts. This wave count has the right look.
Intermediate wave (4) may not move into intermediate wave (1) price territory above 2,631.09.
Targets are calculated for cycle wave IV to end. If price gets to the first target and the structure is incomplete, or if price falls through the first target, then the second target may be used.
Redraw the channel about primary wave C using Elliott’s second technique. Draw the first trend line from the high of intermediate wave (2) to the high of intermediate wave (4), then place a parallel copy on the low of intermediate wave (3). If intermediate wave (4) continues higher, then redraw the channel using the same technique. The lower edge may then provide support for intermediate wave (5).
ALTERNATE HOURLY CHART
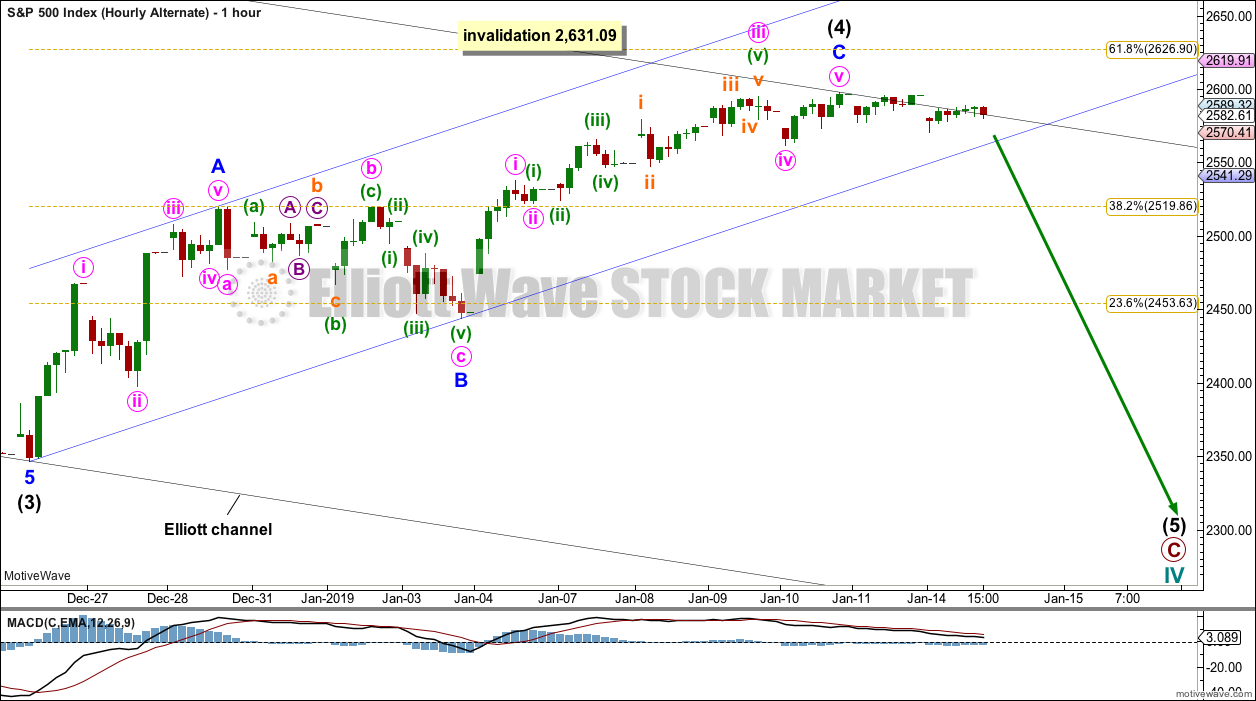
Intermediate wave (4) may be a complete zigzag. A trend change would be expected for this alternate wave count down to the targets given on the daily chart.
A channel is drawn using Elliott’s technique about the zigzag of intermediate wave (4). If this channel is breached by downwards movement, then that would be the first indication that this alternate wave count may be correct and the main wave count may be wrong.
Although minute wave v looks like a three wave structure on the hourly chart, on the five minute chart it fits well as an ending contracting diagonal.
TECHNICAL ANALYSIS
WEEKLY CHART
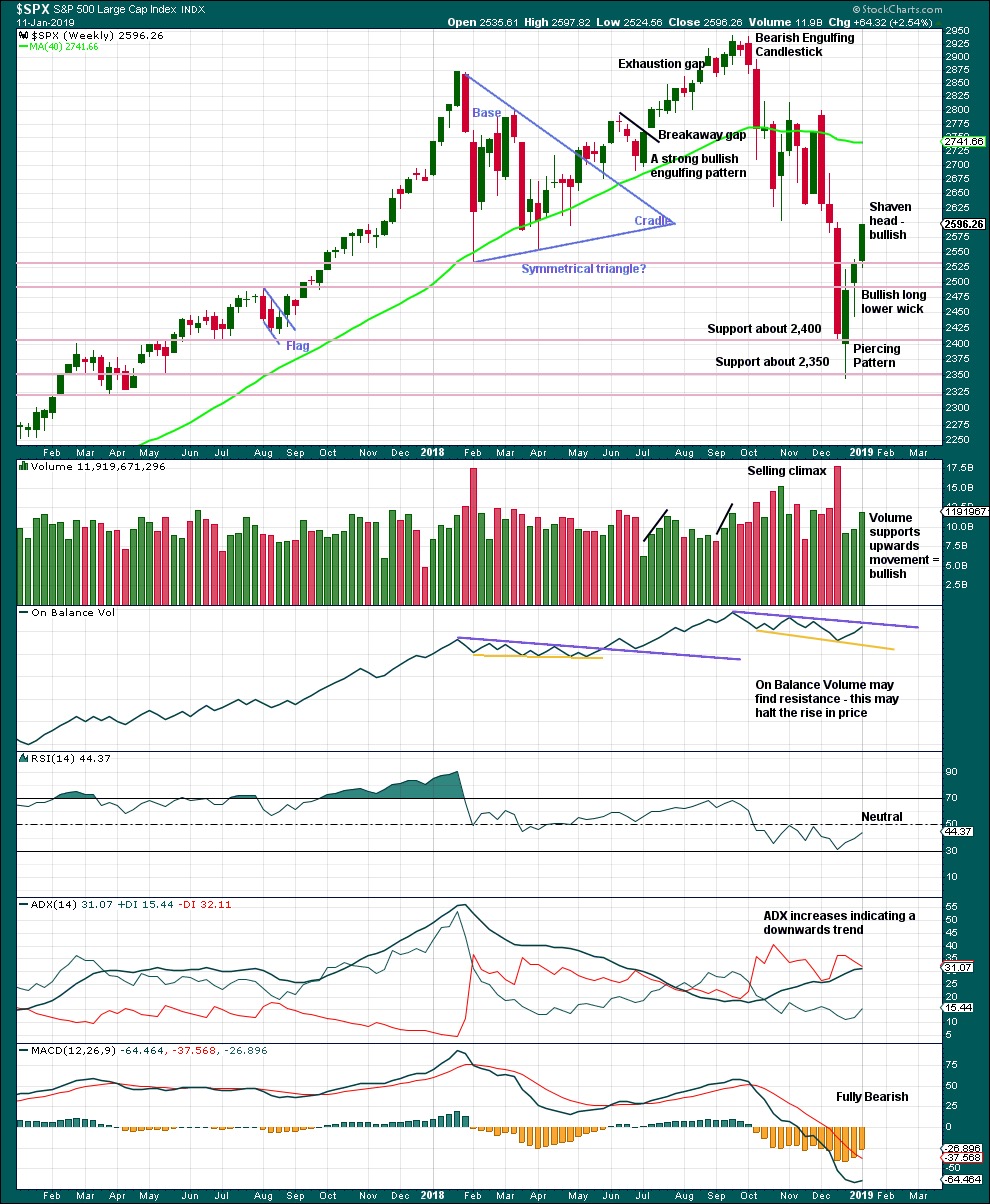
Click chart to enlarge. Chart courtesy of et=”_blank”>StockCharts.com.
From the all time high to the low of last week, price moved lower by 20.2% of market value meeting the definition for a bear market.
It should be noted that the large fall in price from May 2011 to October 2011 also met this definition of a bear market, yet it was only a very large pullback within a bull market, which so far has lasted almost 10 years.
The last weekly candlestick with a shaven head and good support from volume strongly suggests more upwards movement this week.
DAILY CHART
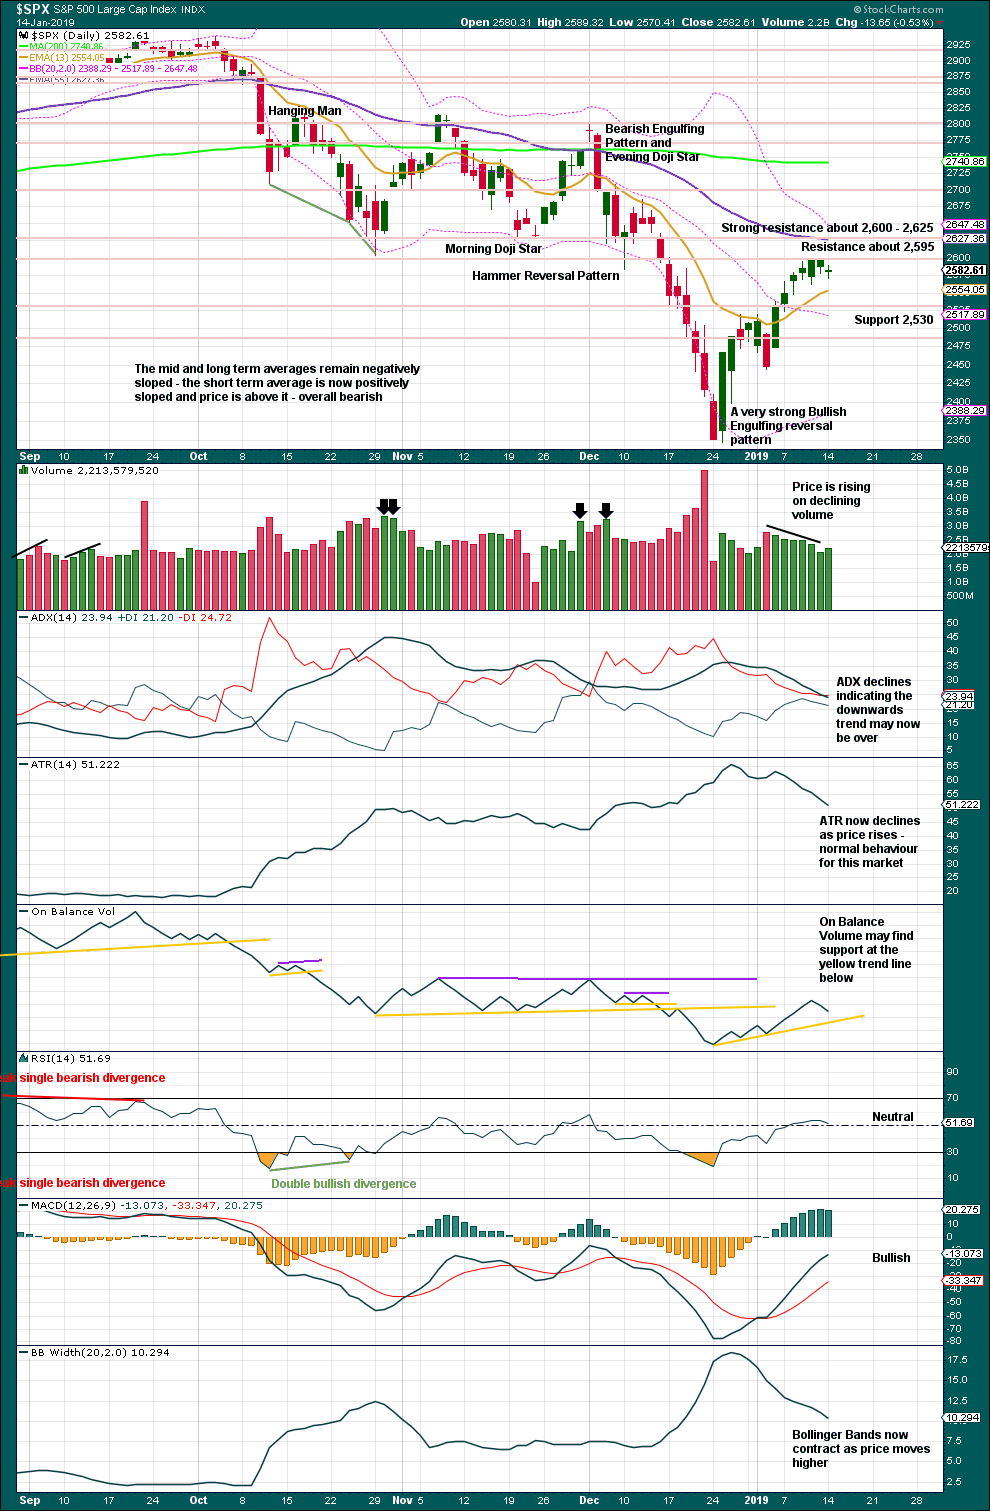
Click chart to enlarge. Chart courtesy of StockCharts.com.
Over a fairly long period of time this ageing bull market has been characterised by upwards movement on light and declining volume and low ATR. For the short to mid term, little concern may be had if price now rises again on declining volume. Current market conditions have allowed for this during a sustained rise in price.
It is also normal for this market to have lower ATR during bullish phases, and strongly increasing ATR during bearish phases. Currently, declining ATR is normal and not of a concern.
Considering the larger picture from the Elliott wave count, some weakness approaching the end of Grand Super Cycle wave I is to be expected.
From Kirkpatrick and Dhalquist, “Technical Analysis” page 152:
“A 90% downside day occurs when on a particular day, the percentage of downside volume exceeds the total of upside and downside volume by 90% and the percentage of downside points exceeds the total of gained points and lost points by 90%. A 90% upside day occurs when both the upside volume and points gained are 90% of their respective totals”…
and “A major reversal is singled when an NPDD is followed by a 90% upside day or two 80% upside days back-to-back”.
The current situation saw two 80% downside days on December 20th and 21st, then a near 90% downside day with 88.97% downside on December 24th. This very heavy selling pressure on three sessions very close together may be sufficient to exhibit the pressure observed in a 90% downside day.
This has now been followed by two 90% upside days: on December 26th and again on 4th January.
The current situation looks very much like a major low has been found.
BREADTH – AD LINE
WEEKLY CHART
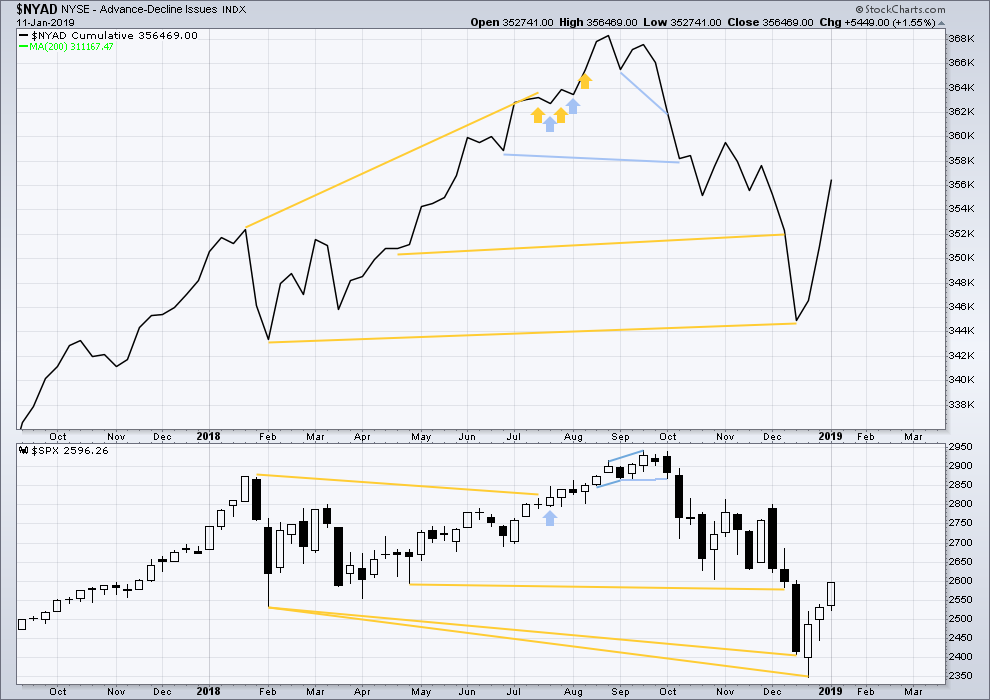
Click chart to enlarge. Chart courtesy of StockCharts.com. So that colour blind members are included, bearish signals
will be noted with blue and bullish signals with yellow.
Upwards movement has support from rising market breadth.
DAILY CHART
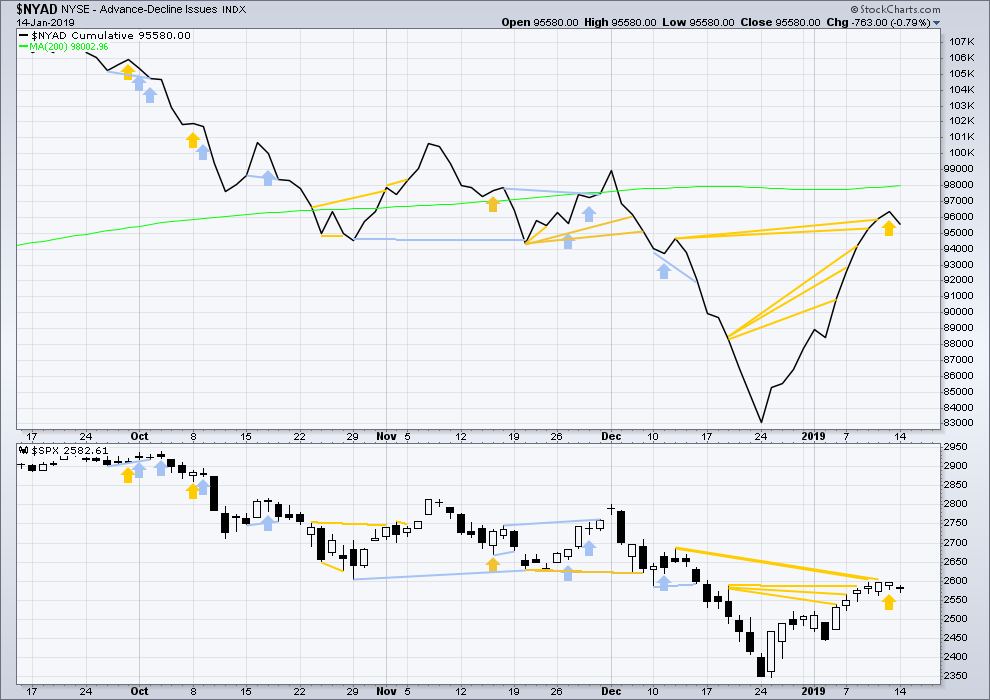
Click chart to enlarge. Chart courtesy of StockCharts.com. So that colour blind members are included, bearish signals
will be noted with blue and bullish signals with yellow.
Breadth should be read as a leading indicator.
There is now a cluster of bullish signals from the AD line. This supports the main Elliott wave count.
VOLATILITY – INVERTED VIX CHART
WEEKLY CHART
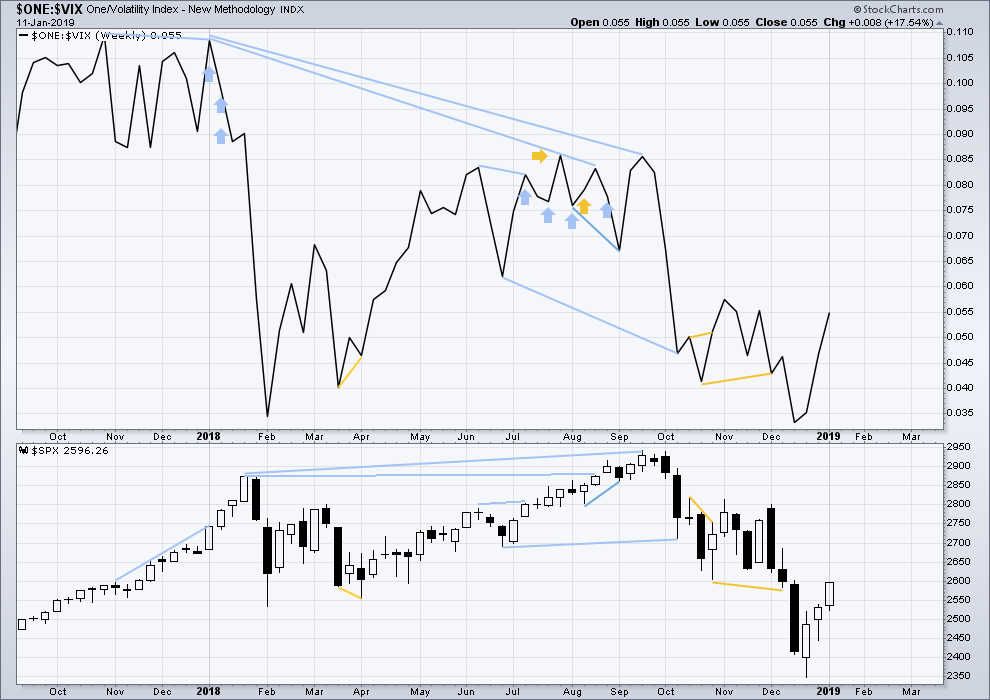
Click chart to enlarge. Chart courtesy of StockCharts.com. So that colour blind members are included, bearish signals
will be noted with blue and bullish signals with yellow.
Upwards movement has support from a corresponding decline in VIX. There is no divergence.
DAILY CHART
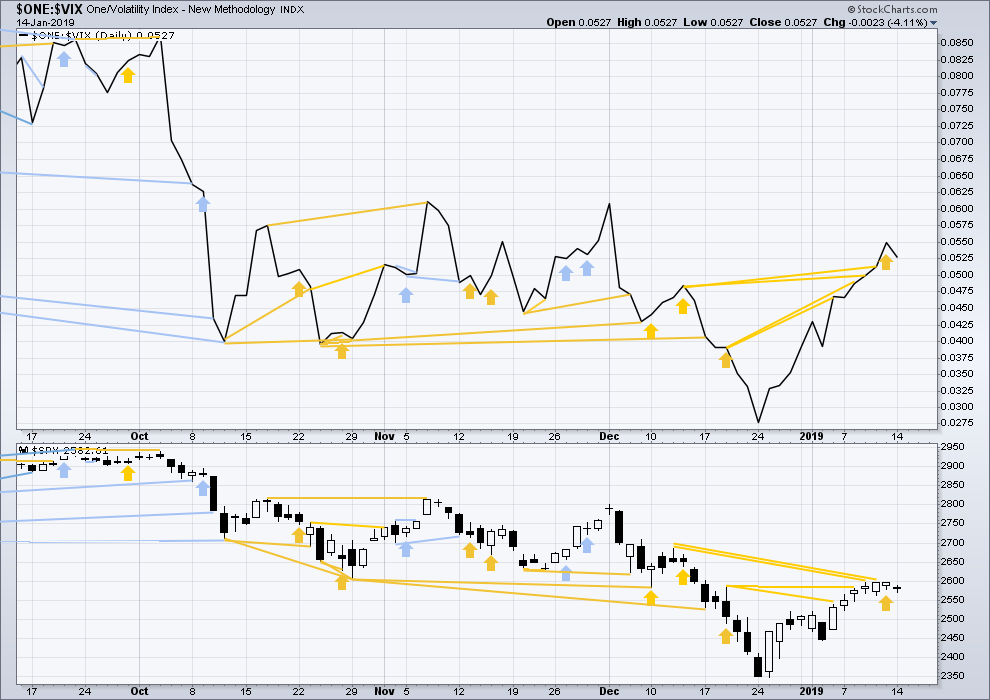
Click chart to enlarge. Chart courtesy of StockCharts.com. So that colour blind members are included, bearish signals
will be noted with blue and bullish signals with yellow.
There is now a cluster of bullish signals from inverted VIX. This supports the main Elliott wave count.
DOW THEORY
Dow Theory confirms a bear market. This does not necessarily mean a bear market at Grand Super Cycle degree though; Dow Theory makes no comment on Elliott wave counts. On the 25th of August 2015 Dow Theory also confirmed a bear market. The Elliott wave count sees that as part of cycle wave II. After Dow Theory confirmation of a bear market in August 2015, price went on to make new all time highs and the bull market continued.
DJIA: 23,344.52 – a close on the 19th of December at 23,284.97 confirms a bear market.
DJT: 9,806.79 – price has closed below this point on the 13th of December.
S&P500: 2,532.69 – a close on the 19th of December at 2,506.96 provides support to a bear market conclusion.
Nasdaq: 6,630.67 – a close on the 19th of December at 6,618.86 provides support to a bear market conclusion.
Published @ 12:35 a.m. EST on January 15, 2019.
—
Careful risk management protects your trading account(s).
Follow my two Golden Rules:
1. Always trade with stops.
2. Risk only 1-5% of equity on any one trade.

RUT daily. Price stuck now for days under the 62% and 38% at 1445 and 1450.
If RUT shoves up through that…then it should be off to the races, and I’ll be bullish for a bit in general (SPX and NDX will be rising too). If on the other hand RUT turns here…time to play the dark side for a bit more size, I think.
Good morning everybody 🙂
It looks like the small triangle for minor 4 may be over.
So that minor 3 is not the shortest actionary wave, minor 5 is limited to no longer than equality in length with minor 3.
The invalidation point may be moved up to the start of minor 5.
Anybody?
That’s how I’m labelling it
Then it looks like we may have just gotten our iv
And in which case, this overall minor 5 may finish up around 2638-2643.
But careful…the high today is (on my chart anyway) a perfect hit on the big descending channel line. The alternate bear count is not dead yet.
Vix and vxx seem to be at the beginnings of finding short term
Bottoms
I agree that all long positions need to be watched closely, but I just don’t see a short play here at all. Since January 8th, the market had its chances to make a correction, and the bears could not make lower lows…
We just back tested the upper Minor 4 b-d trend line, and bounced sharply higher… looks like we’re going to your targets Kevin, which coincide well with my targets of SPY 263-265ish…
Instantly, I agree. I think it’s wise to keep on eye on the immediate future situation though. But yes, I’ll be taking tactical longs here now on strength, looking to that next batch of fibo’s as a likely profit taking spot.
Can yesterday’s low until yesterday’s high be considered a leading diagonal?
No idea; don’t know why that would be important, anyway.
One thing to keep in mind: ALL the conditions required for a complete intermediate 1 up are now in place! Yes, it would be a tiny minor 5…but it is SUFFICIENT, and a intermediate 2 down could start up any time now. And an intermediate 2 down is likely to be a slamming move, down to 2440 area quite possibly (and deeper is possible too). Careful on the long side…though I will say, “more minor 5 up” is probably more likely. But by no means is more up here certain.
Closed all vxx shorts
Wouldn’t touch anything long here or hold any longs without hedging
Russell not really participating
Looks stalled
SPX tagged the 78.6% and the descending channel line. I took an intraday tactical short in SPX (after working the long side in SPY, QQQ and IWM options profitably through the morning so far).
Kevin, I know you’ve been mentioning the 2613 level now for some time, and currently it does look like it has turned at this level… what is your short target for this short trade? You think it will close out today’s gap open, or you’re thinking lower?
I don’t know Ari. I never know. But 2603 is the first retrace fibo level (23.6%) and the first of the “more likely” turn price areas. After that…2697 (38%), etc.
And it could just turn in mid-air here and press higher, i.e., the turn at the 78.6% wasn’t “real”.
Thanks Kevin, just curious what your targets were. It seems like you’re not looking for the market to go down too much from here…
I’m actually looking to enter a long position, and that’s why I was asking…
If you are seeing and feeling long
2597 first toe
But after the way they have crushed the vix futures
I’d be careful
I might take some short term tactical longs here on renewed strength (tomorrow), but…I just don’t think it’s going far! I think the play going forward is to catch a big bite of the intermediate 2 down (or…whatever the alternative bear count wave down would be) that should be coming within a few days at most. That I2 is likely to be fearsome.
I plan to be short on strength from here before 1-19
Selling upside calls in nflx and tsla for Friday
With intention to go short if I get assigned
Will also break a longtime rule of selling vol puts on any punches below 18
Will also have some near money call spreads in vxx in place for 1-19
But am waiting till the next rise
Citi released their Q4 earnings yesterday. Their trading desk results were down 14% in Q4. Today they are gap up 10% from yesterday’s open.
I am changing my timeframe for this trade. Still think that ES 2860 is the golden target. I have been rethinking the potential timeline. New estimate is about two weeks from now on the 29th of January.
Here’s how I’m looking at this.
The algorithm that is running the program has brought us down to the low (shown by the left arrow) then brought us to what was supposed to be intermediate point (4) and then broke us out of the trend channel with a move upwards (shown by the right arrow).
Here was point (4) and the first move down into the 5th intermediate wave.
Here is the breakout shown on a log chart using Heikin-Ashi
And here is the breakout shown on the same chart using Candlesticks. I include this chart to show that the breakout close was printed outside of the trend channel.
What I think is going on is that the Algorithm has shifted modes. It was working in “intermediate 4th / 5th wave” mode but when the breakout occurred there was a change into a longer duration mode. I think it is using an inverse pattern. It’s doing a mirror image up (right arrow) of the downwards move (left arrow). All the criteria are working the same, but in the opposite direction. They haven’t written a separate algorithm for the reversal. They’re using a flip switch.
Here is the first part of the moves
Here is the sideways part of the moves
Here is the final stage of the move down and the projected final stage up to target
Hey chartmonkey it looks like i was wrong about a complete ABC up from Christmas. However it looks like it may have just completed.
Even with the main…an intermediate 2 down is right around the corner! Careful with that axe Eugene.
looks like minor 5 time. however, 5’s don’t have to go beyond the top of the 3, so we aren’t even certain here to eliminate the alternate bear count before the intermediate 2 down kicks in. The market seems to love dishing out maximal uncertainty!
lay of the land overhead. 78.6% at 2613, then overlapped fibo’s in the 2636-2643 price area. Then 100% at 2686, then overlaps again at 2712-14.
The hourly SPX squeeze has not yet turned off…
Covering a large section of my vol shorts
Selling otm call spreads in nflx
Selling otm call spreads in tsla
Both short term.. this week
Will buy the put spreads on further strength
See the top at 2615-31 on s and p