Price is still range bound, completing an inside day. The breakout is now expected to come tomorrow.
Summary: The main and alternate wave counts are swapped over today on weight of a downwards breakout by On Balance Volume. The new main wave count expects that price is in a primary degree pullback, which is incomplete. The target at this stage is 2,316 and may be met in another four days.
New updates to this analysis are in bold.
Last monthly and weekly charts are here. Last historic analysis video is here.
MAIN ELLIOTT WAVE COUNT
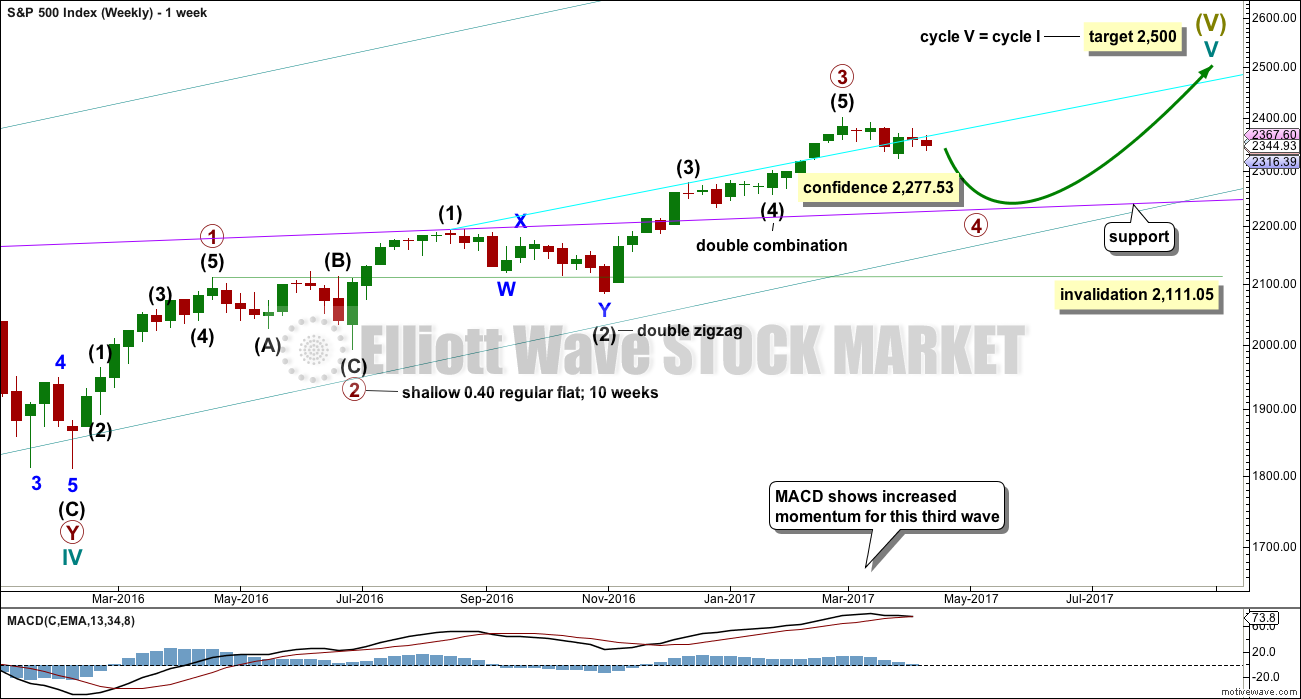
WEEKLY CHART
The degree of labelling within primary wave 3 is here moved up. It is possible that primary wave 3 may be over.
Primary wave 4 may continue lower.
To exhibit alternation with primary wave 2, primary wave 4 may be most likely a single or multiple zigzag. It may also be a triangle.
Primary wave 2 was a flat correction lasting 47 days (not a Fibonacci number). Primary wave 4 may be unfolding as a double zigzag. It may total a Fibonacci 34 or 55 sessions. If it totals a Fibonacci 34 sessions, it may end next Friday.
Primary wave 4 may not move into primary wave 1 price territory below 2,111.05.
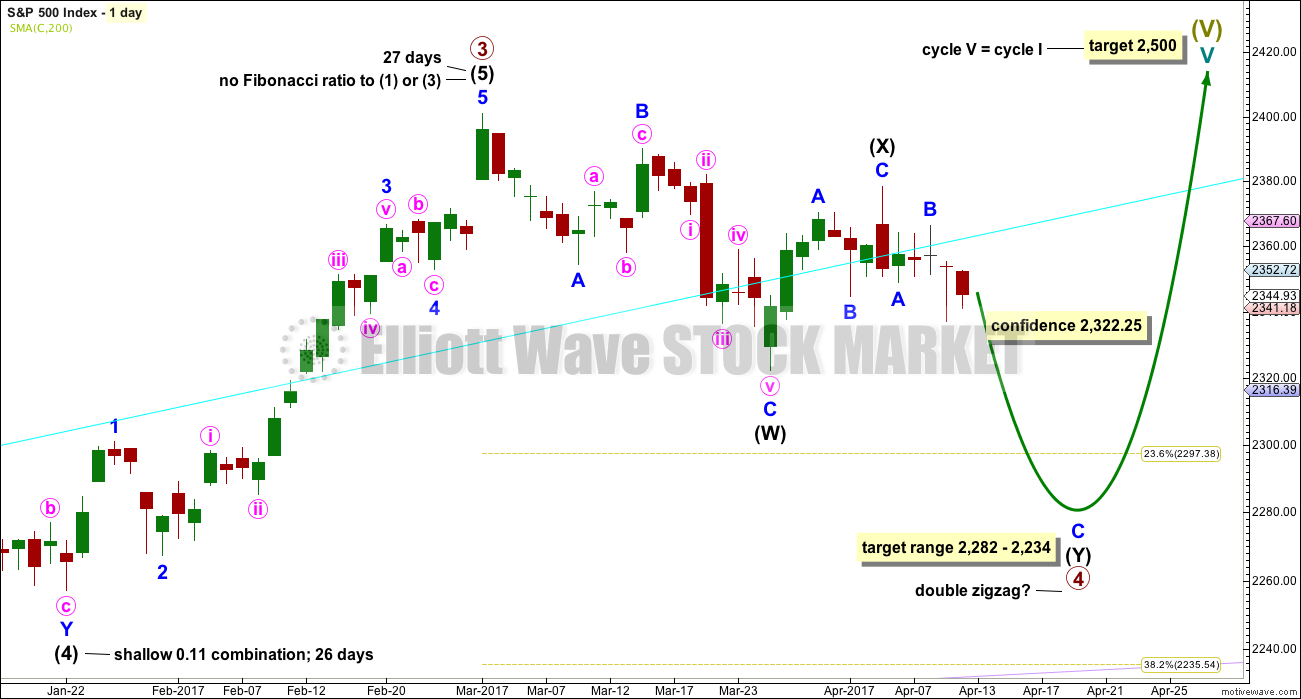
DAILY CHART
Within double zigzags, the X wave is almost always brief and shallow. There is no rule stating a maximum for X waves, but they should not make a new price extreme beyond the start of the first zigzag in the double.
X waves within combinations may make new price extremes (they may be equivalent to B waves within expanded flats), but in this instance primary wave 4 would be unlikely to be a combination as it would exhibit poor alternation with the flat correction of primary wave 2.
For this wave count intermediate wave (X) may now be complete.
If a new high above 2,400.98 is seen, then this wave count would be discarded.
The correction for primary wave 4 should be a multi week pullback, and it may not move into primary wave 1 price territory below 2,111.05.
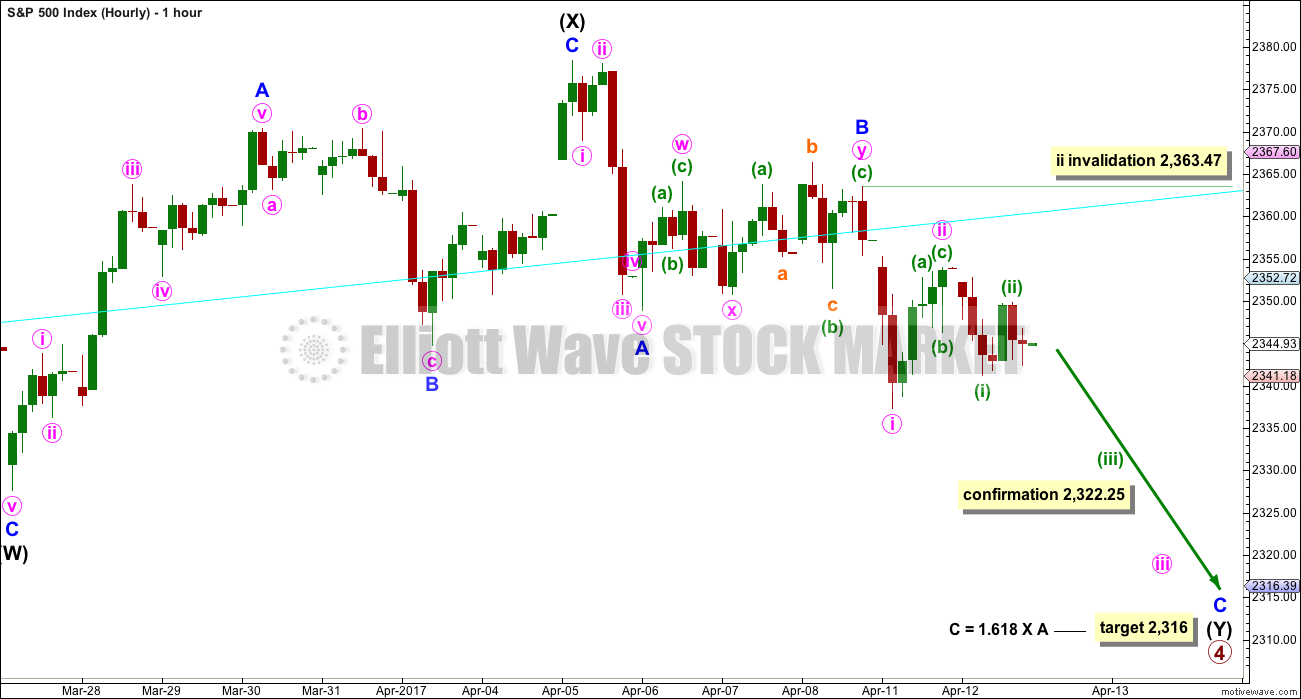
HOURLY CHART
The second zigzag in the double may be underway. Within the zigzag, a target is calculated for minor wave C to end which is just below the expected range for intermediate wave (4).
Minor wave C must subdivide as a five wave structure. If it begins at 2,363.47 (assuming my analysis of minor wave B is correct), then minute wave ii may not move above this point.
At this stage, this wave count now expects to see an increase in downwards momentum tomorrow as the middle of a small third wave unfolds lower.
ALTERNATE ELLIOTT WAVE COUNT
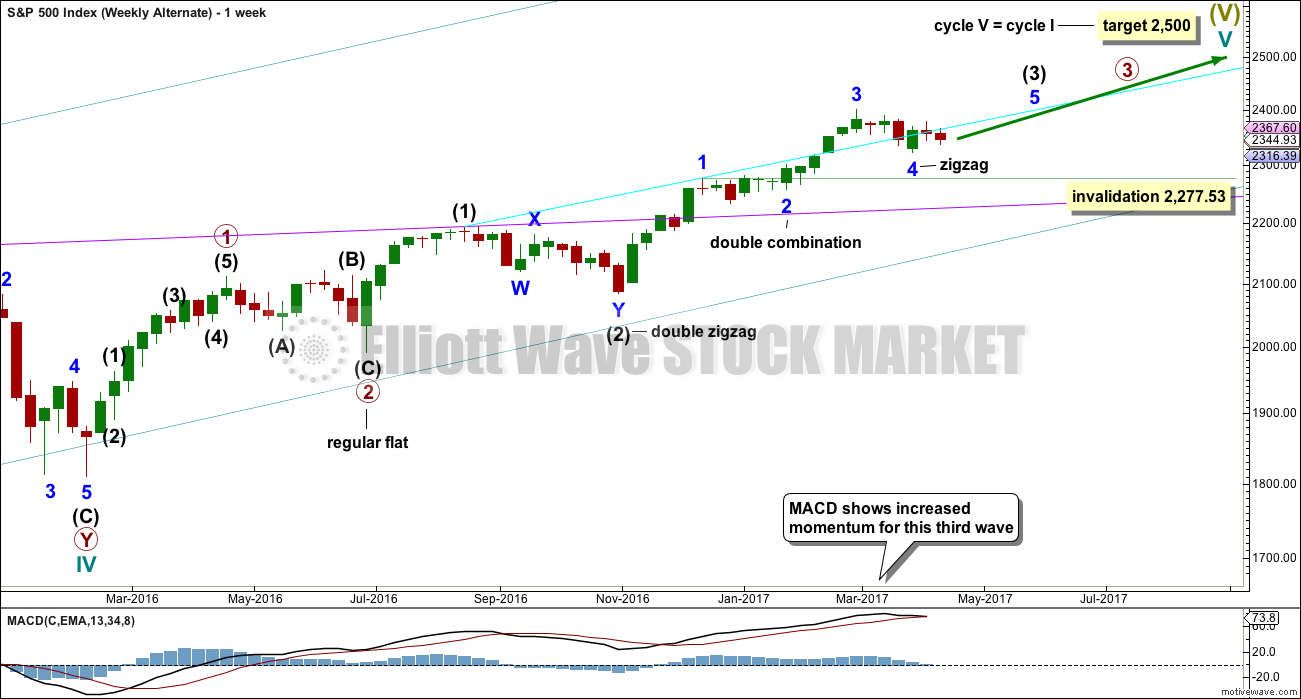
WEEKLY CHART
Cycle wave V is an incomplete structure. Within cycle wave V, primary wave 3 may be incomplete.
Within primary wave 3, intermediate wave (3) may be an incomplete impulse.
Within intermediate wave (3), if minor wave 4 continues, then it may not move into minor wave 1 price territory below 2,277.53.
DAILY CHART
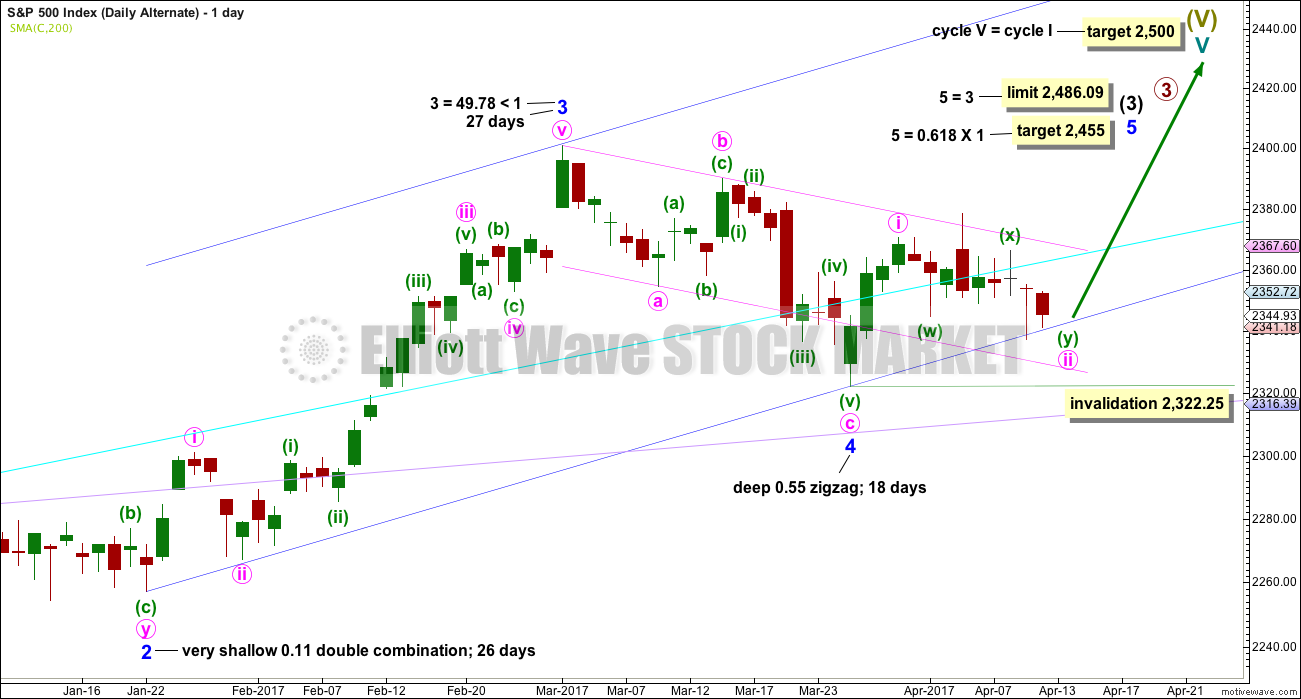
This wave count expects the just completed correction is minor wave 4. Within minor wave 5, minute wave ii may not move beyond the start of minute wave i below 2,322.25.
Minor wave 4 is a little below the fourth wave of one lesser degree. Because it has now clearly breached an Elliott channel drawn using the first technique, the channel is now redrawn using Elliott’s second technique. There is good alternation between the very shallow combination of minor wave 2 and the deeper zigzag of minor wave 4.
A target for minor wave 5 is calculated.
The Elliott channel about minor wave 4 is drawn on the daily chart. The upper edge may be providing some resistance. Once price can break above this channel, then upwards momentum may build.
Minor wave 3 is shorter than minor wave 1. So that the core Elliott wave rule stating a third wave may not be the shortest is met, minor wave 5 is limited to no longer than equality in length with minor wave 3.
HOURLY CHART
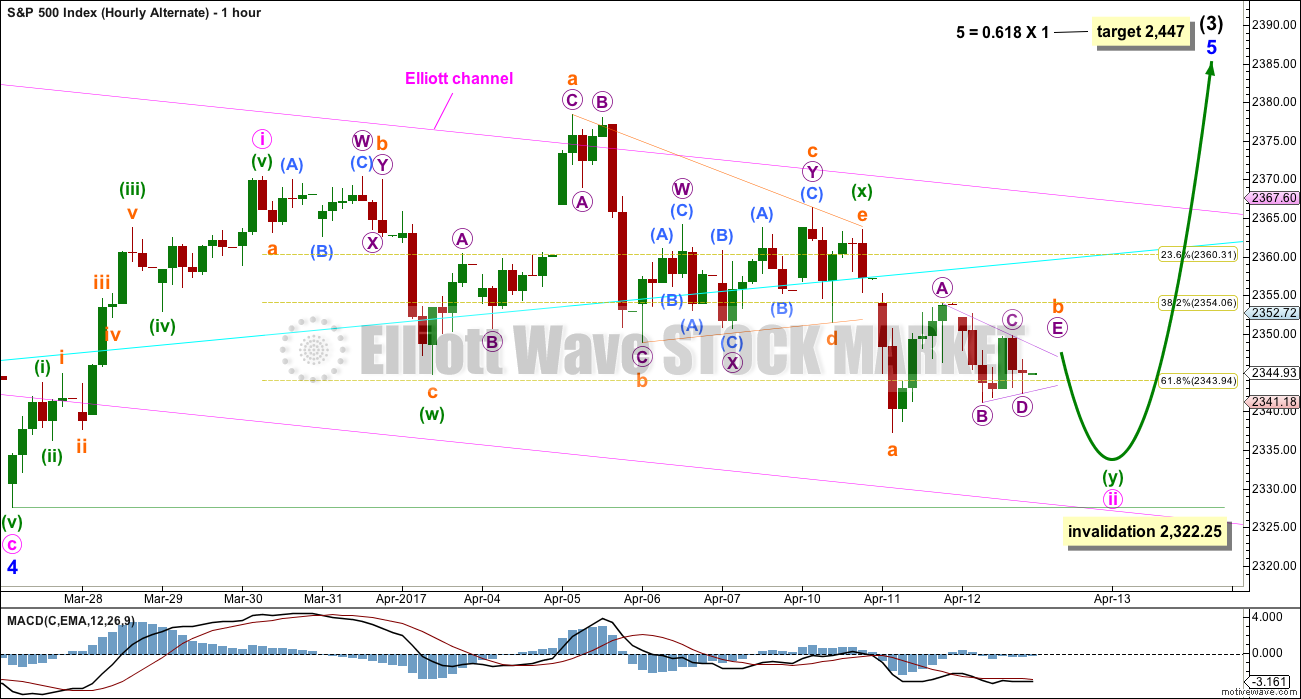
Minute wave ii may be an incomplete double zigzag, with minuette wave (x) now a completed running contracting triangle. While part of the triangle makes a new price extreme beyond the start of minuette wave (w), at its end the triangle effects a 0.73 retracement of minuette wave (w). This is not a typical look for an X wave within a double zigzag as they are more often brief and shallow.
Minute wave ii may continue sideways as a double combination. Minuette wave (y) may be a flat correction.
The first target for minute wave ii has been met and slightly exceeded. A new target cannot yet be calculated until subminuette wave b within the zigzag of minuette wave (y) is complete. Then the ratio between submineutte waves a and c may be used to calculate a target.
It is possible that subminuette wave b may make a new high above the start of subminuette wave a at 2,363.47 if minuette wave (y) unfolds as a flat correction and minute wave ii unfolds as a combination. Although subminuette wave b is labelled today as a triangle, it may still morph into a combination or flat correction.
Minute wave ii may find strong support at the lower edge of the pink Elliott channel copied over from the daily chart, if it moves below the target.
Minute wave ii may not move beyond the start of minute wave i below 2,322.25.
Essentially, this wave count expects a continuation of the consolidation for another one to few days, then an upwards breakout.
TECHNICAL ANALYSIS
WEEKLY CHART
Click chart to enlarge. Chart courtesy of StockCharts.com.
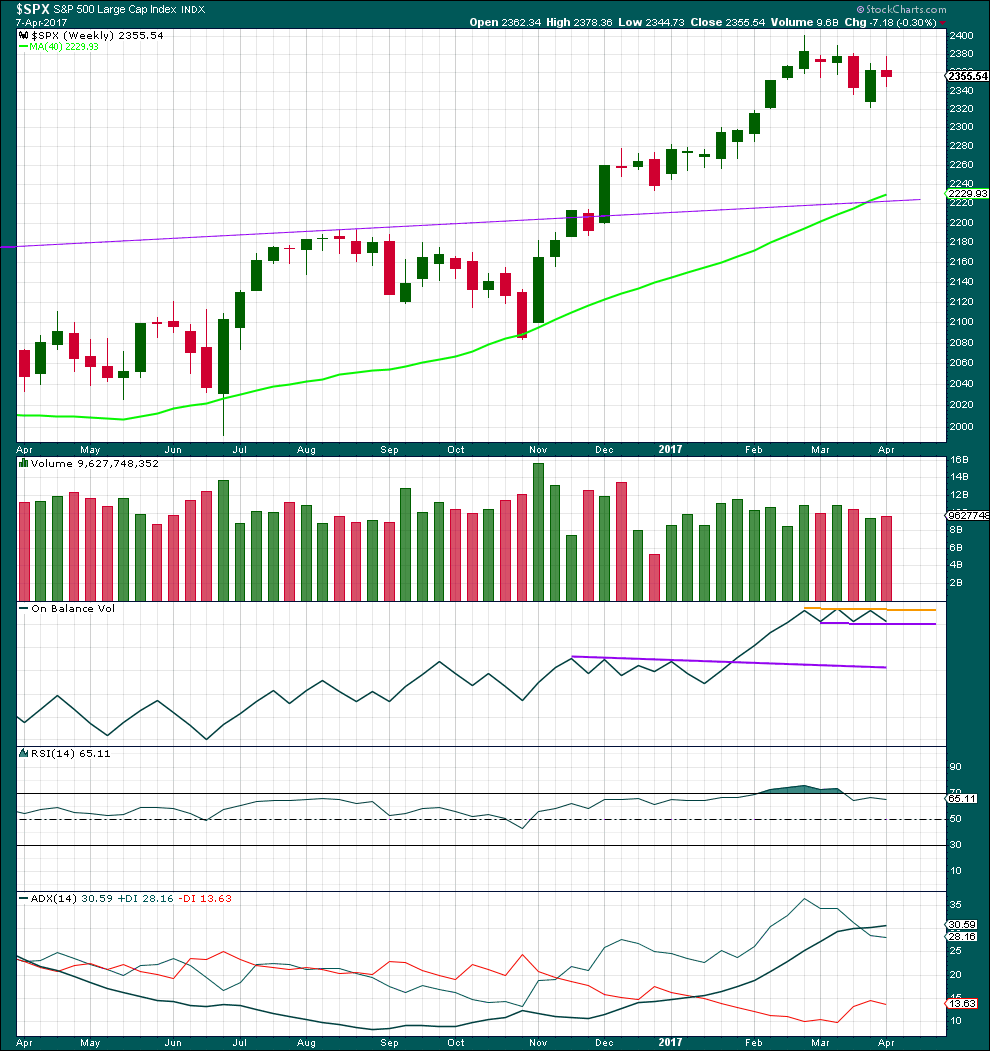
Last week completes an upwards week with a higher high and a higher low, but the week closed red and the balance of volume was down. With some increase in volume last week, the support for downwards movement during the week is bearish.
On Balance Volume remains tightly constrained, not yet offering a signal.
ADX remains extreme. This is most often followed by three or four downwards weeks, but not always. This favours the alternate daily wave count.
DAILY CHART
Click chart to enlarge. Chart courtesy of StockCharts.com.
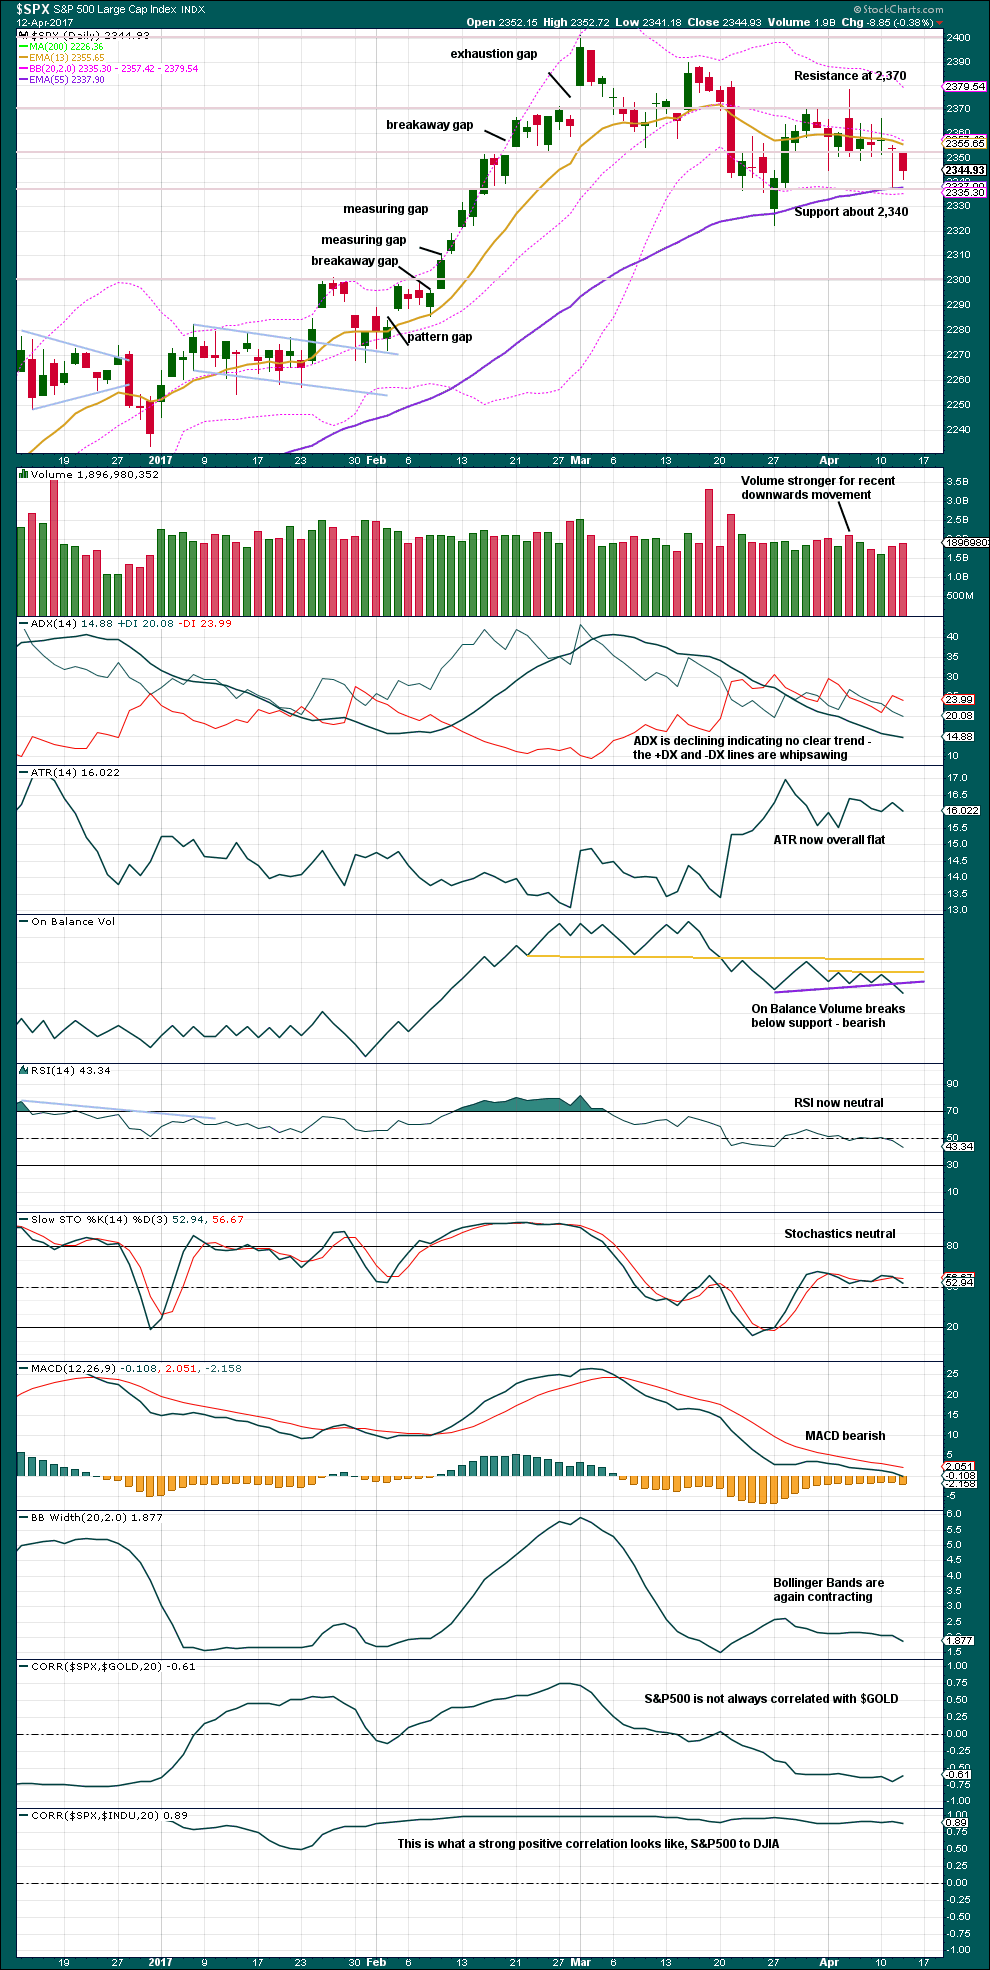
Two days in a row of red daily candlesticks comes with an increase in volume. Downwards movement during Wednesday’s session has support from volume. This is bearish.
ADX, ATR and Bollinger Bands are all neutral. They all point to a consolidating market.
On Balance Volume today gives a bearish signal with a break below support.
VOLATILITY – INVERTED VIX CHART
Click chart to enlarge. Chart courtesy of StockCharts.com.
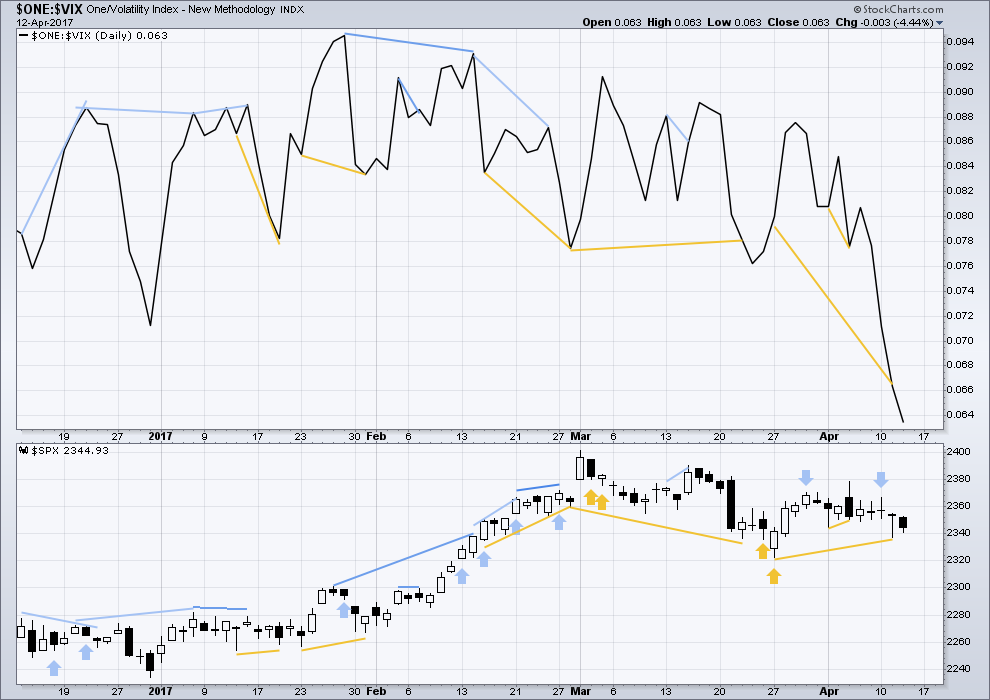
Normally, volatility should decline as price moves higher and increase as price moves lower. This means that normally inverted VIX should move in the same direction as price.
Bearish divergence and bullish divergence spanning a few short days used to be a fairly reliable indicator of the next one or two days direction for price; normally, bearish divergence would be followed by one or two days of downwards movement and vice versa for bullish divergence.
However, what once worked does not necessarily have to continue to work. Markets and market conditions change. We have to be flexible and change with them.
Recent unusual, and sometimes very strong, single day divergence between price and inverted VIX is noted with arrows on the price chart. Members can see that this is not always proving useful in predicting the next direction for price.
Divergence will continue to be noted, particularly when it is strong, but at this time it will be given little weight in this analysis. If it proves to again begin to work fairly consistently, then it will again be given weight.
The strong single day bearish divergence noted two days ago from VIX has now been followed by two downwards days. This divergence may now be resolved.
There is still mid term bullish divergence between price and inverted VIX: inverted VIX has made a strong new low below the low of 27th of March, but price has failed to make a corresponding new low. This indicates weakness in price. So far this divergence has not correctly predicted the next direction for price.
BREADTH – AD LINE
Click chart to enlarge. Chart courtesy of StockCharts.com.
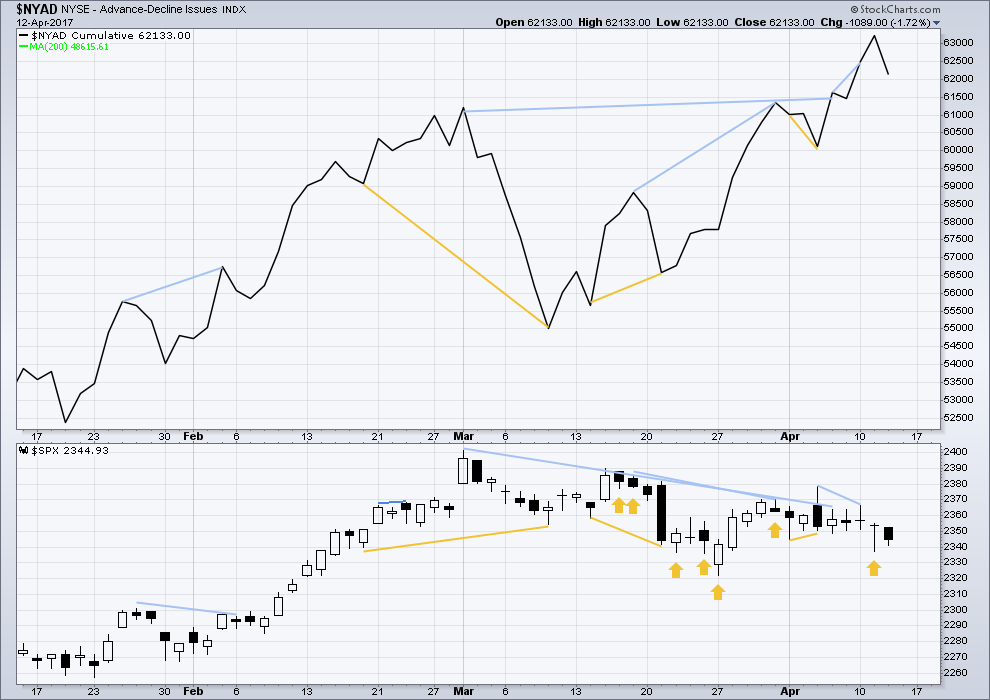
The rise in price has support from a rise in market breadth. Lowry’s measures of market breadth do not at this stage warn of an impending end to this bull market. They show an internally healthy bull market that should continue for at least 4-6 months.
Bearish divergence noted two days ago between price and the AD line has now been followed by two days of downwards movement. It may be resolved here.
Yesterday’s strong single day bullish divergence with price has not been followed by upwards movement. Price moved lower during today’s session.
DOW THEORY
The DJIA, DJT, S&P500 and Nasdaq continue to make new all time highs. This confirms a bull market continues.
This analysis is published @ 11:23 p.m. EST.

Updated main hourly chart:
The third wave has to complete. The middle may have passed. Nice alternation between subminuette wave ii expanded flat and subminuette iv zigzag.
A note for those using Motive Wave: it’s rules will tell you that there’s something wrong with a fourth wave overlapping second wave price territory. I have no idea where they get that idea from, the rule is very clear. Wave 4 may not overlap wave 1 price territory. The rule says nothing about wave 2. I really wish they’d fix that. I have contacted them, but they hold to this one. So when I get that situation I control click on the wave and in preferences, ignore issues.
Hi Lara. I’m a new subscriber. Long time EW chartist. I’m not sure whether the Feb high was (3) rather than Primary 3. What are your thoughts on this?
Thanks
Sorry. Not Feb high. Mar 01 high @ 2400.98
The third wave wouldn’t fit well as an impulse. On the weekly chart this is what it would look like.
Looks like price action ended today with a 3,3,5 upward flat for a fourth wave followed by a final fifth wave down into the close. Sneaky!
The banksters are still firmly in charge…for now…I expect manic futures on Sunday evening…
Took out 2332.
Yay! That makes the situation clearer. Less charts too 🙂
I like it when alternates get invalidated. It gives a bit more confidence to the main wave count.
Wait, 2322 is invalidation for the alternate, not 2332? This looks like a textbook setup for the alternate *if* there is big move up Monday…thoughts?
Sorry, the invalidation for the alternate is 2,322.25.
The low for Thursday is 2,328.95.
Both wave counts remain valid.
Northy’s April Macro charts – worth a look.
“we remain in a late market cycle setting up for the next recession.”
https://northmantrader.com/2017/04/12/april-macro-charts/
We could be done people. We have a five wave impulse off the recent low so that may be all she wrote for this fourth wave. Have a great week-end everyone!
Bye Verne, have a fab Easter 🙂
Thank you m’lady…you as well! 🙂
I think we are in the D wave up of a triangle with another E wave done to conclude this correction and it will be over by the close. Not what I was expecting but price is what it is.
I can see a small third wave done… and the triangle done too
If you have to ask if it is a third wave, it’s not folk.
I am starting to think we may not get as deep a pullback as originally anticipated.
The triangle is continuing and may end with a short spike down followed by an immediate reversal to the upside. I simply cannot see this as part of a continuing b wave. Time for caution on short trades methinks…
A strong VIX upside reversal would change my mind…
Surprise, surprise! Award winning journalist Robert Parry is reporting that Syrian chemical attack came from a Saudi-Israeli base in Jordan and was delivered by a drone.
Trump’s natiional security team lied to him and iinduced him to violate the 6th commandment…
I guess we’ll be bombing Saudi Arabia now? Sarc.
That bunch of snakes on Trump’s national security team knew exactly who was responsible. Everyone is commenting on the conspicuous absence of CIA and DNI directors Mike Pompeo and Dan Coats from the group watching the missile strikes. This makes me think that Trump knew the entire thing was a damnable lie and I no longer trust the man.
Verne,
I am glad you have finally come to that conclusion. Remember he is in this to enrich his family. Pure and simple. He knew what people wanted to hear to get elected and he did that. Sooner or later as his ratings go lower, he will take us to war. Because a war president is never questioned and boost ratings. 80 days into his 100 day agenda and we have nothing to show for. Plus now he wants lower dollar, lower interest rates and on and on.
Won’t get fooled again…!
“Meet the new boss…
Same as the old boss…”
https://www.youtube.com/watch?v=zYMD_W_r3Fg
A lot of the pieces are starting to come together as I dig into this story. Apparently there is a cabal that has a vested interest in building a pipeline across Syria to deliver gas supplies to Europe, and displace Russia as their main supplier. They cannot do that with Assad in place and certainly not while he is under Putin’s protection. Follow the money folk.
Definitely all about the pipeline.
Step right up and place your bets ladies and gents!
How many suckers are going to take the bankster bait?! 🙂
The banksters are really starting to get a little bit ridiculous…come on now….a red print from VIX??!!
It’s not even 9.00 a.m., much less 10.00!! 😀
will add vix today with stop of 14 and tgt 17.5 by early next week.
It is going to at least 20 dude! 🙂
awesome 🙂
breakaway gap from triangle filled by banksters…….shockingly un-surprised. I really look forward to them getting blown out.
Reminds me of what the diaper said to the baby:
Diaper: “I got you covered!”
Baby: “You’re full of SH_T!”
That’s epic, mind if I borrow? 🙂
Be my guest! 🙂
This should be a third wave down today. The lomger the banksters muck around trying to arrest it the harder and faster it will eventually fall. I won’t be surprised to see the mucking continue until just before the close…mind the gap! 😉
Two or three times a year an opportunity comes along that gives the average trader a huge advantage over the market makers. Those of you who have been on Lara’s site awhile know exactly what I am talking about. The trade executed conservatively gives you and easy 100% return and arguably you could make just that trade every time it sets up, do nothing else and do quite well. I am of course referring to the volatility trade. In the past I have posted details about how I make the trade and what set-ups and signals I use so I won’t bore folk with a repeat of that. I have been hinting recently about it as well. I am not in the habit of telling people how or what to trade but this one is such a no-brainer every now and then I like to point out when even a novice can execute it safely. The easiest thing to look at is the way it is trading around its 200 dma. When it crosses to the upside you can expect a great opportunity to short VIX in a few days to a few weeks at most. The signal I look for is a second close below its upper BB accompanied by a long upper wick on that or the previous close. That’s it. This “bread and butter” trade should be in every trader/investor’s arsenal but you won’t read about it in any trading manuals. There are ways to tweak it to take advantage of the upside move as well but I am going to keep it safe and simple. Now go munch on a few market makers! 🙂
Thank you very much Verne for your generosity in sharing this 🙂
I can trade VIX futures, but I’ve never traded futures. The time component worries me. It’s hard enough figuring out price, let alone time.
Hi Lara,
In above first daily chart, The target of Wave C/Y/4 is 2282~2234. But in the first hourly chart, the target of Wave C/Y/4 is 2316. Any idea for the big difference?
Thanks.
Sorry, yeah, I know that probably doesn’t make so much sense.
I should really remove that target range on the main daily chart.
The target calculated for the hourly chart, 2,316, has a better probability as it’s based upon a ratio between A and C for the second zigzag.