Price moved a little lower before bouncing upwards to close green at the end of the session.
Summary: It is still fairly likely that a low is in place. There is further divergence today with price and the AD line, and price seems to be congested at multiple support lines. If this view is correct, then expect the next wave up to new all time highs with a target at 2,456.
It is possible that a deeper correction may continue here for another few weeks while price remains below 2,377.18, as per the alternate wave count. This alternate today illustrates the risk to entering long positions here, which may be premature.
New updates to this analysis are in bold.
Last monthly and weekly charts are here. Last historic analysis video is here.
MAIN ELLIOTT WAVE COUNT
WEEKLY CHART
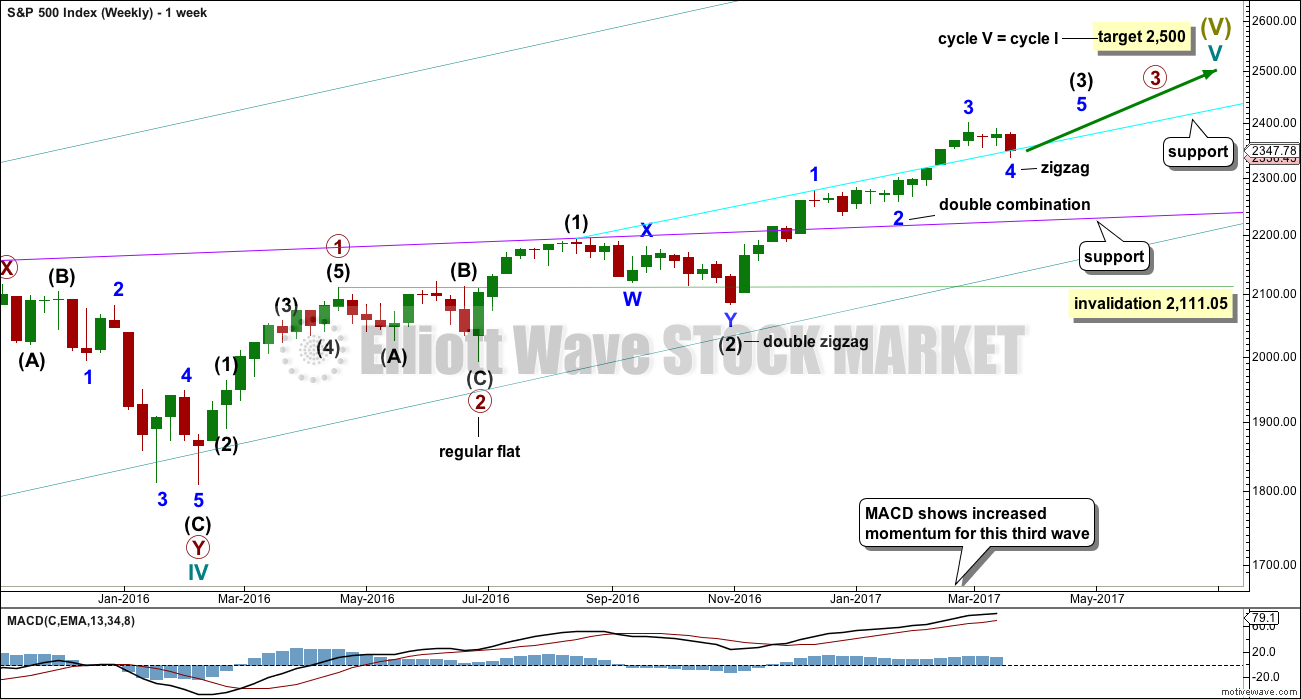
Cycle wave V is an incomplete structure. Within cycle wave V, primary wave 3 may be incomplete or it may be complete (alternate wave count below).
Primary wave 4 may not move into primary wave 1 price territory below 2,111.05.
As price moves lower look for support at each of the longer term trend lines drawn here across previous all time highs. The cyan trend line may provide support. (The trend line has been copied over to hourly charts.) The cyan line is drawn from the prior all time highs of 16th August, 2016, at 2,193.81, to 13th December, 2016, at 2,277.53. Weekly and daily charts are on a semi-log scale. If price keeps falling here, then look for next support about the lilac line. The lilac line is drawn from the prior all time highs of 20th July, 2015, at 2,132.82, to 15th August, 2016, at 2,193.81.
DAILY CHART
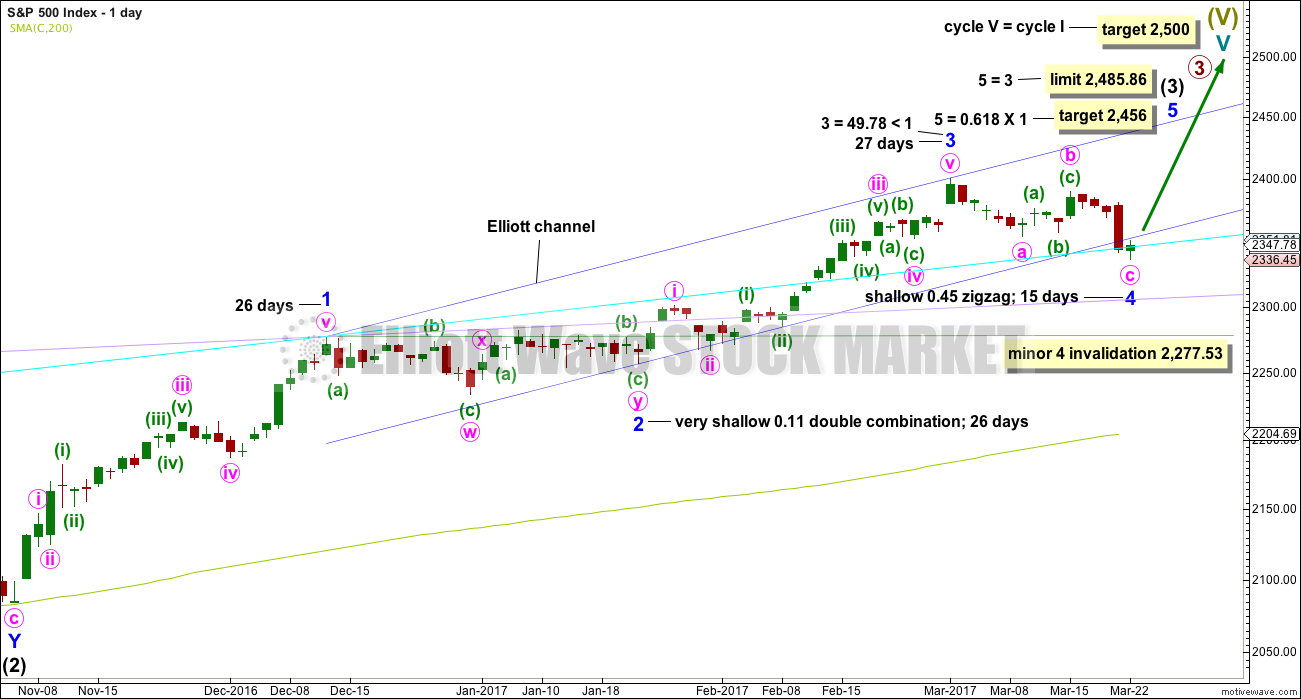
All subdivisions are seen in exactly the same way for both daily wave counts, only here the degree of labelling within intermediate wave (3) is moved down one degree.
This wave count expects the current correction is minor wave 4, which may not move into minor wave 1 price territory below 2,277.53. A new low below this point would confirm the correction could not be minor wave 4 and that would provide confidence it should be primary wave 4.
Minor wave 4 is a little below the fourth wave of one lesser degree and may have ended today with a small overshoot of the blue Elliott channel and finding support about the cyan trend line. There is good alternation between the very shallow combination of minor wave 2 and the deeper zigzag of minor wave 4.
If minor wave 4 is over, then a target for minor wave 5 is calculated.
Minor wave 3 is shorter than minor wave 1. So that the core Elliott wave rule stating a third wave may not be the shortest is met, minor wave 5 is limited to no longer than equality in length with minor wave 3.
HOURLY CHART
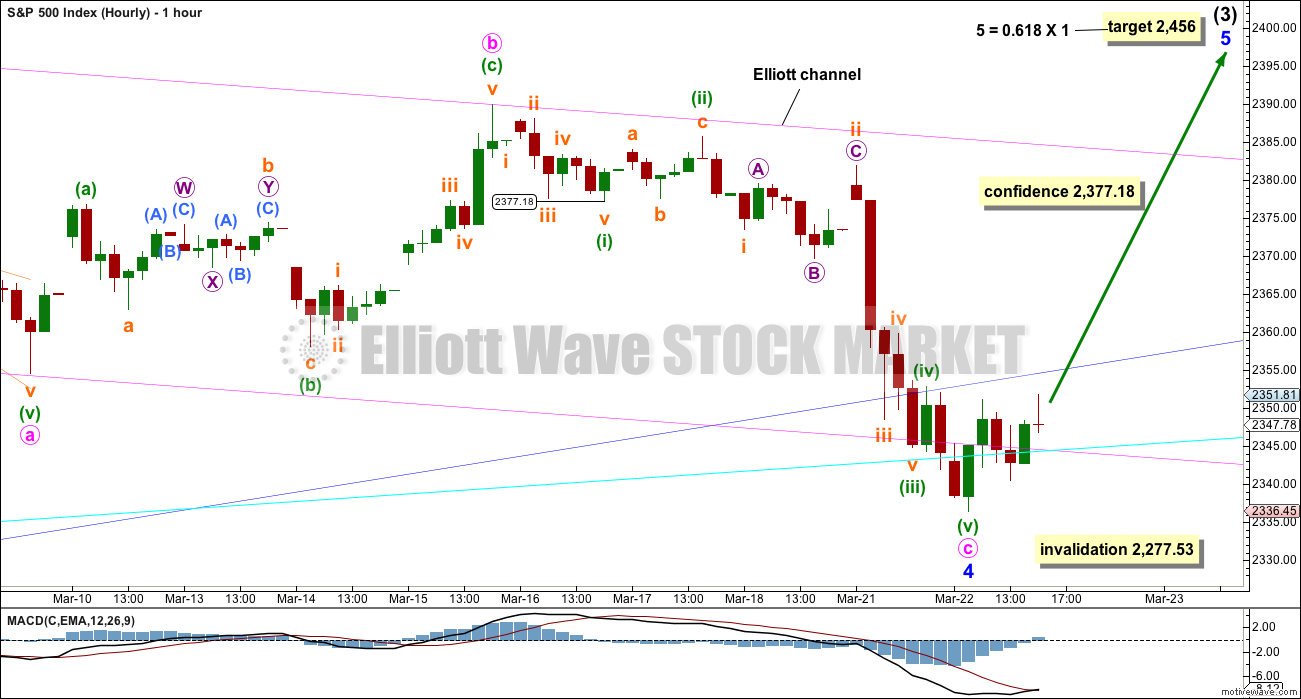
Minor wave 4 may now be seen as a complete structure. The impulse of minute wave c may be complete.
Within minute wave c, if the correction for minuette wave (iv) is time consuming and moves sideways, then it may not move into minuette wave (i) price territory above 2,377.18. A new high above this point would indicate the structure of minute wave c should be over, and so minor wave 4 in its entirety would be very likely then to be over.
Minor wave 4 may have ended with a small breach of the blue Elliott channel, a small overshoot of the pink Elliott channel, and a minuscule overshoot of the cyan trend line. The cyan trend line is not properly breached today.
Because of a little more downwards movement at the start of Wednesday’s session there is no longer a Fibonacci ratio between minute waves a and c.
If tomorrow prints another green daily candlestick, the probability of a low in place for minor wave 4 would increase.
ALTERNATE DAILY CHART
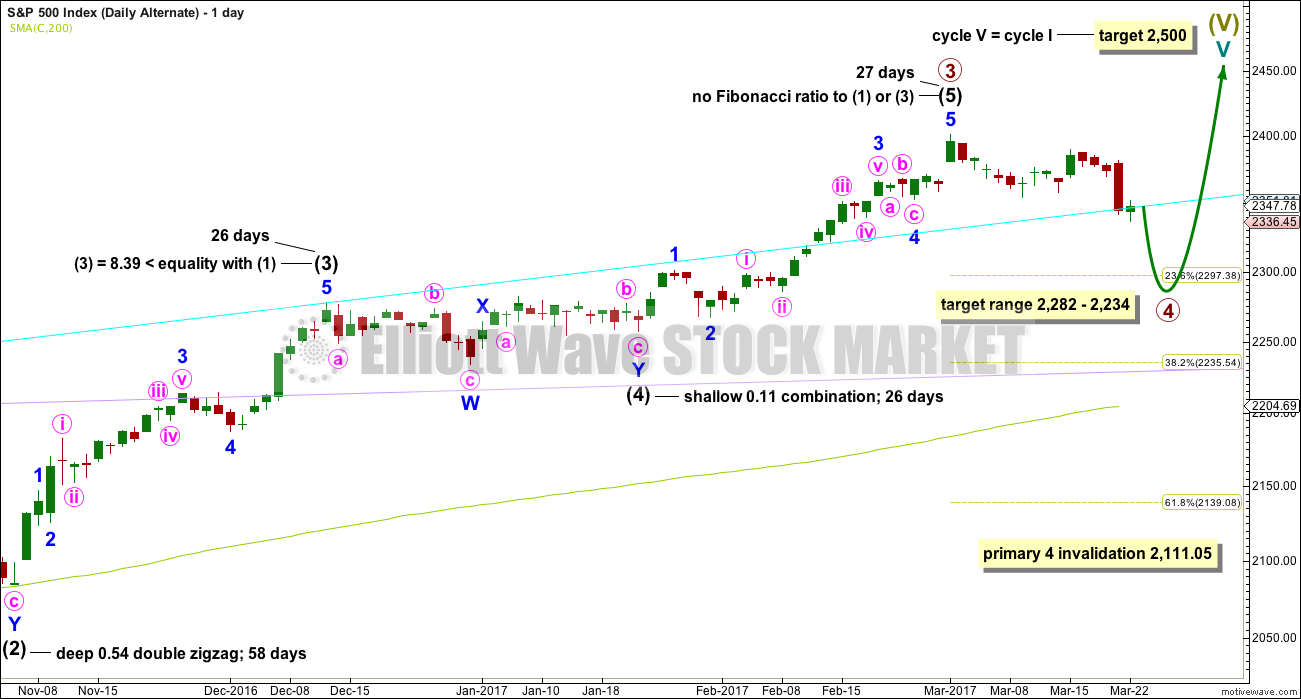
The subdivisions of upwards movement from the end of intermediate wave (2) are seen in the same way for both wave counts. The degree of labelling here is moved up one degree, so it is possible that primary wave 3 could be over.
Primary wave 2 was a flat correction lasting 47 days (not a Fibonacci number). Primary wave 4 may be expected to most likely be a zigzag, but it may also be a triangle if its structure exhibits alternation. If it is a zigzag, it may be more brief than primary wave 2, so a Fibonacci 21 sessions may be the initial expectation. If it is a triangle, then it may be a Fibonacci 34 or 55 sessions.
Intermediate wave (3) is shorter than intermediate wave (1). One of the core Elliott wave rules states a third wave may never be the shortest wave, so this limits intermediate wave (5) to no longer than equality in length with intermediate wave (3). If intermediate wave (5) is now over, then this rule is met.
Minor wave 3 has no Fibonacci ratio to minor wave 1. If minor wave 5 is now over, then it is 4.14 points longer than equality in length with minor wave 3.
Intermediate wave (5) may have ended in 27 days, just one longer than intermediate waves (3) and (4). This gives the wave count good proportions.
The proportion here between intermediate waves (2) and (4) is acceptable. There is alternation. Both are labelled W-X-Y, but double zigzags are quite different structures to double combinations.
The following correction for primary wave 4 should be a multi week pullback, and it may not move into primary wave 1 price territory below 2,111.05.
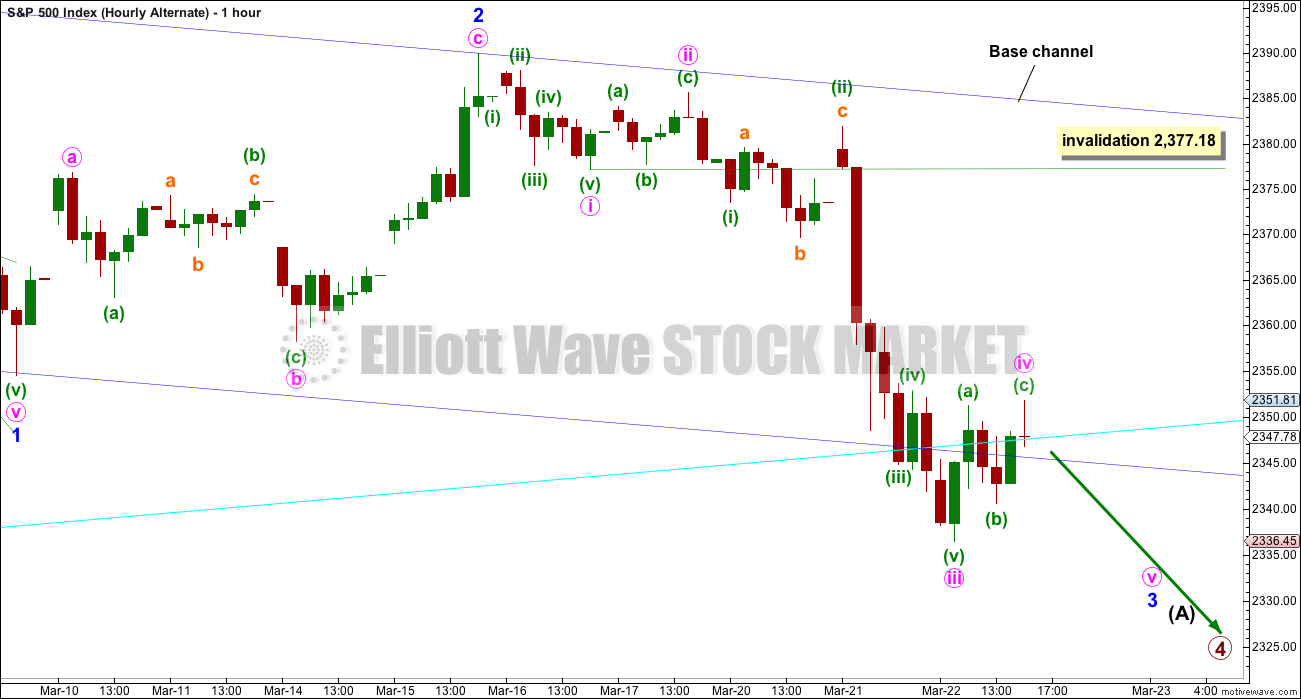
ALTERNATE HOURLY CHART
In the short to mid term, the wave counts now diverge, so it is time to publish an hourly chart for this alternate.
Primary wave 2 was a flat correction, so it is most likely that primary wave 4 would unfold as a zigzag. So far, within the zigzag, intermediate wave (A) may be an incomplete impulse.
So far minor waves 1 and 2 may be complete within intermediate wave (A). Minor wave 3 may be incomplete. If it was over at today’s low, there is hardly enough room for the following correction of minor wave 4 to unfold and remain below minor wave 1 price territory.
Within minor wave 3, the correction for minute wave iv may not move into minute wave i price territory above 2,377.18.
The blue base channel on this alternate is the same as the pink Elliott channel on the main hourly chart. For this alternate, minor wave 3 should have the power to break below the lower edge of the base channel, but it has not done that and seems to be finding strong support about this area. This reduces the probability of this wave count today.
TECHNICAL ANALYSIS
WEEKLY CHART
Click chart to enlarge. Chart courtesy of StockCharts.com.
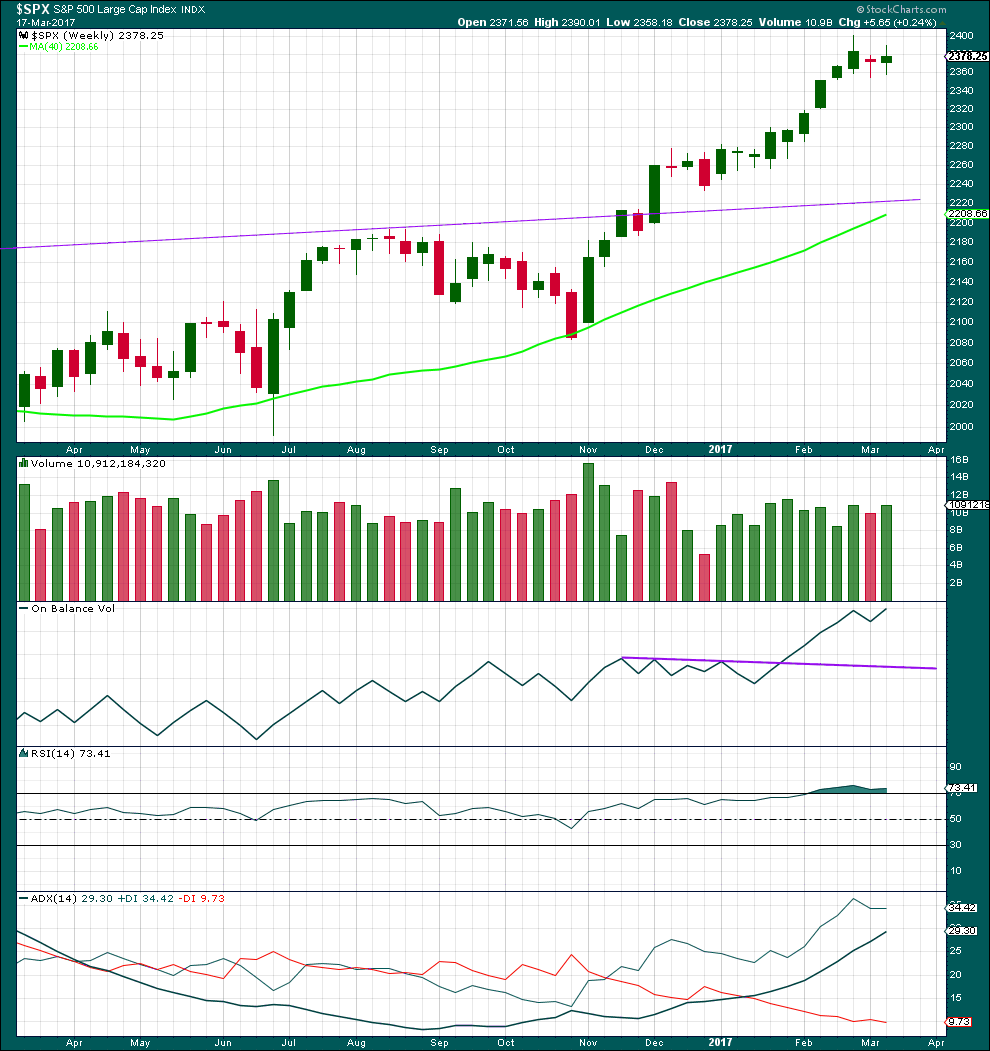
A red doji for the previous week to last week and a small real body for last week look corrective. A small correction looks to be unfolding within a larger upwards trend.
A small increase in volume last week offers some support for upwards movement, but to read this more accurately we should look inside the week at daily candlesticks.
RSI is still extreme, but it may remain so for reasonable periods of time during a trending market. ADX is not yet extreme, so there is room for this trend to continue.
DAILY CHART
Click chart to enlarge. Chart courtesy of StockCharts.com.
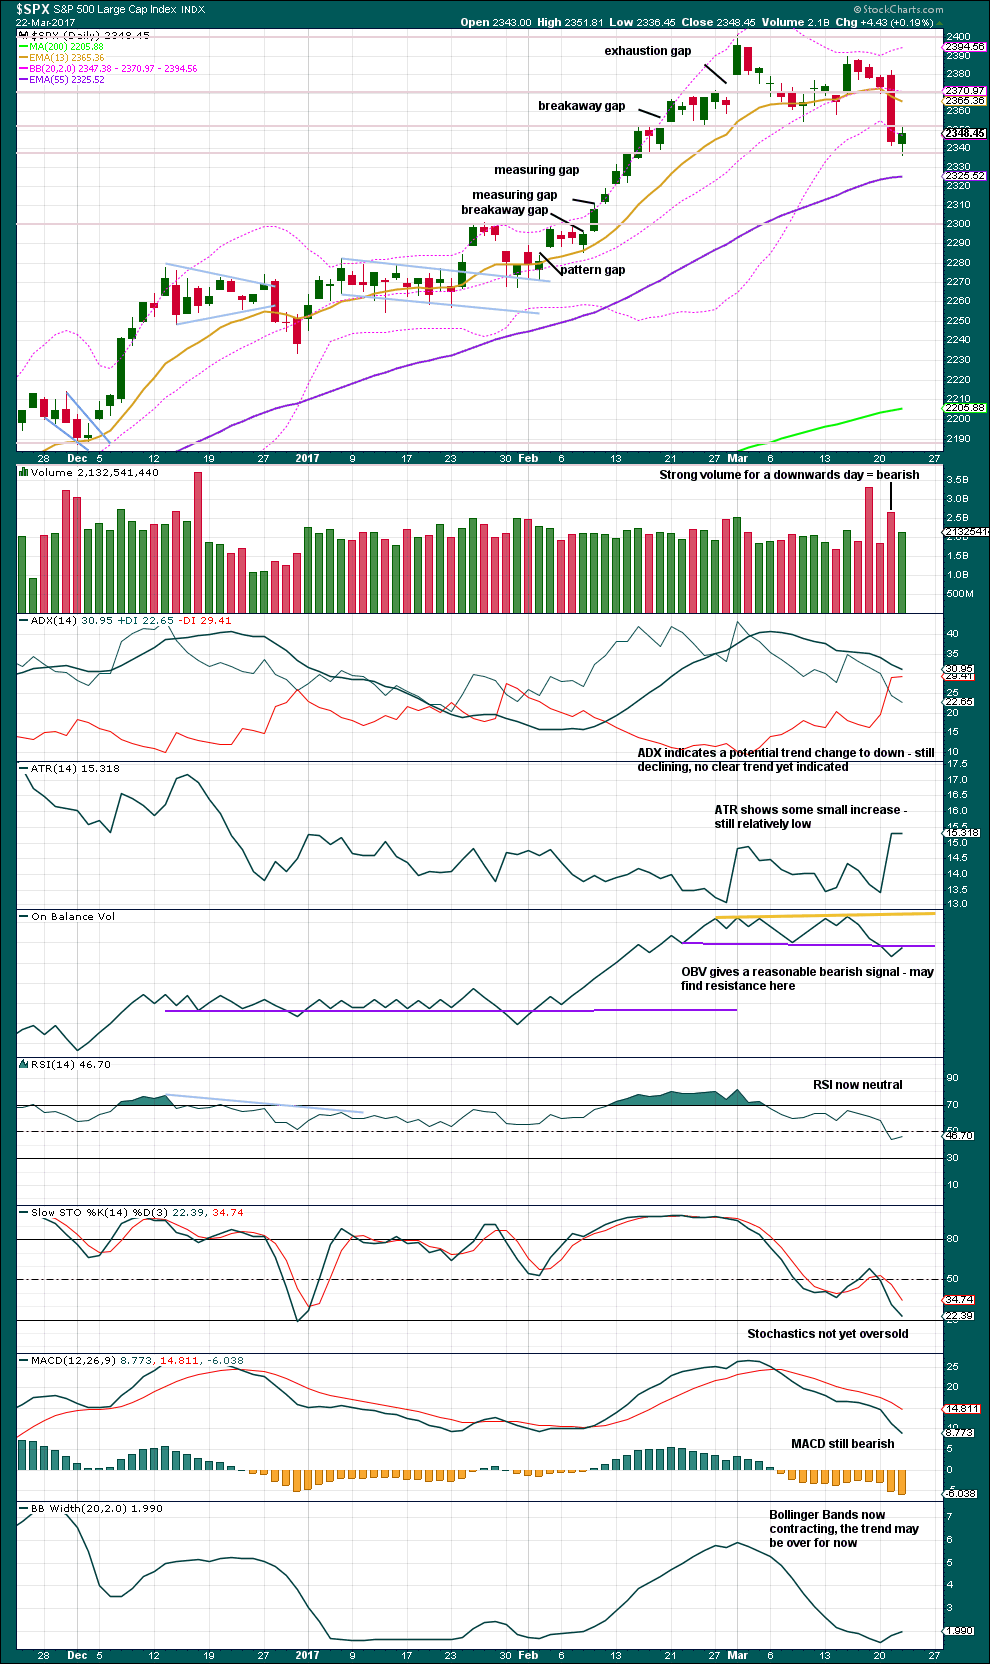
Price moved lower today with a lower low and a lower high, but the session closed green and the balance of volume was upwards.
Volume today is lighter than the prior downwards day, which may be read as bearish. However, it is heavier than two of the last four downwards days. Price looks like it has found some support about 2,340.
On Balance Volume is at resistance. This should be read as bearish. Only if OBV can break above the purple line would it give a bullish signal, or at least negate the prior bearish signal.
Neither Stochastics nor RSI are extreme. There is room for price to fall.
VOLATILITY – INVERTED VIX CHART
Click chart to enlarge. Chart courtesy of StockCharts.com.
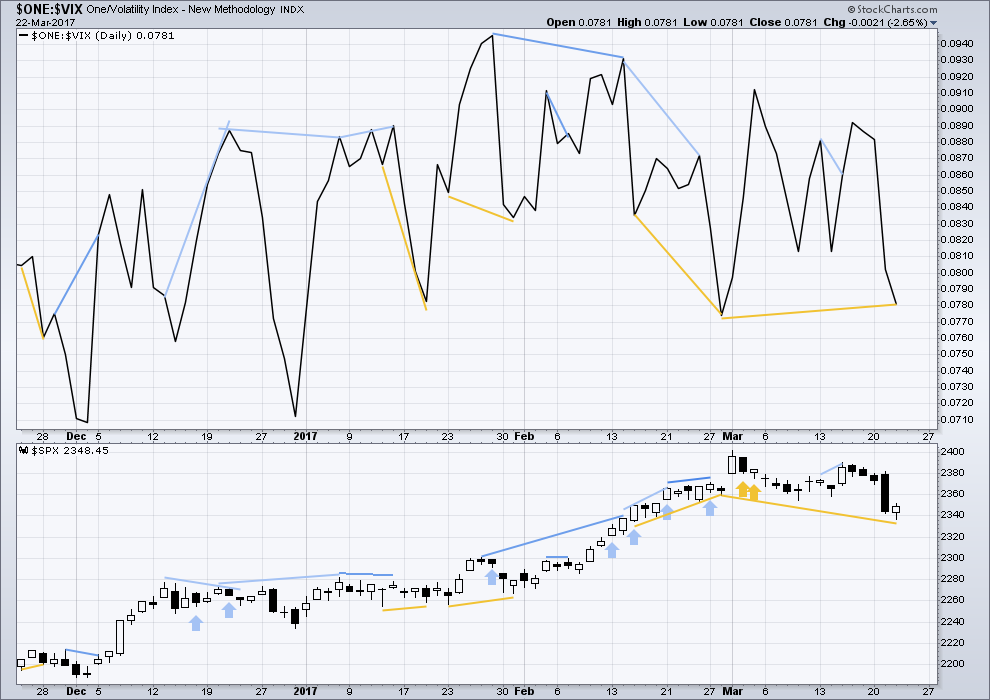
Normally, volatility should decline as price moves higher and increase as price moves lower. This means that normally inverted VIX should move in the same direction as price.
Bearish divergence and bullish divergence spanning a few short days used to be a fairly reliable indicator of the next one or two days direction for price; normally, bearish divergence would be followed by one or two days of downwards movement and vice versa for bullish divergence.
However, what once worked does not necessarily have to continue to work. Markets and market conditions change. We have to be flexible and change with them.
Recent unusual, and sometimes very strong, single day divergence between price and inverted VIX is noted with arrows on the price chart. Members can see that this is not proving useful in predicting the next direction for price.
Divergence will be continued to be noted, particularly when it is strong, but at this time it will be given little weight in this analysis. If it proves to again begin to work fairly consistently, then it will again be given weight.
Mid term bullish divergence between price and inverted VIX continues today, but it is weaker. It will be given no weight in this analysis at this stage.
BREADTH – AD LINE
Click chart to enlarge. Chart courtesy of StockCharts.com.
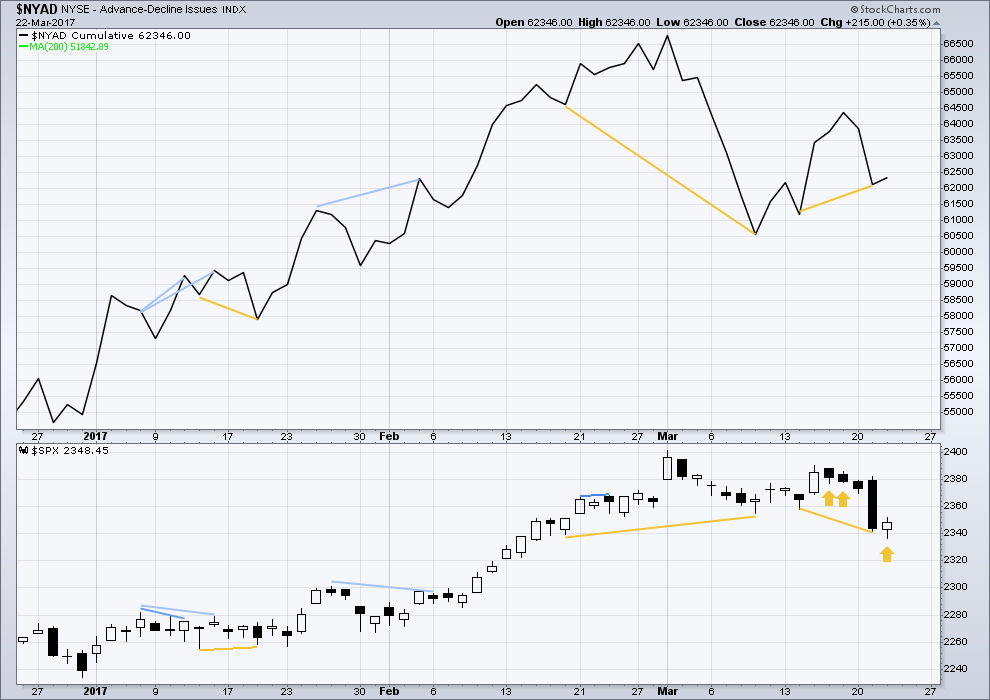
The rise in price has support from a rise in market breadth. Lowry’s OCO AD line also shows new highs along with price. Normally, before the end of a bull market the OCO AD line and the regular AD line should show divergence with price for about 4-6 months. With no divergence, this market has support from breadth.
There is short term bullish divergence between the AD line and price from yesterday’s low to the low of 14th of March (and also back to the 9th of March). Price has not come with a corresponding decline in market breadth while it has made a new low. There is weakness within this downwards movement from price. This supports the main hourly Elliott wave count which sees a low in place.
There is now also single day bullish divergence with price and the AD line: the AD line moved higher while price moved lower. Market breadth improved although the market made a new low. This is bullish.
DOW THEORY
The DJIA, DJT, S&P500 and Nasdaq continue to make new all time highs. This confirms a bull market continues.
This analysis is published @ 10:10 p.m. EST.

This one comes from a tip from Verne. Dillard’s is looking very bearish, short, mid and longer term.
It will have larger corrections along the way of course, but the longer term trend is down.
Today’s candlestick looks strongly like tomorrow should be a downwards day.
Sears Holdings also in the news – saying they doubt they can make it.
Not surprising, the holding company was just a way to sell off real estate assets. Don’t think they ever intended to make retail work.
The UVXY 20 strike calls expiring next week with a bid/ ask of 1.20/1.30 look awfully tasty…if we get a spike they will return at least a double; possibly more….just in case anyone was wondering…. 🙂
O.K. I was a WUS and cashed in my UVXY 19.50 calls for a small profit after the close.
You just watch.
It’ll hit 100 tomorrow!!!
Just kidding…..by all! 🙂
Okay I am out of here for the day. It has been fun and interesting. I didn’t make any money today. But I didn’t loose any either. That is better than the 3rd alternative of walking away with a loss.
I am going to give a name change. Should it be “Lara The Risk Adverse” or “Lara The Wise” or even “Lara The One Who Watches Out For Me”? I like the last.
Blessings to you all.
Hourly chart updated:
There may now be three first and second waves overlapping. If this is correct then we should see an increase in upwards momentum for the rest of this session and into tomorrow.
I’m still not confident enough of minor 4 being over to pull the invalidation point up. I would want to at least see a five up. We don’t have that yet.
Why doesn’t it surprise me that I like your chart better than mine. My 50% long is profitable and if the above count proves out, it is about to become more so. Will add to longs with more confidence that Minor 5 up has begun.
Sure it’s not because my chart is telling you what you want to hear? 🙂
I have a strong caveat: we don’t even have a five up yet.
If your positions are profitable already then perhaps pulling stops up to breakeven, that way you don’t have a loss if I’m wrong, and if I’m right you’ll be fine.
At least, until we have a five up complete. Then we’ll look for a second wave correction.
Boy would I love to cash in those UVXY 19.50 calls expiring tomorrow for a bit of green. I am a bit underwater so let’s see if we can remedy that before the close…..c’mon bears….you can do it!!! 🙂 🙂
You just watch; I’ll sell ’em and UVXY will go to 25 tomorrow! LOL!
If you sell, you ensure that it will happen :)!
I’m holding….dammit! 🙂 🙂 🙂
(It’s house money from that nice pop in the SVXY puts anyway!)
Oh my goodness. Well, I need to leave my desk for a hair cut and since I don’t want to take a hair cut to my short term account, I liquidated all the long positions. My, my, my. We will call it a break even trade.
——————————————————————————–
Before posting this I checked the charts, just minutes after liquidating my longs. I see that I made my decision just in time. Close call! Another bit of luck?
Smart…Berry berry smart. I think we may get an opportunity for a long trade tomorrow….
NDX futures already in the red. WRDR to my good friend Rodney, I am adding to my TWM puts! 😀
What does WRDR mean?
Oops! I meant to write WADR – “With All Due Respect” 🙂
Got it. You have a good one buddy. Give ’em hell in the trenches!
I am taking the money on those SVXY 133.50 puts and running like bat out of you know where!
Nice pop to 2.25….I’ll take it!!! 🙂 🙂 🙂
Spread on options starting to widen…that is always a give-away…. I had to negotiate a 2.16/2.88 spread. Frankly I think I did get teeny bit robbed!! 🙂
The banksters are dumping massive amounts of cash into the market minutes before the close. Soooo… are we all also supposed to jump in on the long side of the market?? Is that it?! 🙂
I think we could get an interim bottom tomorrow; provided the banksters don’t go all hog-wild trying to buy futures out of the red overnight. Let’s see if we get an upper BB penetration with a long upper wick from VIX tomorrow. Have a great evening all! Trade safe!
The plethora of rising wedges bears amazing testimony to the relentless attempts to resist the developing trend. Frankly I am starting to wonder if we are even going to get a correction as opposed to a collapse. This is totally nuts! 🙁
Or overlapping first and second waves? Pointing to a bit of health returning as a push up for a third wave unfolds… maybe to begin tomorrow
That is kinda what I am seeing too. Note: On the 15 minute chart, IWM has a completed fives waves up off the low of yesterday. Oftentimes the small caps lead like soldiers ahead of the generals.
Uh Oh! I am very short Mr Russell…. 🙂
Anybody else oggling those huge red candles on the one minute chart…? Yikes!
Well my stops are in very nearby. Since I am traveling tomorrow and all weekend, I have hard stops in at which I would sustain a small loss both percentage wise and actual dollars.
I have mentioned several times I was eyeing 2320 on SPX. As Lara states, the confidence that Minor 5 has begun is low at this point.
All the talking heads are opining that what the markets do next is going to depend on the vote on the health care bill. It is really way too funny. Mr Market is going to do what Mr Market does, and it seems to me he has already shown his hand. I guess folk always have to have some causation.
A few weeks ago I mentioned Gann’s observation regarding years ending in seven and I think it is fascinating that the other two years in which sentiment extremes matched what we are seeing today were the October 2007 and August 1987 tops. While I think we probably have another leg higher, the current persistent level of elevated optimism militates against it happening immediately. The next run higher requires some dissipation of the mania…
A Gann trader I respect predicts the August 21st “Great American Eclipse” will be the turning point for the market. This coincides with the market cycle predicted in Gann’s “Tunnel through the Air”. Seems like a convergence of cycle methods are pointing in this direction. It will very likely be a crazy time.
Of course – we don’t know what will set this off – but it is likely to be a violent blow off top. In turns of opportunity I think GS might be a good short given their extreme run up – and the impact of a collapse on their business.
From a tradition technical analysis POV Northy does a good job:
https://northmantrader.com/2017/03/05/disconnects/
Getting a handle on a time line is quite tricky. The vast majority of traders don’t recognize the bear market until after the second wave tops when and when most are still in denial. As a matter of fact, it is not at all unusual for the mania at the top of a second wave to exceed the mania at the actual top. The recognition of what is unfolding comes at the beginning of the third wave down, so it seems to me that the August time line is going to require us to put in a top after this correction if we have not already, experience the first leg down, and then undergo a deep retrace to bring us to the peak of mania…interesting food for thought nonetheless…
Or could it be like Black Thursday, October 24th 1929? Something so huge it’s just not possible to read it as anything other than a crash?
That’s possible. In fact, I’d be pretty wary of it being a reasonable possibility given the extreme market conditions. A quick snap back to the mean, and then momentum makes price travel further….
I have thought a lot about that. I have had nightmares about seeing a thousand point decline in DJI futures and then guess what?
It actually happened! Almost a thousand points anyway (I refuse to remain long this market overnight and have had that attitude for some time now). Then most miraculously, we all watched in amazement as the banksters went to work and methodically bought the markets out of very deep in the red- I thin the DOW was down almost 800.00 points overnight. That experience has resulted in lot of trader hubris in my humble opinion. The way this market has been relentlessly juiced, we could indeed see sudden death, with very little or no warning whatsover. The level of complacency on display ( from VIX trading levels) is absolutely unprecedented. So….could we one evening see futures plunge by a few thousand points in the DOW with no prior warning?
I think this absolutely could happen. I would also not at all be surprised to see numerous traders all primed to BTFD at the open! Such is the nature of extraordinary popular delusions and the madness of crowds!
Scary!!!!
Good solid TA there, thank you very much for posting the link.
I don’t usually watch video, but that one was okay. Not as clearly presented as Chris Ciovacco’s, but Northman has some very interesting analysis in there.
I think retailers will downsize and some will survive and thrive. TGT, WMT, TJX, ROSS, will survive at the end of the day. Some mall retailers will shrink size and do ok as well. M may sell several real estate, close stores etc. But lots of retail jobs will go away. AMZN clear winner for now.
TGT is toast imo! 🙂
They were YUGE buyers of their own stock at inflated prices.
They are going to default on those bonds and almost certainly have to liquidate or be taken over.
I am not at all convinced that retailers are going to fare well in a deflationary depression.
Even AMZN is going to see a 90% drop in their on-line revenues. No one will have money to buy worthless baubles when they are desperately trying to feed their families.
Well I have to agree with you Verne. Everyone has storage for there junk now. Maybe that is a good place to be though. I remember a scene in sea biscuit, where a family is sitting around eating a nice meal in their beautiful home. Shortly thereafter they are homeless on the street….1920s….people are too complacent. Many will be moving their junk to storage to move out of our houses we can’t afford. Storage companies might do ok then ;). I won’t be laughed at for keeping my paid off 2001 honda clunker then.. might be my new home…short the autos, auto finance companies?
“…short the autos, auto finance companies?…”
Like there is no tomorrow…like there is no tomorrow!
For them, there won’t be… 🙂
Used car sales down huge in Feb…
in the long run — YES — especially if we have deflation. In that scenario, all might cold hard cash will be worth a lot. Gold and silver will be down a lot with mkts.
Yep. Most will disagree with you about Gold and Silver but I think you are right. Initially EVERYTHING will deflate. And then, they will both go to the moon with hyperinflation ultimately bringing economic armageddon…
As I said…it gonna get ugly 🙂
Oops! I stand corrected….I actually said
VERY ugly didn’t I? LOL!
Reloading SVXY 133.50 strike puts expiring tomorrow for 1.75….
Dillard’s Inc. (DDS) is another retailer that is probably eventually going to zero. If is also in a counter-trend bounce today…hint! 🙂
That chart looks VERY bearish. Good tip Verne, thanks!
Most welcome!! 🙂
SVXY puts have crept up to 2.12/2.41 bid/ ask, even as the indices march gleefullly higher…VIX also bouncing off this morning’s lows. Go figure! 🙂
Selling puts for 2.12…
Simon Property Group is a veritable poster child for the blighted US retail landscape. One look at the chart and you will see why it is the gift that keeps on giving. LOL!
Knowing the context of this particular entity, I watched in utter disbelief as it traded well North of 200 last year and cannot help but wonder what the people who bought it at 220.00 are now thinking. As painful as it has been for the company’s shareholders, the ones who are really in trouble are those holding the bonds SPG issued to gorge on its own bloated shares, pumped up an order of magnitude from around 22 at the 2009 low.
I suspect it is headed back there.
But not to worry, on a more ominous note, they have contracted with Homeland Security to turn all that empty retail space into FEMA camps…..
“they have contracted with Homeland Security to turn all that empty retail space into FEMA camps”
Holy cow. That’s scary 🙁
Even more eerie, a lot of folk around the country (and also in the UK) are commenting on the construction of what looks like guard towers at a lot of these facilities. Something wicked this way comes…!
Buying SPG April 21 170 strike puts for 4.00…
Adding April 21 TWM 24 strike calls for 0.60 per contract.
Just opened my first set (50%) of long positions in short term account. Looking to add to this if we get a corrective wave back near Minor 4 low. Using TNA – 3X Small Cap / Russ 2000.
Speculative trade on SVXY 136 puts expiring tomorrow at 1.65
Another corrective rising wedge…they are everywhere!
Amusing price action that confirms my thesis, namely, that the banksters are not happy about the market decline and are fighting tooth and nail to keep the BTFD theme intact. They are burning quite a bit of cash today….it is going to be interesting when the active selling commences….
Why do I have the feeling that things are going to get very ugly…? 🙂
They’re getting desperate
2 in a row