Another downwards day has unfolded as expected to start the new trading week. The Elliott wave count remains the same and has support from volume and ADX.
Summary: A shallow pullback looks very likely now to have arrived. It may continue for another few days and possibly a few weeks longer. Target zones are either 2,368 – 2,353 or 2,282 – 2,234. A new low below 2,277.53 would indicate the lower target range should be used.
Downwards movement to find support at the blue channel on the daily and hourly charts is now expected as most likely.
New updates to this analysis are in bold.
Last monthly and weekly charts are here. Last historic analysis video is here.
MAIN ELLIOTT WAVE COUNT
WEEKLY CHART
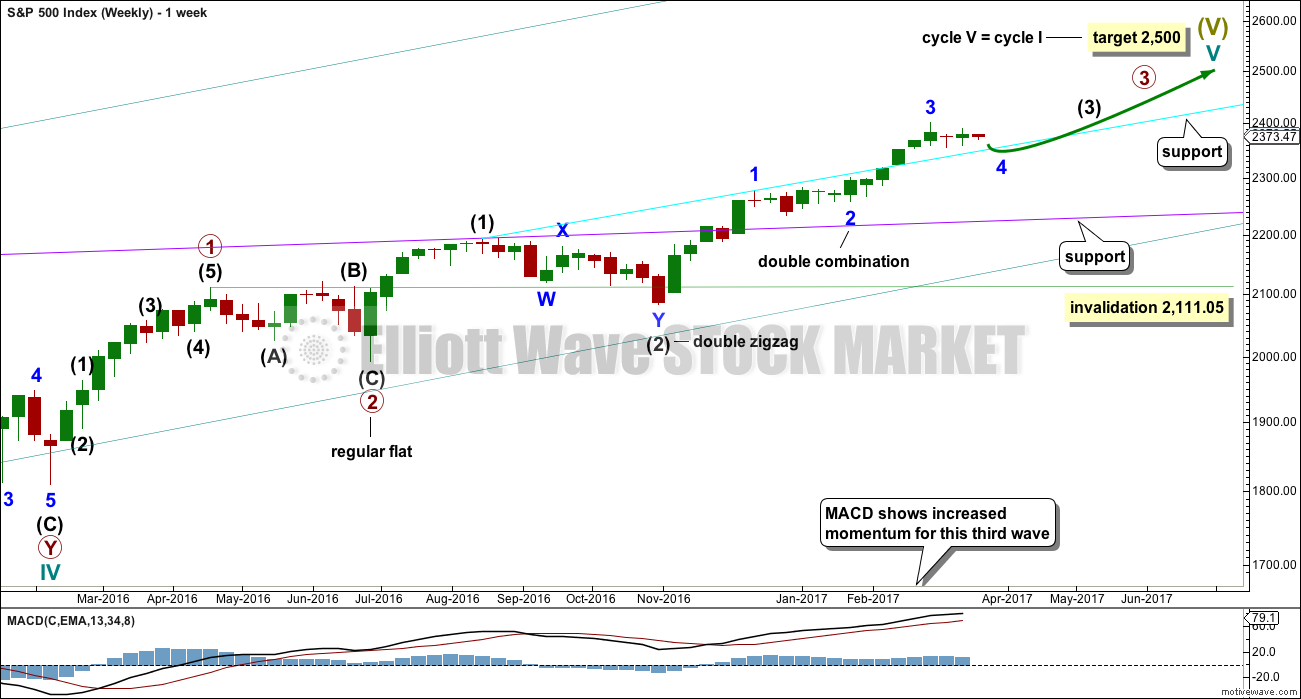
Cycle wave V is an incomplete structure. Within cycle wave V, primary wave 3 may be incomplete or it may be complete (alternate wave count below).
Primary wave 4 may not move into primary wave 1 price territory below 2,111.05.
As price moves lower look for support at each of the longer term trend lines drawn here across previous all time highs. Next support at the cyan line may be met soon.
DAILY CHART
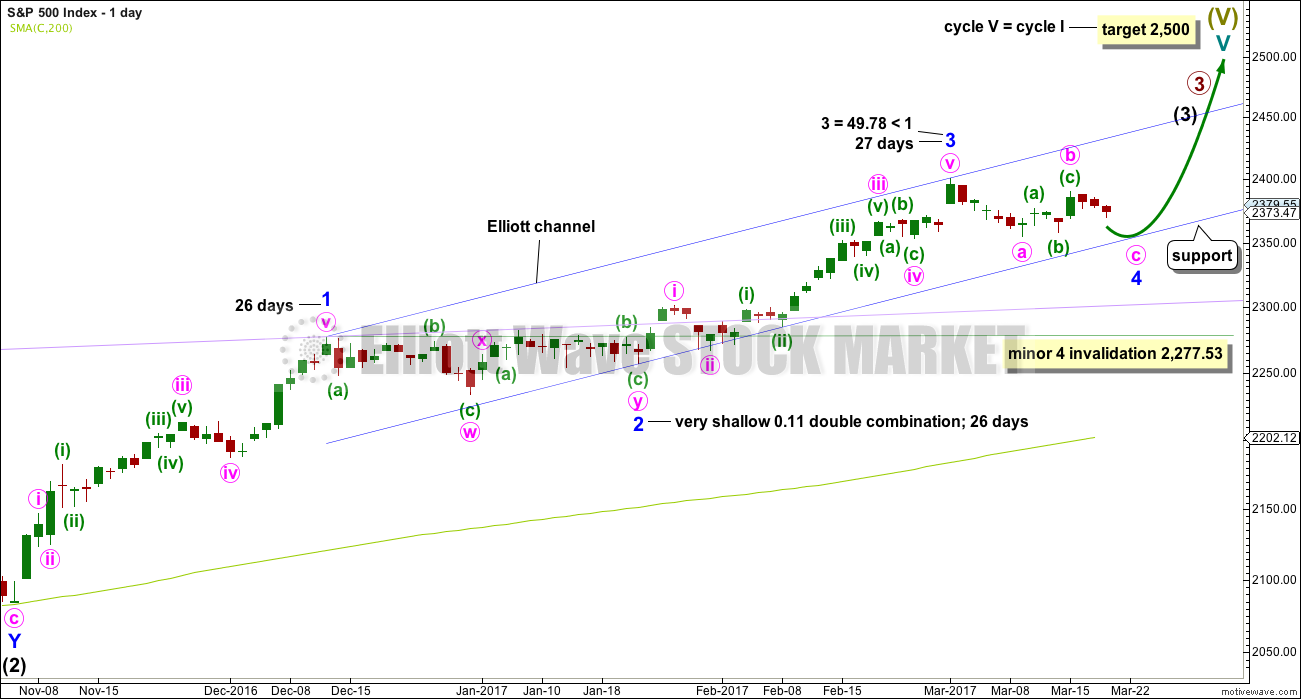
All subdivisions are seen in exactly the same way for both daily wave counts, only here the degree of labelling within intermediate wave (3) is moved down one degree.
This wave count expects the current correction is minor wave 4, which may not move into minor wave 1 price territory below 2,277.53. A new low below this point would confirm the correction could not be minor wave 4 and that would provide confidence it should be primary wave 4.
Minor wave 4 may last about 26 days if it is even in duration with minor waves 1, 2 and 3. That would give the wave count good proportions and the right look. So far minor wave 4 has lasted only 13 days, so it may continue for another 13 if it is even in duration with minor waves 1, 2 and 3.
At this stage, it is looking like this wave count may be more likely than the alternate wave count. A correction at minor degree for minor wave 4 should look similar in range and strength to minor wave 2, which so far it does.
Minor wave 4 may end within the price territory of the fourth wave of one lesser degree about 2,368 to 2,353.
This wave count now expects support at the wider blue Elliott channel.
HOURLY CHART
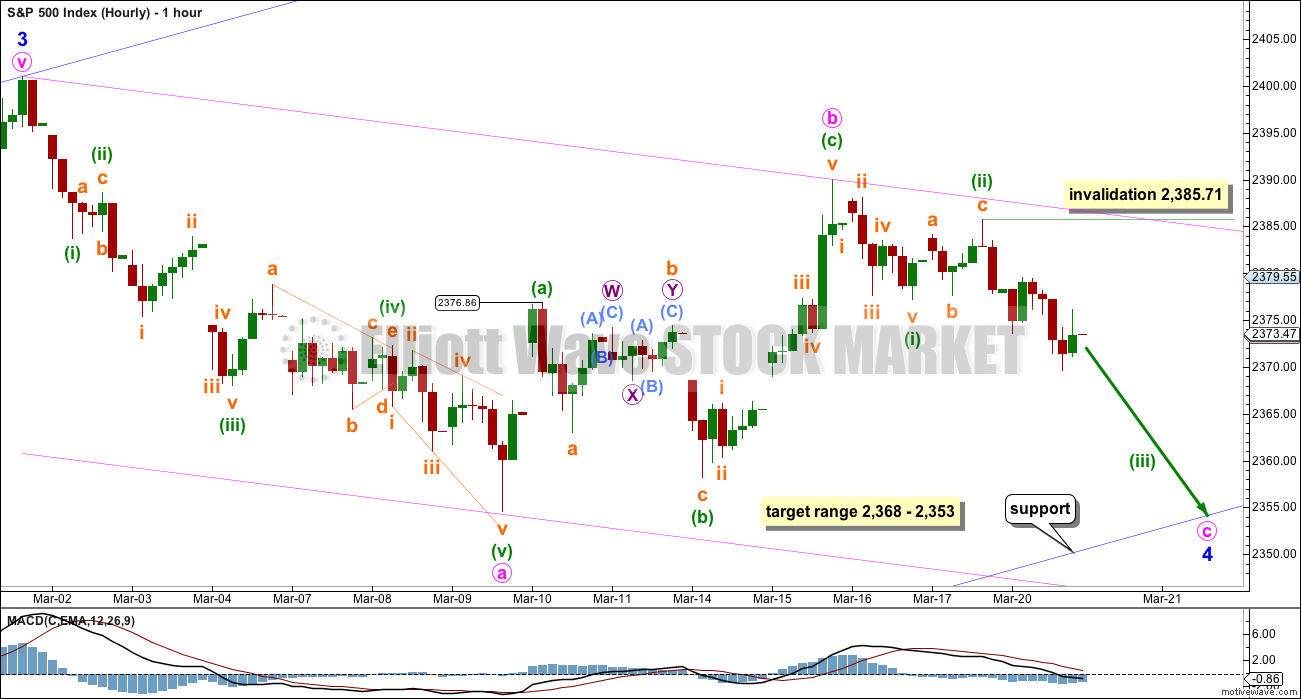
Minor wave 4 looks still like an incomplete zigzag. Within it minute wave b now looks like a complete zigzag.
Use the blue channel to show where minor wave 4 is most likely to end. Expect price to find support at the lower edge.
The target zone of 2,368 to 2,353 is the price territory of the fourth wave of one lesser degree (minute wave iv within minor wave 3 is seen on the daily chart).
So far, within minute wave c, there may be a five down complete for minuette wave (i). Minuette wave (ii) may also be complete as a regular flat correction. Downwards movement for Monday has shown some increase in momentum.
Within minuette wave (iii), no second wave correction may move beyond the start of its first wave above 2,385.71.
At its end, if this wave count is correct, minor wave 4 may offer a good entry point to join the upwards trend.
Always remember my two Golden Rules:
1. Always use a stop.
2. Do not invest more than 1-5% of equity on any one trade.
ALTERNATE DAILY CHART
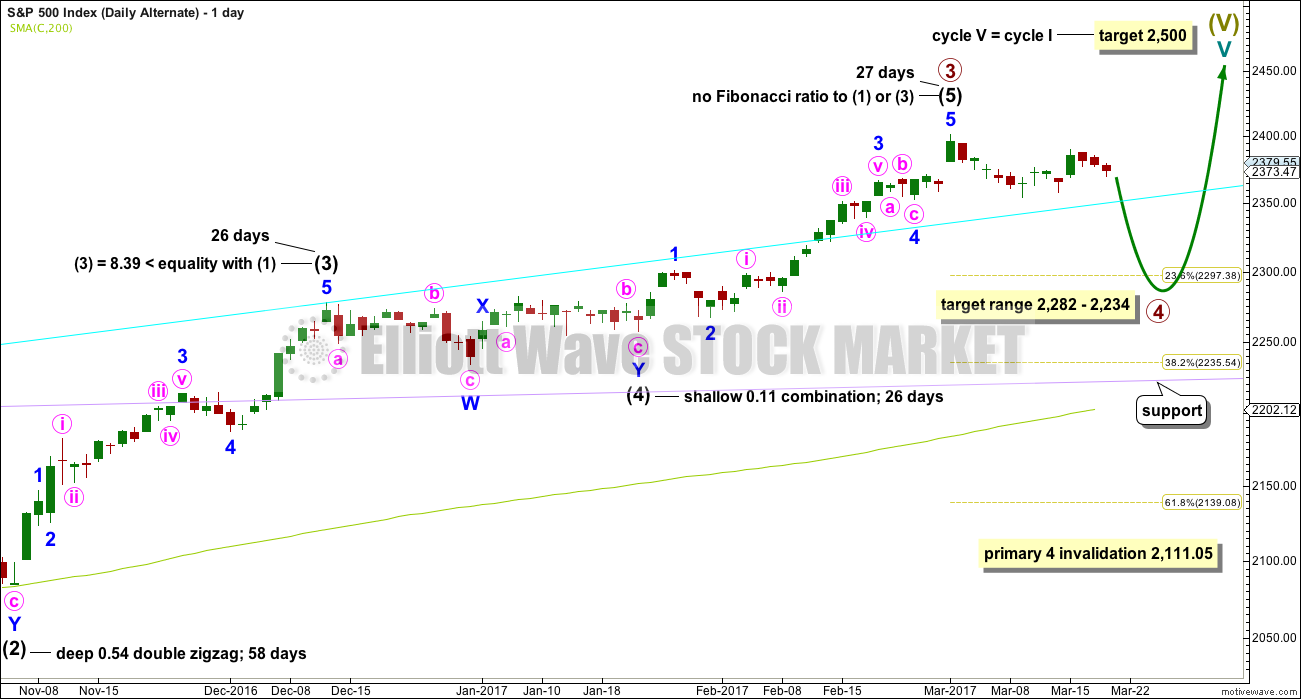
The subdivisions of upwards movement from the end of intermediate wave (2) are seen in the same way for both wave counts. The degree of labelling here is moved up one degree, so it is possible that primary wave 3 could be over.
Primary wave 2 was a flat correction lasting 47 days (not a Fibonacci number). Primary wave 4 may be expected to most likely be a zigzag, but it may also be a triangle if its structure exhibits alternation. If it is a zigzag, it may be more brief than primary wave 2, so a Fibonacci 21 sessions may be the initial expectation. If it is a triangle, then it may be a Fibonacci 34 or 55 sessions.
Intermediate wave (3) is shorter than intermediate wave (1). One of the core Elliott wave rules states a third wave may never be the shortest wave, so this limits intermediate wave (5) to no longer than equality in length with intermediate wave (3). If intermediate wave (5) is now over, then this rule is met.
Minor wave 3 has no Fibonacci ratio to minor wave 1. If minor wave 5 is now over, then it is 4.14 points longer than equality in length with minor wave 3.
Intermediate wave (5) may have ended in 27 days, just one longer than intermediate waves (3) and (4). This gives the wave count good proportions.
The proportion here between intermediate waves (2) and (4) is acceptable. There is alternation. Both are labelled W-X-Y, but double zigzags are quite different structures to double combinations.
The following correction for primary wave 4 should be a multi week pullback, and it may not move into primary wave 1 price territory below 2,111.05.
TECHNICAL ANALYSIS
WEEKLY CHART
Click chart to enlarge. Chart courtesy of StockCharts.com.
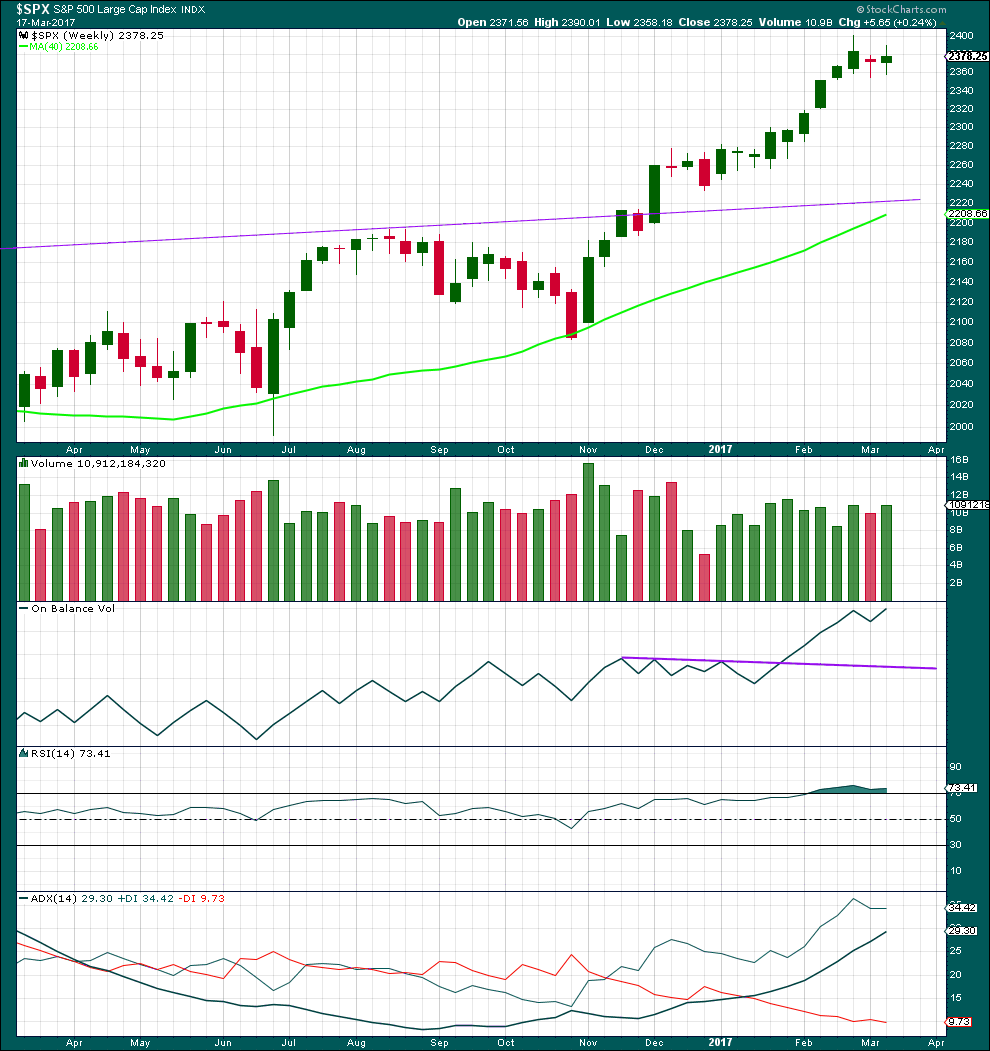
A red doji for the previous week to last week and a small real body for last week look corrective. A small correction looks to be unfolding within a larger upwards trend.
A small increase in volume last week offers some support for upwards movement, but to read this more accurately we should look inside the week at daily candlesticks.
RSI is still extreme, but it may remain so for reasonable periods of time during a trending market. ADX is not yet extreme, so there is room for this trend to continue.
DAILY CHART
Click chart to enlarge. Chart courtesy of StockCharts.com.
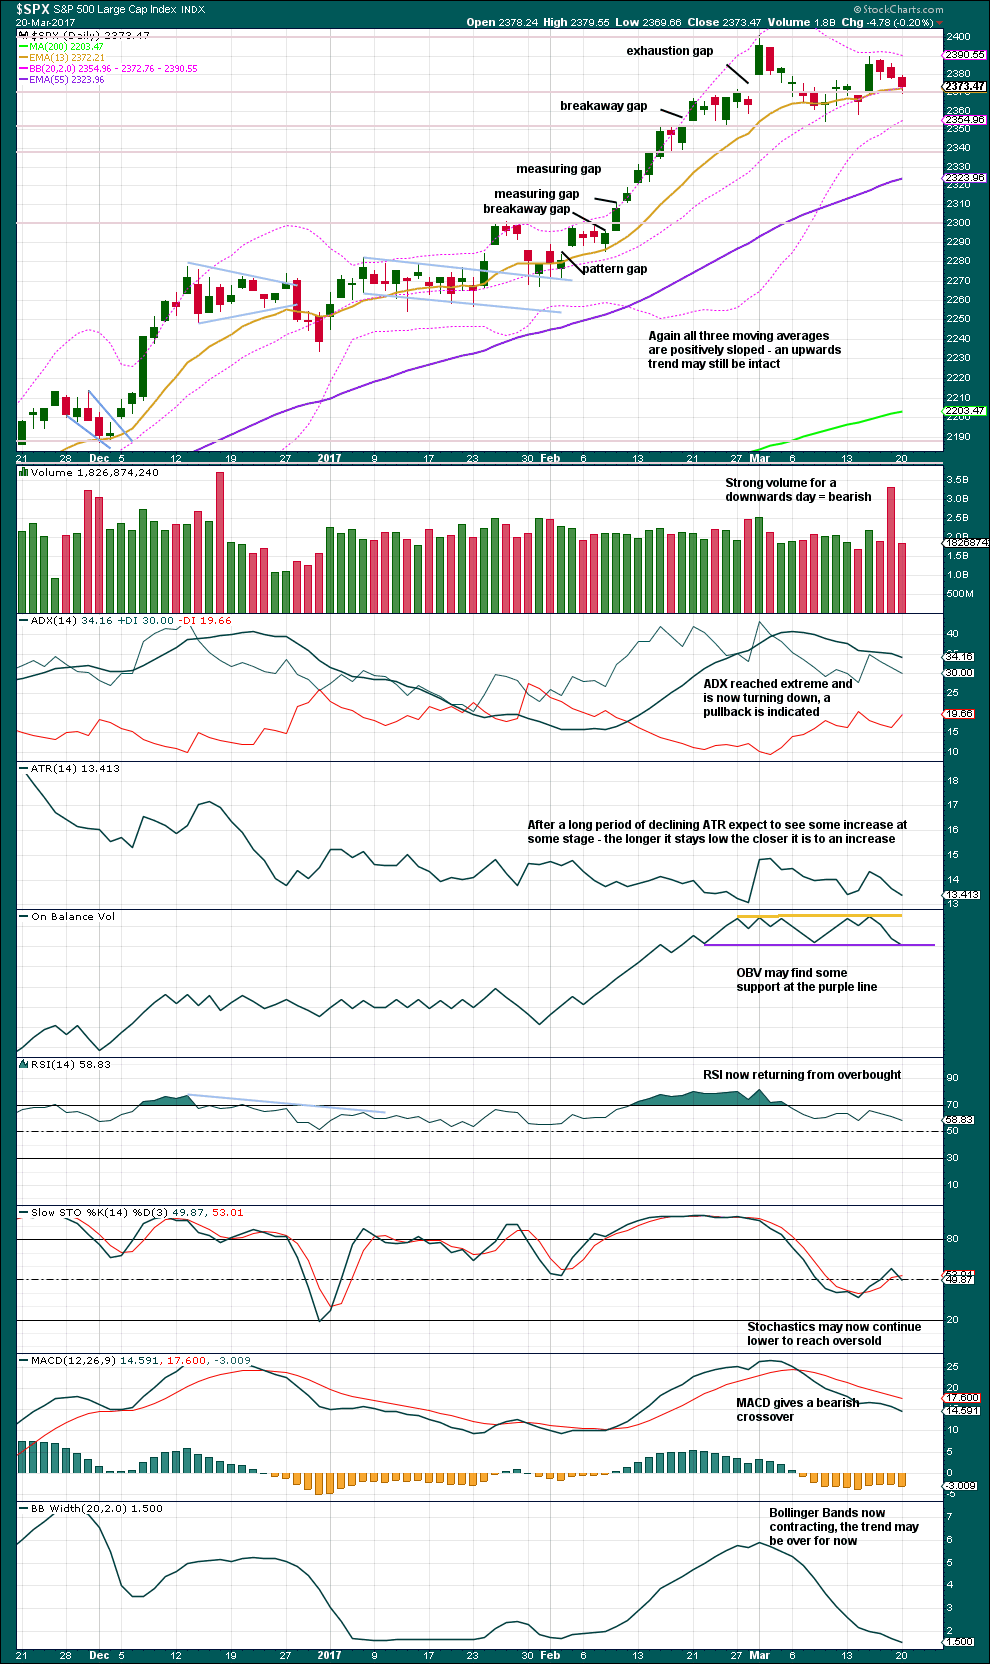
Price is still range bound with resistance about 2,400 and support about 2,355.
Overall, this chart strongly suggests that price is consolidating within a larger upwards trend.
A new support line is drawn on On Balance Volume. It has only been tested twice before, so at this time it does not have good technical significance.
VOLATILITY – INVERTED VIX CHART
Click chart to enlarge. Chart courtesy of StockCharts.com.
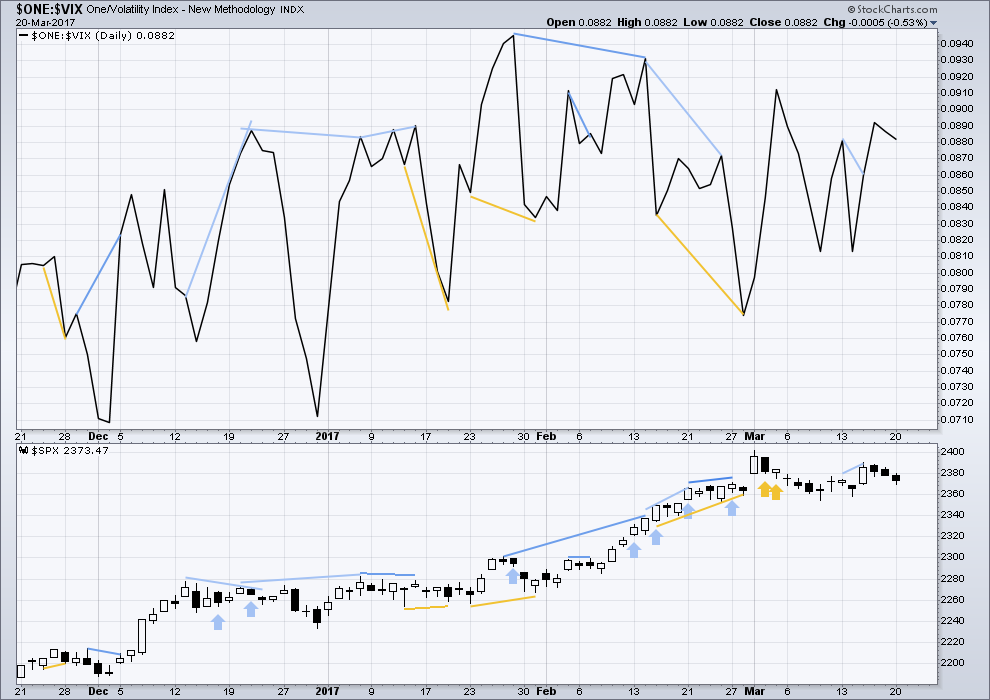
Normally, volatility should decline as price moves higher and increase as price moves lower. This means that normally inverted VIX should move in the same direction as price.
Bearish divergence and bullish divergence spanning a few short days used to be a fairly reliable indicator of the next one or two days direction for price; normally, bearish divergence would be followed by one or two days of downwards movement and vice versa for bullish divergence.
However, what once worked does not necessarily have to continue to work. Markets and market conditions change. We have to be flexible and change with them.
Recent unusual, and sometimes very strong, single day divergence between price and inverted VIX is noted with arrows on the price chart. Members can see that this is not proving useful in predicting the next direction for price.
Divergence will be continued to be noted, particularly when it is strong, but at this time it will be given little weight in this analysis. If it proves to again begin to work fairly consistently, then it will again be given weight.
There is no new divergence between price and inverted VIX.
BREADTH – AD LINE
Click chart to enlarge. Chart courtesy of StockCharts.com.
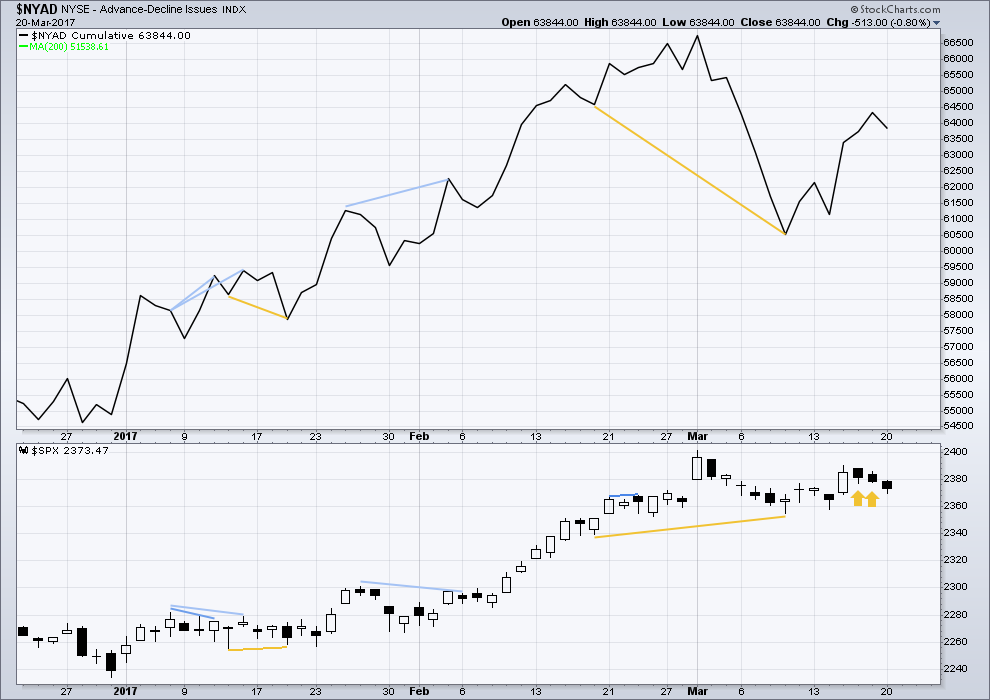
The rise in price has support from a rise in market breadth. Lowry’s OCO AD line also shows new highs along with price. Normally, before the end of a bull market the OCO AD line and the regular AD line should show divergence with price for about 4-6 months. With no divergence, this market has support from breadth.
Two days of bullish divergence has been followed by another downwards day. This divergence is now considered to have failed.
There is no new divergence today between price and the AD line as both moved lower.
DOW THEORY
The DJIA, DJT, S&P500 and Nasdaq continue to make new all time highs. This confirms a bull market continues.
This analysis is published @ 07:21 p.m. EST.

Good morning everybody on this wonderful profitable morning!
Price is sitting about the lower trend line. I can see minor 4 possibly complete now as a shallow zigzag, so far reaching just below the price territory of the fourth wave of one lesser degree.
If this is minor 4 then that should be all she wrote.
If price keeps going down from here then minor 4 could overshoot the channel. That’s possible. Sometimes fourth waves do that, which is why Elliott developed a second technique to redraw the channel when they do.
2,373.52 is the price point which we need to see a new high above now to tell us that minor 4 is most likely over. If that happens then the next wave up to new highs should be underway.
While price remains below 2,373.52 we must admit the possibility this could be primary wave 4 as per the alternate.
Fast stocks aren’t in oversold territory yet. If it’s the alt, whould you expect a bounce here at resistance and then another move down for an abc decline.?
For the alt, yes. A bounce for a fourth wave. This would be a zigzag for intermediate (A) of primary 4, and minor C of the zigzag would be incomplete most likely.
Then minor B would move up in choppy movement which may make a new high.
VIX should confirm a possible ZZ for a primary four with higher lows…bullish engulfing candle should lead to several days, at the very least, of upwards movement…
The BTFD is deeply imprinted on market participants. If this is P4 down, we should see a very sharp spike in volatility ahead as they get dis-abused of their near term mania. This, as strange as it might seem, would auger well for a continued bull run into that final wave higher. Lara’s cyan trend-line looks to me like a great target for the wave down to end.
Rolled volatility trades into UVXY 20 strike calls expiring next week. It should spike to between 25.00 and 30.00 on this move down giving a 5X- 10X return on those calls acquired for 0.60 per contract. Trade safe everyone, and see ya later! 🙂
Yep! A five down now complete on the 15 minute chart.
That bullish engulfing candle on SVXY suggests to me we are not done by a long shot. My line in the sand is 2350. If we re-take it before the close minor five up most likely underway IMHO. Mornin’ Lara. So nice to have you drop in…. 🙂 🙂 🙂
I’m off back out for a bit shortly, I’m so exited, I have to share this with you.
One of the Kiwi in the nearby conservation estate has fledged a chick in the last few days and they want to see how he’s doing (for Kiwi it is Dad who does most of the work of looking after the egg).
I’ve been invited to come along and go look for him, to check up. If we find him then I may get to see my very first Kiwi in it’s natural wild state! Awesome!
Will get pics if we find him 🙂
Oooh! Please do post some pics if you get them!
That Daddy Kiwi sounds like yours truly! LOL
My darling wife keeps quite busy as an associate prof so I have had to master the domestic domain. I gave up proffing some time ago! 🙂
What were you a prof of Verne?
Organic Chemistry….of all things! 🙂
(My wife is the one that got the tenured position; I was really just a dillettante to be honest!)
Kiwi’s are my new favorite.
Maybe you were my professor! I received a Bachelor’s of Science in Chemistry in 1976.
Oh wow! That’s very impressive.
My sister has a PhD in organic chemistry, she worked in cancer research for a wile. She’s now a computer programmer. Really geeky 🙂 She’s the smart one in the family.
This move down coming on relatively light volume. This market is falling under its own weight so far and that really has to make you wonder. My thesis that this is happening without the banksters permission just might still obtain, despite not being signaled by a drop in futures. This is quite interesting!
Below 2350 the bears remain large and in charge. If we see some real selling develop in this market we are going to give back ALL of the 2017 gains…and possibly some….!
Reloading long vol trade via El Unicorn…. 🙂
If those vol short sellers are not real careful he is gonna stick that horn where the sun don’ shine! 🙂 🙂 🙂
SPX 2350 will probably distinguish a C from a third wave…
We need a high conviction break of 2350….never underestimate the banksters…!
Taking obscene profits on this impulse down…ready to reload on bounce if indicated… 🙂
Awesome Verne! Love the sound of that. “obscene” profits. Yep.
Yeah! I really went out on a limb and sold a boatload of SVXY calls waaaaay into the future and it paid off YUGE! Made up for all the frustration of the last few weeks! The near term trades also worked out quite well. I was starting get a bit embarrassed! I learned a great lesson from Steve Nison (as you well know) about loosing trades and it really helped me these last few days… 🙂
The current decline is auspicious for the mid-term bullish case. If we do not get a one day wonder but a real correction, we should get that final push to new all time highs. I will be looking for a possible ED to cap this long-in-the-tooth bull market.
I have liquidated my final long position in my mid-term account. 100% on the sidelines at the moment. Now I am looking for a through-back (test) to the blue channel line as a set up for a short position.
O.K we are coming up on a critical level. If the bulls and banksters know what’s good for them they had better make a stand here. We break 2350 on high volume and….
“Farewell and adieu, to you Spanish ladies…!”
Boy it’s been awhile since we have sung that theme hasn’t it? 🙂
Love the Jaws reference! Vol trades finally working, with robots trading the trend change. Finally some fun.
z’bout time!!?
Speaking of jaws, one chart I saw depicted a multi-decade “Jaws of Death” chart pattern…I can hear the music…. 😀
I have to admit it people. I got slapped around pretty good the last two weeks on my vol trades but days like today make being patient well worth it. Glad I stuck to my convictions. My faith in reversion to the mean has been restored. Aaahhh yes! Restored indeed! 🙂
That is one monster bearish engulfing candle in SVXY.
I am now officially declaring the Volatility 10X trade open for business! 😀
(The less adventurous may want to settle for just a double!)
You have played this well my friend. I suspect today is going to be a very good day for you. Way to go!
😉
This price action is nothing short of a bankster ambush people. There was not even a hint of this kind of decline in futures trading which shows how ridiculous these markets have become.
Rolling 141 SVXY puts into 135.00 puts for compounding gains…buying at the market, no time for screwing around….
Watch SPX 2350 closely.
If we slice through it there will be blood… 🙂
Adding SVXY puts. It is still trading at an insane level considering the risk in this market.
Who are these people long this animal???!!! 🙂
It is still possible that we are finishing up a minute C down to complete minor four.
Even if that is the case, I suspect the minor five up is going to be the mother of all bull traps. We have way too much complacency in this market imo to be on the threshold of another sustained bull run. Even if it looks like a successful bankster reversal I would still tread carefully on the long side going forward….
Lara’s count is working out to script. Today’s move down is most likely minuete (iii). So the bottom is not yet in. The question is will the SPX penetrate and stay below the blue channel line.
I may take a partial position long if we cannot penetrate the blue line and have completed five waves down to complete minute c and Minor 4. But, as you note, the next move up may be the last in this large bull trap being set up now. I will definitely look to trade volatility once the larger correction begins.
——————————————————-
STRIKE all the above. I just checked my charts and see 2353 has been taken out and it looks to me as though we will have a much deeper and time consuming correction starting now. Another 100 SPX points to the downside could become the target.
SVXY Puts added this morning already up 40% and we are really just warming up….
If this triple digit decline holds the bots are going to start to get active no doubt,…or are they that clueless?? 🙂
O.K. people. You don’t get too many opportunites these days to make a killing trading volatility. Please take some money from the banksters will ya?? 🙂
p.s. If we break SPX 2350.00, those reckless short positions WILL be unwound, no ifs ands or but; If not we could rebound in that area but we should at least test that level…
I am paying very close attention to what is taking place in the market right now. Another very naked attempt to arrest an impulsive decline as the banksters are determined that the market “shall not decline”. I wonder if they understand that the longer this insanity of no corrections in the market continues that greater the chances are that we are not going to get just a correction ultimately….they are truly incorrigible!
Poor banksters…do they know something we don’t?!! 🙂
Gap up open this morning for SVXY was an exhaustion gap. Although we have seen these negated in the recent past, this is as a good a risk/reward set-up for this beast I have seen in some time. Adding 141.00 puts expiring Friday….I expect to hold these less than 72 hours….
Adding to April 21 UNG 7.50 puts….
I keep getting stopped out of SVXY but I still am not convinced they can short volatility to abrogation of mean reversion. Adding to this week expiration 141 puts to lower cost basis to 2.00 even per contract.
Remarkably, it has notched yet another 52 week high today displaying even more extreme divergence from market price….
I will be adding to position with a close below 140.00….
Selling FXE 104 calls for 0.93….
Amazingly the Nasdaq is near new highs and the stochastics are still overbought while the macd is rolling over a bit. Lara, know you are busy but if you get an opportunity and feel up to it it would be nice to see your analysis on the Nasdaq.
Lara …please disregard request….I realize you have a paid subscription to the nasdaq
Are you sure about that Dermot? I’ve been a member here for over 5 years and don’t recall a subscription for the Nasdaq. Lara used to provide frequent analysis for the DJIA and Nasdaq as part of the SPX subscription. Lara will probably clear this up for us later today.
In the meantime, I agree with what Vern wrote near the end of yesterday. We will probably see the sideways correction end with a terminal fifth wave ending above 2400 and leading to a sharp and stronger correction.
Have a great day,
Hey Rod; you are pretty good at catching these moves up so let me know if you plan on going long so I can ride your coat-tails! 😀
Thanks rodney
I do have a count for Nasdaq, it’s not part of any paid subscription, I will update it for you this week Dermot.