Yesterday’s analysis expected downwards movement.
Price has moved sideways, to complete a small doji candlestick, and remains below the invalidation point on the Elliott wave count.
Summary: A correction down to about 2,120 and the lilac trend line is still expected this week. Use this as an opportunity to join the trend for a third wave up. Volume strongly supports the Elliott wave count. Manage risk because it is the single most important aspect of trading. Do not invest more than 3-5% of equity on any one trade and always use a stop.
Last monthly chart for the main wave count is here.
Last weekly chart is here.
New updates to this analysis are in bold.
MAIN WAVE COUNT
DAILY CHART
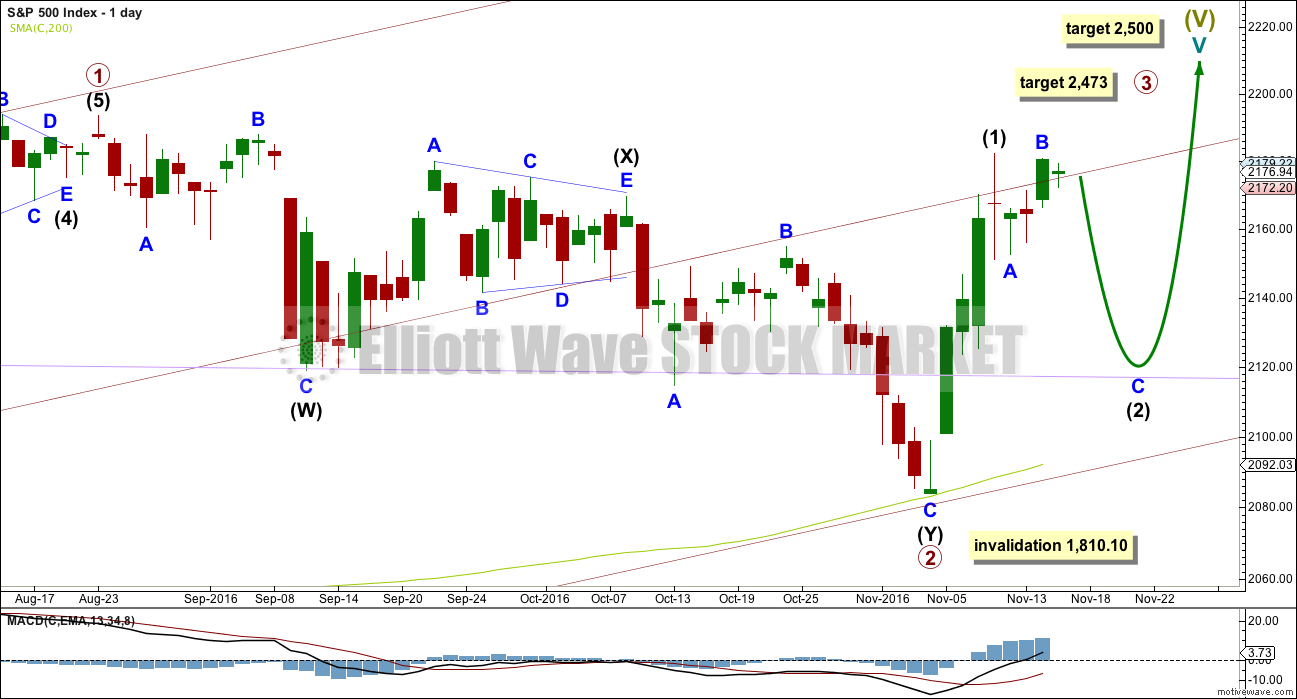
Primary wave 2 now looks to be complete as a double zigzag. Within primary wave 2: intermediate wave (W) was a very shallow zigzag lasting a Fibonacci 13 sessions; intermediate wave (X) fits perfectly as a triangle lasting 20 sessions, just one short of a Fibonacci 21; and intermediate wave (Y) also lasting 20 sessions deepens the correction achieving the purpose of a second zigzag in a double.
Primary wave 2 looks like it has ended at support about the lower edge of the maroon channel about primary wave 1, and at the 200 day moving average.
With upwards movement slicing cleanly through the lilac trend line, this behaviour looks to be more typical of an upwards trend. At this stage, corrections within primary wave 3 may be expected to turn down to test support at this trend line. While after hours movement did not find support there, the New York session did.
At 2,500 cycle wave V would reach equality in length with cycle wave I.
At 2,467 primary wave 3 would reach equality in length with primary wave 1. This is the ratio used in this instance because it fits with the higher target at 2,500.
Within primary wave 3, intermediate wave (1) may have ended at the last high. Intermediate wave (2) may turn price downwards to test support at the lilac trend line. It is typical of the S&P to show the subdivisions of its third waves clearly at higher time frames.
Primary wave 3 may show some strength compared to primary wave 1, but it does not have to. This wave count sees price in a final fifth wave at cycle degree, within a larger fifth wave at Super Cycle degree. The upcoming trend change may be at Grand Super Cycle degree, a once in generations trend change. This final fifth wave should be expected to exhibit great internal weakness; this market may appear broken. That would be typical behaviour for a final fifth wave of this magnitude.
HOURLY CHART
Intermediate wave (1) may have ended at the last high.
Intermediate wave (2) would most likely end about the 0.618 Fibonacci ratio of intermediate wave (1) at 2,121. This is close to the lilac trend line.
Within intermediate wave (2), minor wave B may be incomplete. It may move either higher or sideways. If minor wave A is correctly analysed as a five wave impulse (this is what it looks like on the five minute chart), then minor wave B may not move beyond its start above 2,182.32.
Minor wave B has moved higher. It did not unfold as a triangle and now looks like a zigzag. Minute wave c fits as an ending contracting diagonal, a close relative of triangles. The only thing which looks a little odd about it is the large overshoot of the (i)-(iii) trend line. Normally, the fifth wave only slightly overshoots this trend line.
Intermediate wave (2) may not move beyond the start of intermediate wave (1) below 2,083.79.
Intermediate wave (1) lasted four days. Intermediate wave (2) has so far lasted four days and may continue to total a Fibonacci five or eight days. All of these options would still give the wave count a good look in terms of proportion.
Minor wave C must subdivide as a five wave structure. So far minute waves i and ii may be complete. Minute wave iii may unfold strongly lower tomorrow, then it may end with a weaker low before minor wave C is done.
If price makes a new high above 2,182.32 tomorrow, before a downwards wave, then my analysis of minor wave A as a five is wrong. There would be two options at that stage: either intermediate wave (2) was over at the low as a quick shallow zigzag labelled minor wave A, or intermediate wave (2) is continuing further as a flat correction. The second option is more likely.
TECHNICAL ANALYSIS
WEEKLY CHART
Click chart to enlarge. Chart courtesy of StockCharts.com.
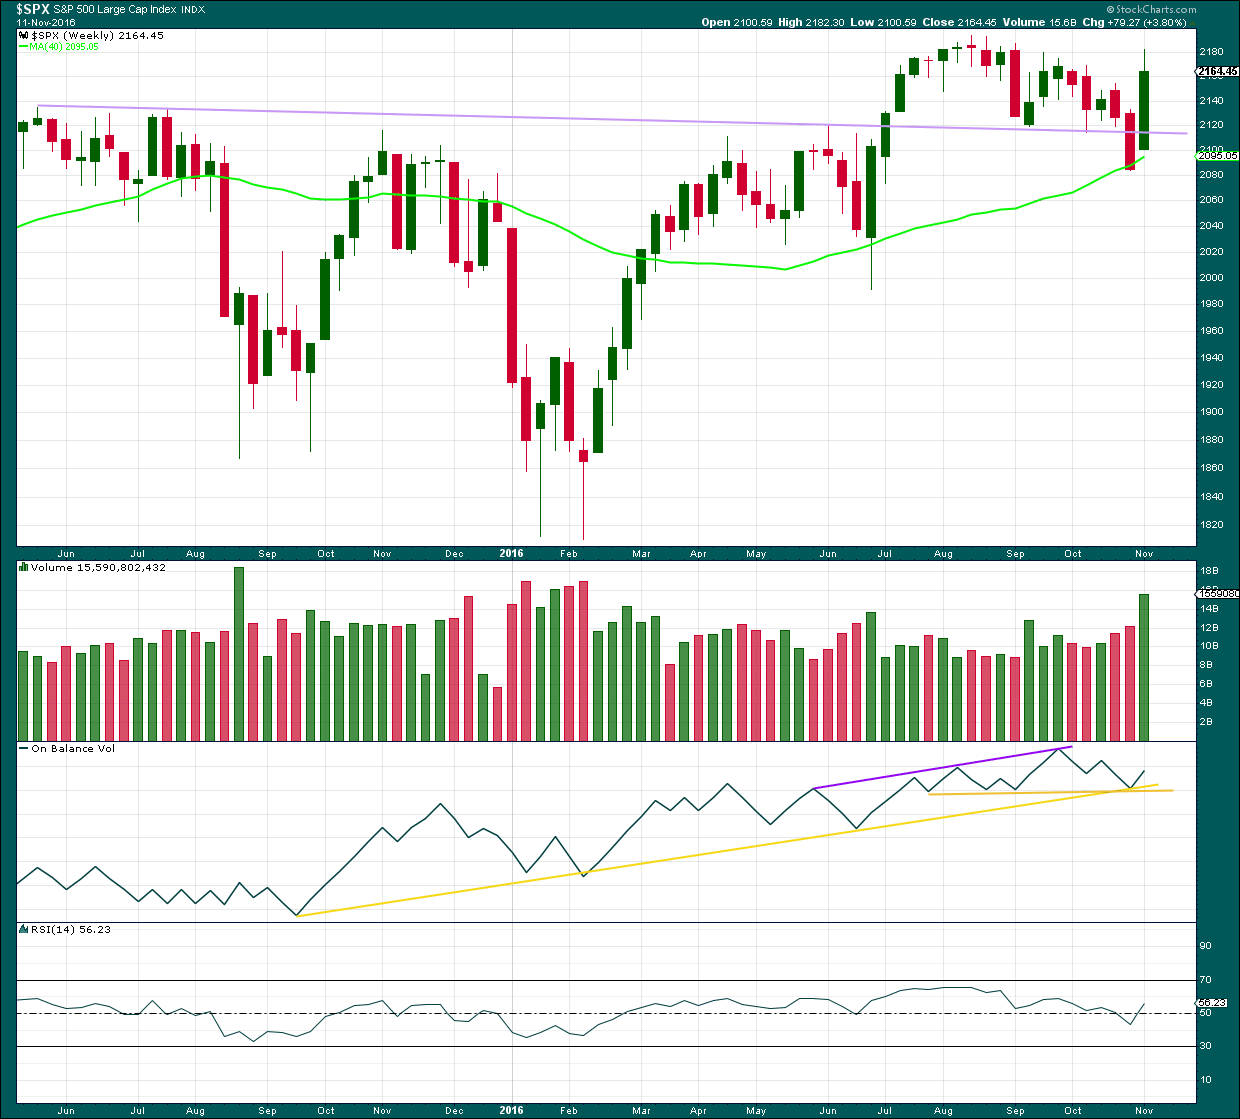
A break back up above the lilac trend line is very bullish. This line is now weakened because of the break, but it should still be expected to provide some support if price turns down a little.
Price has found support at the 40 week / 200 day moving average.
Upwards movement last week has strong support from volume. This supports the Elliott wave count.
On Balance Volume found support at the two yellow trend lines. This also supports the Elliott wave count.
RSI is not extreme, so there is room for price to rise further.
DAILY CHART
Click chart to enlarge. Chart courtesy of StockCharts.com.
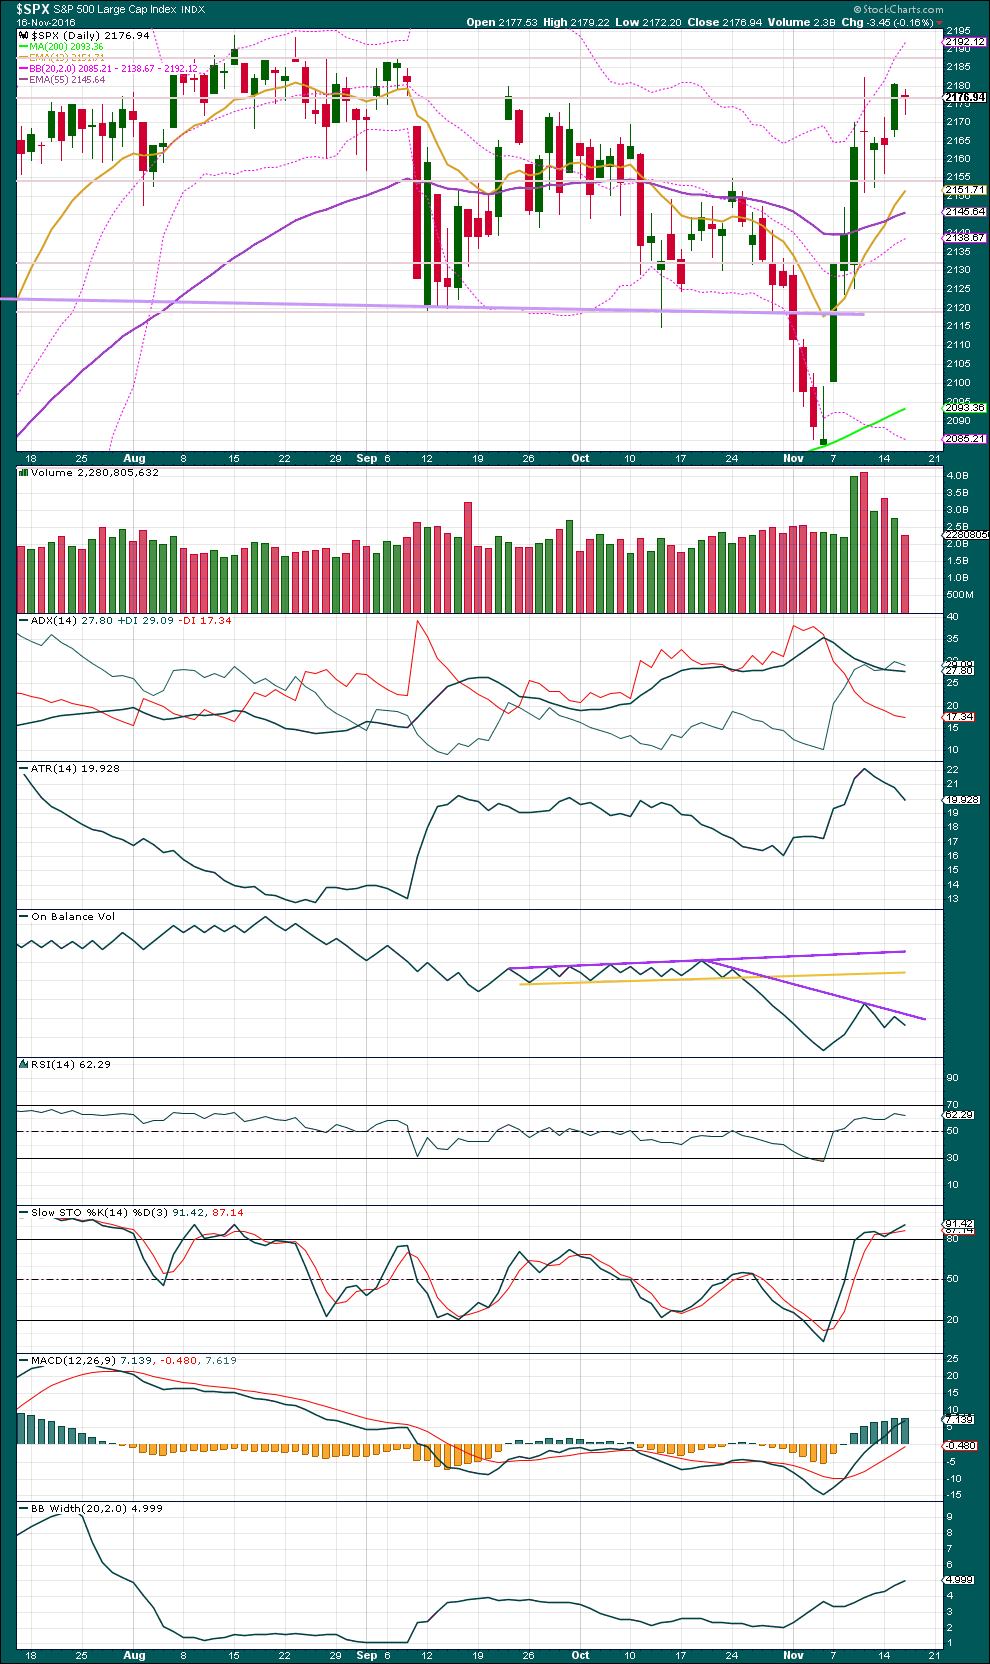
A small inside day completes a small red doji. A doji represents a balance of bulls and bears. With lighter volume this day looks corrective, which fits the wave count.
The balance of volume today was downwards with On Balance Volume moving lower. There is little support for downwards movement. This may give some small cause for concern in the Elliott wave count expecting a sharp wave down to support at 2,120. However, it is also possible that the market may fall of its own weight to support.
The next support is about 2,155 and thereafter about 2,120.
ADX is declining, indicating the market is not trending. ATR agrees. Bollinger Bands disagree as they are widening. With two of these three indicators suggesting the market is not trending, it is reasonable to conclude the last few days are a consolidation.
On Balance Volume has again today turned down from the purple trend line. This line has now been tested three times. A break above it would be a reasonable bullish signal, but not a strong one because the line has a steep slope.
Stochastics is overbought and now exhibits divergence with price: price has made a lower high since the high of the 10th of November, but Stocahstics today made a new high. This divergence is bearish and indicates weakness in price.
VOLATILITY – INVERTED VIX CHART
Click chart to enlarge. Chart courtesy of StockCharts.com.
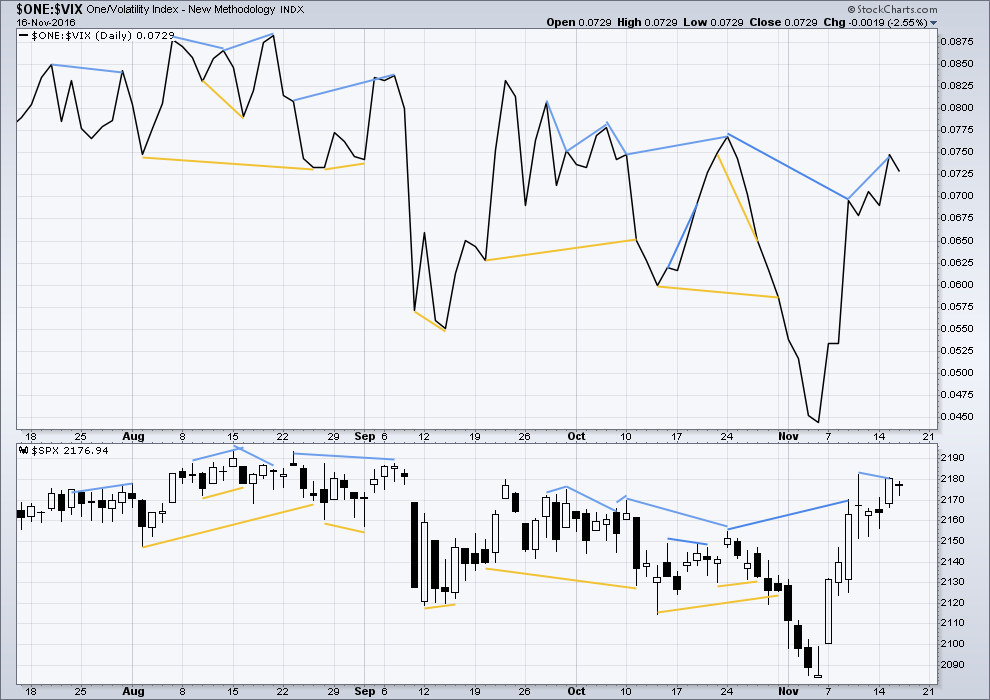
There are a few instances of multi day divergence between price and inverted VIX noted here. Bearish divergence is blue. Bullish divergence is yellow. It appears so far that divergence between inverted VIX and price is again working to indicate short term movements spanning one or two days. While this seems to be working more often than not, it is not always working. As with everything in technical analysis, there is nothing that is certain. This is an exercise in probability.
There is still some hidden bearish divergence between price and inverted VIX: inverted VIX has made a reasonable new high this week, but price has not. This indicates weakness to upwards movement from price. This divergence may be followed by one or two days of downwards movement. It will only be considered to have failed if price makes a new high above the prior high of the 10th of November.
This divergence is considered today to still be in effect. It has been followed now by one small red daily candlestick completing an inside day, and it may be followed by one more day of downwards movement before it is resolved.
BREADTH – AD LINE
Click chart to enlarge. Chart courtesy of StockCharts.com.
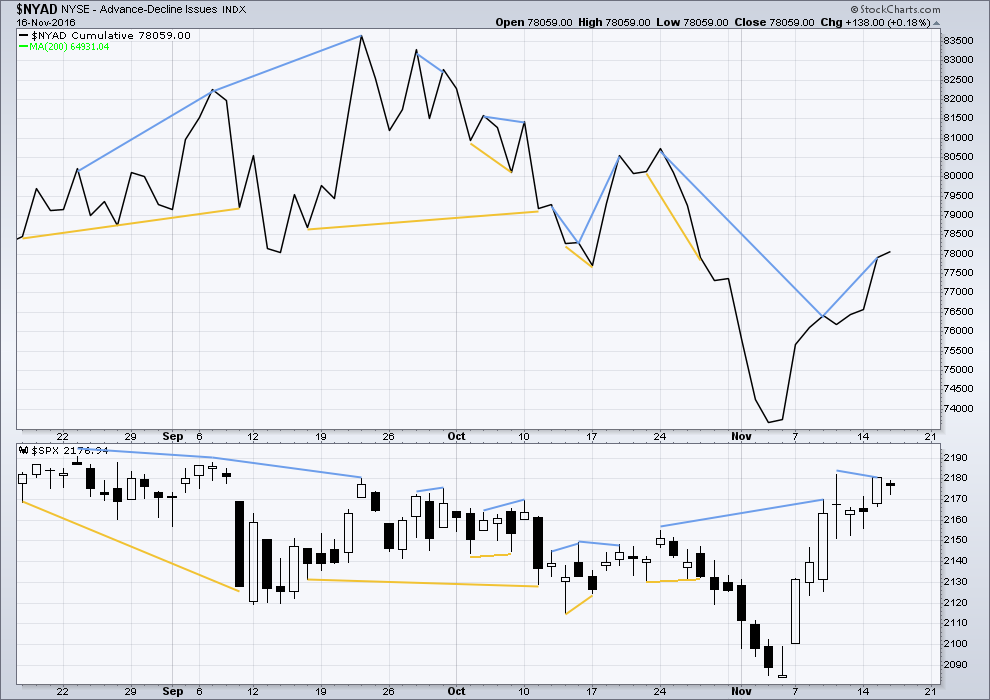
Short term bullish and bearish divergence is again working between price and the AD line to show the direction for the following one or two days.
There is still hidden bearish divergence between price and the AD line: the AD line has this week made a new high, but price has not made a new high above the prior high of the 10th of November. This indicates weakness in upwards movement from price. It may be followed by one or two days of downwards movement. This divergence will only be considered to have failed if price makes a new high tomorrow.
At this stage, this divergence is still in effect because price has not made a new high. A small red doji may be interpreted as one day of downwards movement. A second day of downwards movement may also follow now.
Price moved sideways today, with volume more in support of downwards than upwards movement. But the AD line increased to a new high today. This single day divergence suggests further weakness to price, and it is also interpreted as bearish.
BREADTH – MCCLELLAN OSCILLATOR
Click chart to enlarge. Chart courtesy of StockCharts.com.
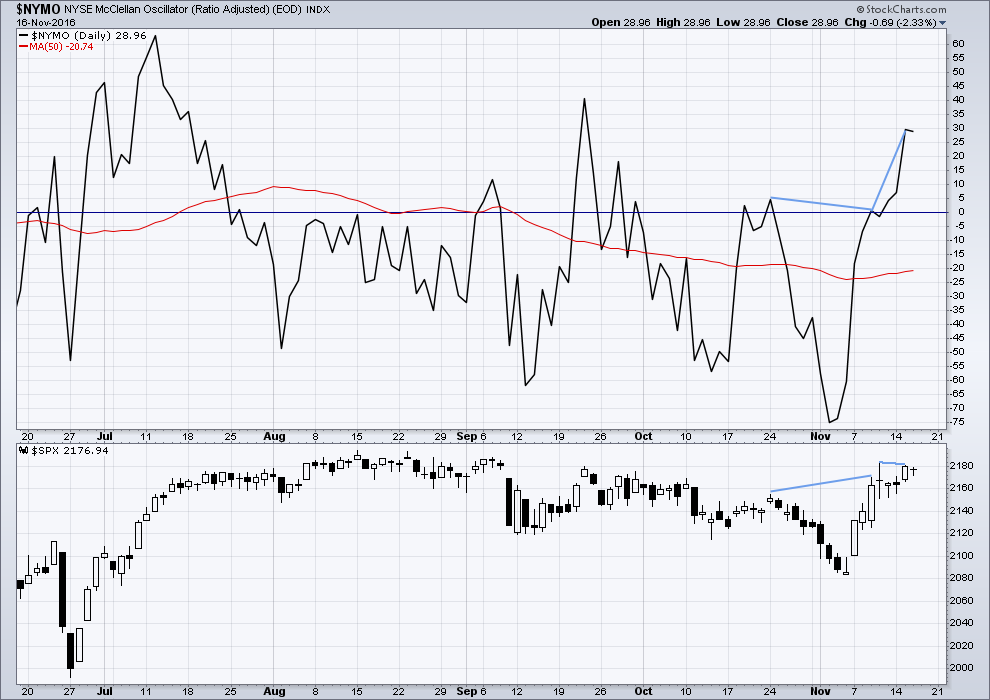
The McClellan Oscillator is now extreme (below 60). On its own this is not an indicator of a low, but it is a warning that this market is oversold. The McClellan Oscillator today is at -73.44.
On the 21st August, 2015, the McClellan Oscillator reached a similar point of -71.56. Price found a low the next session, 104 points below the closing price of the 21st August. This very extreme reading for the 24th August would have been a strong indicator of a low in place.
On the 11th December, 2015, the McClellan Oscillator reached -80.82. It moved lower the next session to -92.65 and price moved 19 points lower. The extreme reading of 11th December might possibly have led to an expectation of a bigger bounce than the one that occurred, and might have misled analysis into missing the strong fall from 29th December to 20th of January.
The next most recent occasion where this oscillator was extreme was the 8th January, 2016. It reached -66.25 on that date. The low was not found for seven sessions though, on the 20th January 2016, almost 110 points below the closing price of the 8th January. At the low of the 11th February, there was strong bullish divergence with price making new lows and the oscillator making substantially higher lows. This may have been a strong warning of a major low in place.
The most recent occasion of an extreme reading was -75.05 on the 2nd of November. The last low came two days later.
As an indicator of a low this is not it. It is a warning of extreme levels. The next thing to look for would be some divergence with price and this oscillator at lows. Divergence is not always seen at lows, but when it is seen it should be taken seriously. Any reading over 100 should also be taken very seriously.
This indicator will be approached with caution. It is one more piece of evidence to take into account.
There is still short term hidden bearish divergence between price and the McClellan Oscillator this week. While the McClellan Oscillator has made a substantial new high price has not. This indicates weakness in upwards movement from price and may be followed by one or two days of downwards movement. It will only be considered to have failed if price makes a new high tomorrow.
With no new high today this divergence is still in effect. It has now been followed by one red doji candlestick, and it may be followed by one more red daily candlestick before it is resolved.
The McClellan Oscillator is not extreme. There is plenty of room for price to rise.
DOW THEORY
Major lows within the old bull market:
DJIA: 15,855.12 (15th October, 2014) – closed below on 25th August, 2015.
DJT: 7,700.49 (12th October, 2014) – closed below on 24th August, 2015.
S&P500: 1,821.61 (15th October, 2014) – has not closed below this point yet.
Nasdaq: 4,117.84 (15th October, 2014) – has not closed below this point yet.
Major highs within the bear market from November 2014:
DJIA: 17,977.85 (4th November, 2015) – closed above on 18th April, 2016.
DJT: 8,358.20 (20th November, 2015) – closed above this point on the 9th of November, 2016.
S&P500: 2,116.48 (3rd November, 2015) – closed above this point on 8th June, 2016.
Nasdaq: 5,176.77 (2nd December, 2015) – closed above this point on 1st August, 2016.
Dow Theory Conclusion: The transportations indicate an end to the prior bear market. The transportation index confirms a bull market.
This analysis is published @ 06:56 p.m. EST.


I am somewhat concerned that we might be taken by surprise by the market. The top may be very close. I am trying to make an ending diagonal in the SPX with the start at the Feb 2016 low. It would look something like the rough chart below. Just trying to be on guard.
I’ve tried that idea Rodney, and it doesn’t work.
The wave lengths work, but the trend lines don’t converge. It’s a rule for a contracting diagonal that the trend lines converge so this rule is violated. The trend lines for this one diverge.
Also, diagonals like triangles normally adhere very well to their trend lines. This one doesn’t. It looks all wrong.
The idea does work for DJIA though.
I thought I remembered you charting this not so long ago. I sort of forgot though. We can blame that on age and perhaps recent stress. Still, I cannot seem to shake my concern.
Okay, so I’ve just checked all the subdivisions for this idea on the five minute chart. This looks pretty good.
So good in fact I think I’ll be switching it over to my main wave count.
Short term on the five minute chart it looks like one more high for the last fifth wave is needed. When that’s done then a few days of a deep pullback to the 0.618 Fibonacci ratio / support about 2,120 / lilac trend line.
Basically the expectation is the same as the other wave count, but this makes a difference to Fibonacci durations / ratios.
I like it. Hoping Minor 5 is finished though – ready to bail on my short albeit Minor 5 is limited due to Minor 3 being shorter than Minor 1.
True. The limit is 2,213.03.
I’m fairly confident this will turn down, the only question is exactly when.
I like it too. I’ve been working on something quite similar but didn’t know if it complied with all rules. I especially like the Minor 4 triangle. That makes a lot of sense. Well, it looks like I may have gotten out of my long positions a couple of days early. But one of the Vanderbuilt family rules was “Leave the last 10% for somebody else.”
For those who don’t mind going against the larger trend, a good shorting opportunity is present or soon to be present.
Thanks Lara.
Because UVXY is making new lows (on declining volume too) it does look like a good reversal is ahead, it’s just impossible to pick the bottom.
With UVXY ready to turn up, that means S&P should be ready to turn down.
So a wave count that expects a good pullback should be preferred. But I will have an alternate.
My analysis of minor A as a five may have been wrong… although I have an idea I can see which I need to chart…. coming up next.
Minute c fits well as a five wave impulse now on the hourly chart. So far it is 1.19 the length of minor wave A, so it could continue higher. At 2,194 it would reach 1.38 the length of minor A, the maximum common length. But not the maximum allowable convention of 2. That’s at 2,213.
Target still the 0.618 Fibonacci ratio of intermediate wave (1) because this is also support about 2,120 and also the lilac trend line.
Hey. I just got some good news. I inaccurately reported my profit percentage yesterday. After checking my sell order fills and my original buy cost, after commissions and fees etc, I netted a 20.64% profit. Not bad especially for a large trade. A few more of those and I will be back in the black for the year.
Thanks Lara et al.
That’s awesome Rodney! That is indeed a healthy profit.
FYI everybody, Verne is fine. He’s just busy with other stuff.
Good morning everybody! I think Verne is on a break. He sure deserves it. And this shows us how much we all rely on him, including me.
I think minute c is an impulse. As Olga points out, the ending diagonal doesn’t really work anymore. No overlap, and the wave lengths are wrong too.
I’ll get my coffee then put a chart up for you all.
I’m pretty sure if Verne was here he’d be saying this is well overdue for a correction, RTM coming up at least. He’d be buying UVXY. I’m holding onto a small short on DJI.
The Unicorn (UVXY) is making new lows. I am not sure if it is a 52 week low. But it looks like it to me. Where is Vern? AWOL. We need his interpretation / analysis. But I would guess he might be a buyer of volatility now. However, he would hedge it with all sorts of spreads, straddles, etc.
I’m just about to pull the trigger on a small position myself – just awaiting a reversal.
Looking for quick wave c scalp before getting long.
Expanded flat (b) can go 2x (a) so I’m trying to be patient 🙂
Serious Div with Dow atm.
Reversal imminent? As soon as this moves trendline is taken out, its on like Donkey Kong 🙂
Break of 2185.97 now would look like a 5 down 3 up reversal on 1 min chart. Going short there with a stop at todays high.
Could also be counted as an ABC down from todays high with a (relatively) long C wave so still a bit cautious atm. UVXY also not really acting like it should at a reversal point imho (usually shows some divergence).
New position now slightly in profit. Lowered my stop to 2187.30
Volatility could still go lower but this is a good place to start building some positions in UVXY (especially is one is long the mkt or looking for a pullback)
Page 4 of 4.
Page 3 of 4.
Page 2 of 4.
This might work for the current SPX waveforms. This is page 1 of 4
Thanks Rodney, sounds good.
2182.32 invalidation point on the hourly chart has been exceeded at the opening 15 minutes of trading. Revised Main Count should be coming today. However, it does not mean Intermediate (2) is over. Last night Lara wrote:
“If price makes a new high above 2,182.32 tomorrow, before a downwards wave, then my analysis of minor wave A as a five is wrong. There would be two options at that stage: either intermediate wave (2) was over at the low as a quick shallow zigzag labelled minor wave A, or intermediate wave (2) is continuing further as a flat correction. The second option is more likely.”
Look for a move to about 2194 before we turn down to Minor C of Intermediate (2) near 2120-2135 range.
Perhaps just premature labelling of the rising wedge. Seems to be quite a bit of weakness in this move up. (i) & (iv) not overlapping though so there is likely a better way to label this move as complex.