
S&P 500: Elliott Wave and Technical Analysis | Charts – April 2, 2020
A consolidation continues as expected this week. Analysis of bounces within bear markets gives some indication of what to look for to identify a high.
Summary: A correction may continue this week and possibly into next week. It may be shallow if it continues to find resistance at the lower edge of the multi-year channel. A target for it to end is about 2,651.
Thereafter, the downwards trend may resume with strength.
Alternatively, it is possible that the correction is over although this has a lower probability. This possibility is outlined in the second hourly chart below.
The biggest picture, Grand Super Cycle analysis, is here.
Last monthly charts are here. Video is here. Members are encouraged to view all three monthly charts. The third is much more bearish than this main wave count and remains a valid possibility.
ELLIOTT WAVE COUNTS
WEEKLY CHART
Click chart to enlarge.
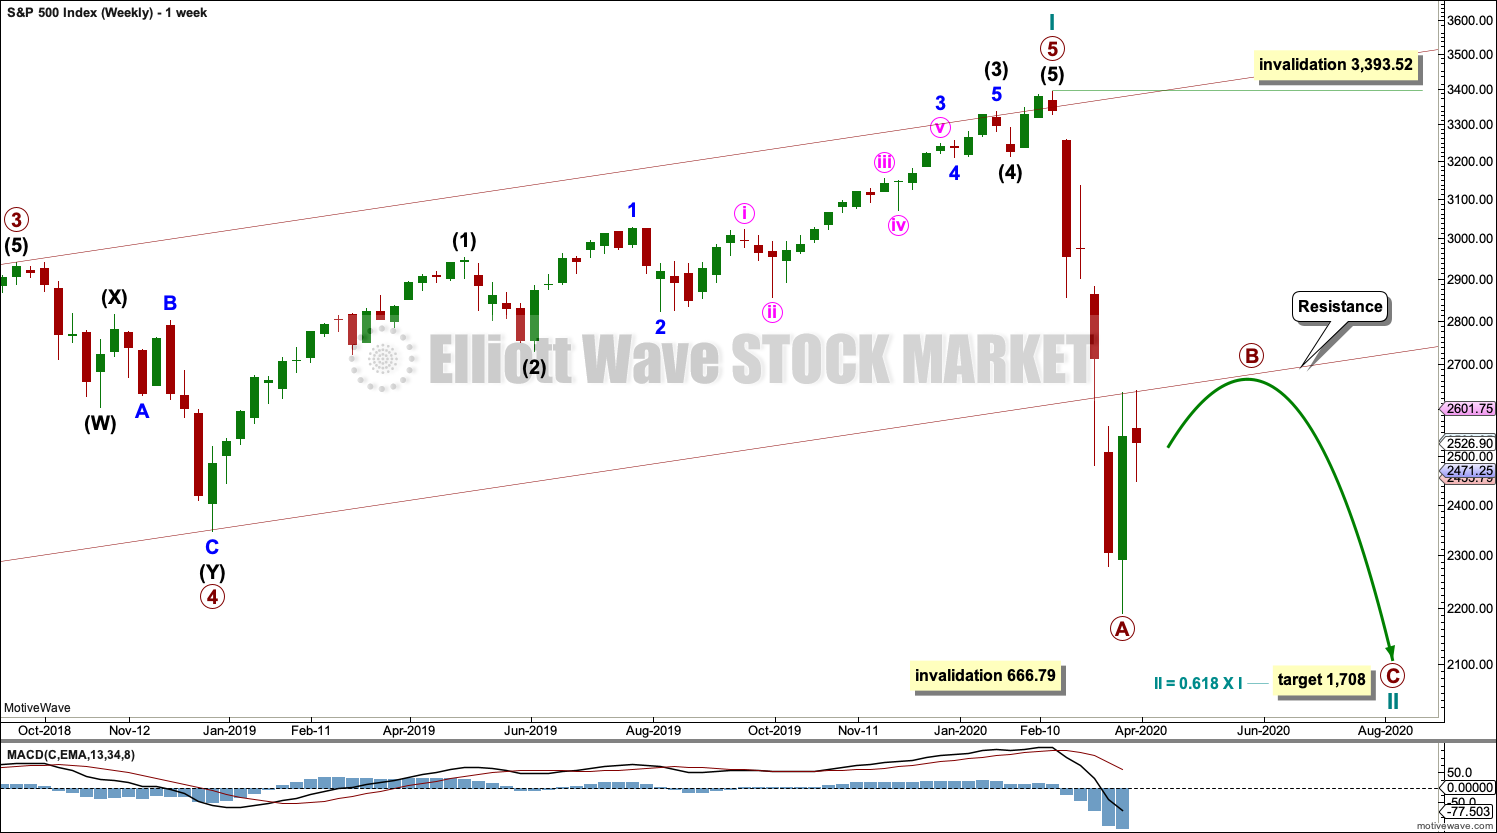
The channel is now breached by a full weekly candlestick below and not touching the lower edge. Further confidence in this wave count may be had. The lower edge of this channel is continuing so far to provide resistance.
Price is now below the 0.382 Fibonacci ratio of cycle wave I at 2,352. The structure of cycle wave II may need further to go to complete. The next Fibonacci ratio at 0.618 is now a preferred target for cycle wave II to end.
Cycle wave II would most likely subdivide as a zigzag; thus far that looks like what it is unfolding. When primary waves A and B may both be complete, then the target may be calculated using a Fibonacci ratio between primary waves A and C. At that stage, the final target may change or widen to a zone.
Cycle wave II may not move beyond the start of cycle wave I below 666.79.
DAILY CHART
Click chart to enlarge.
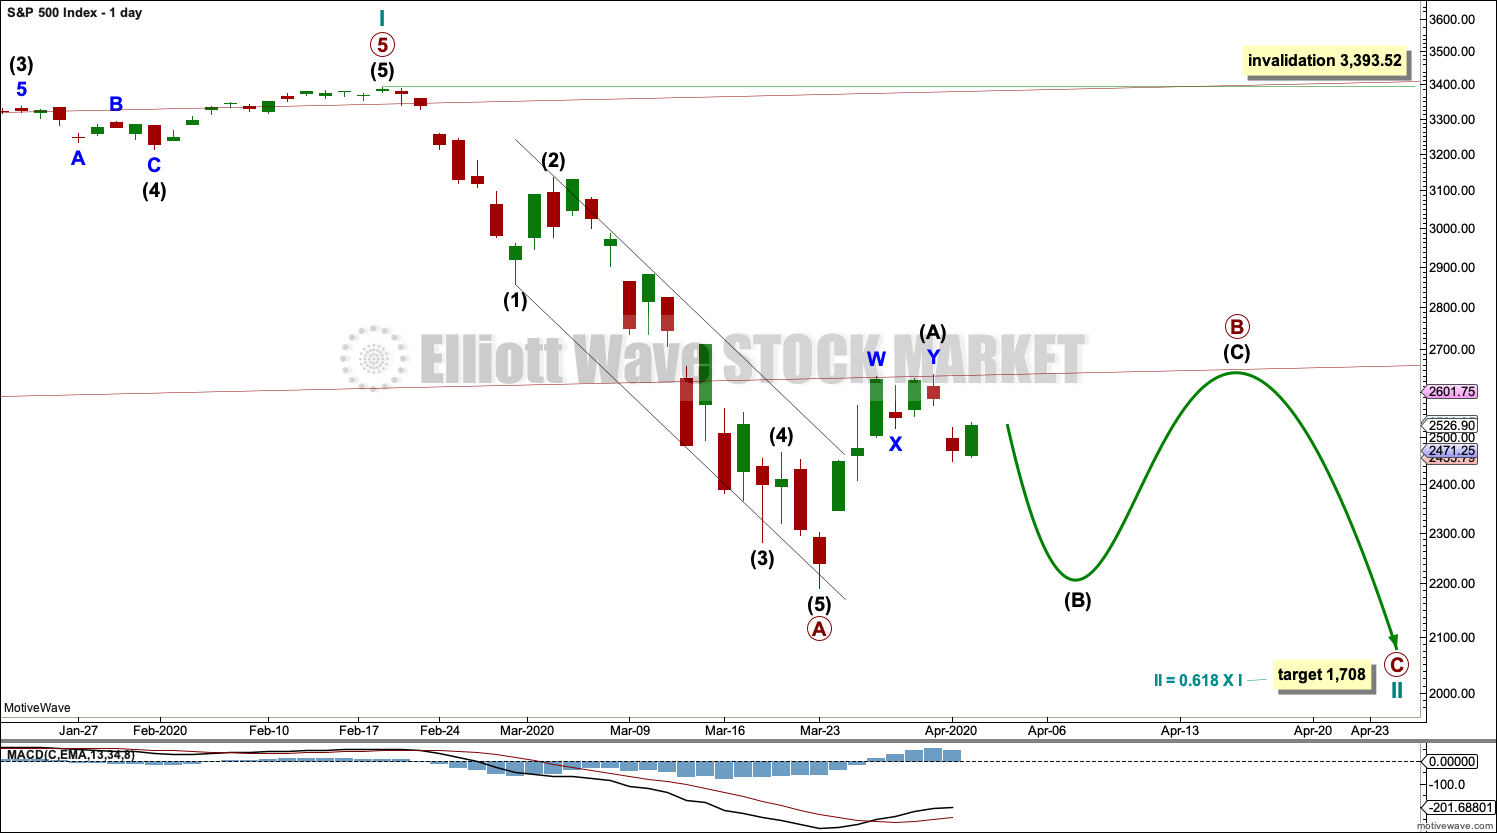
Draw the wide maroon trend channel carefully: draw the first trend line from the end of primary wave 1 at 2,093.55 (December 26, 2014), to the end of primary wave 3 at 2,940.91 (September 21, 2018), then place a parallel copy on the end of primary wave 2 at 1,810.10 (February 11, 2016). The channel is fully breached indicating a trend change from the multi-year bull trend to a new bear trend. The lower edge may now be an important line of resistance. If resistance at this line holds, then primary wave B may end close to the 0.382 Fibonacci ratio of primary wave A at 2,651.
Cycle wave II may subdivide as any Elliott wave corrective structure except a triangle. It would most likely be a zigzag. Primary wave A may be a complete five wave impulse. Primary wave B may not move beyond the start of primary wave A above 3,393.52.
HOURLY CHART – FLAT
Click chart to enlarge.
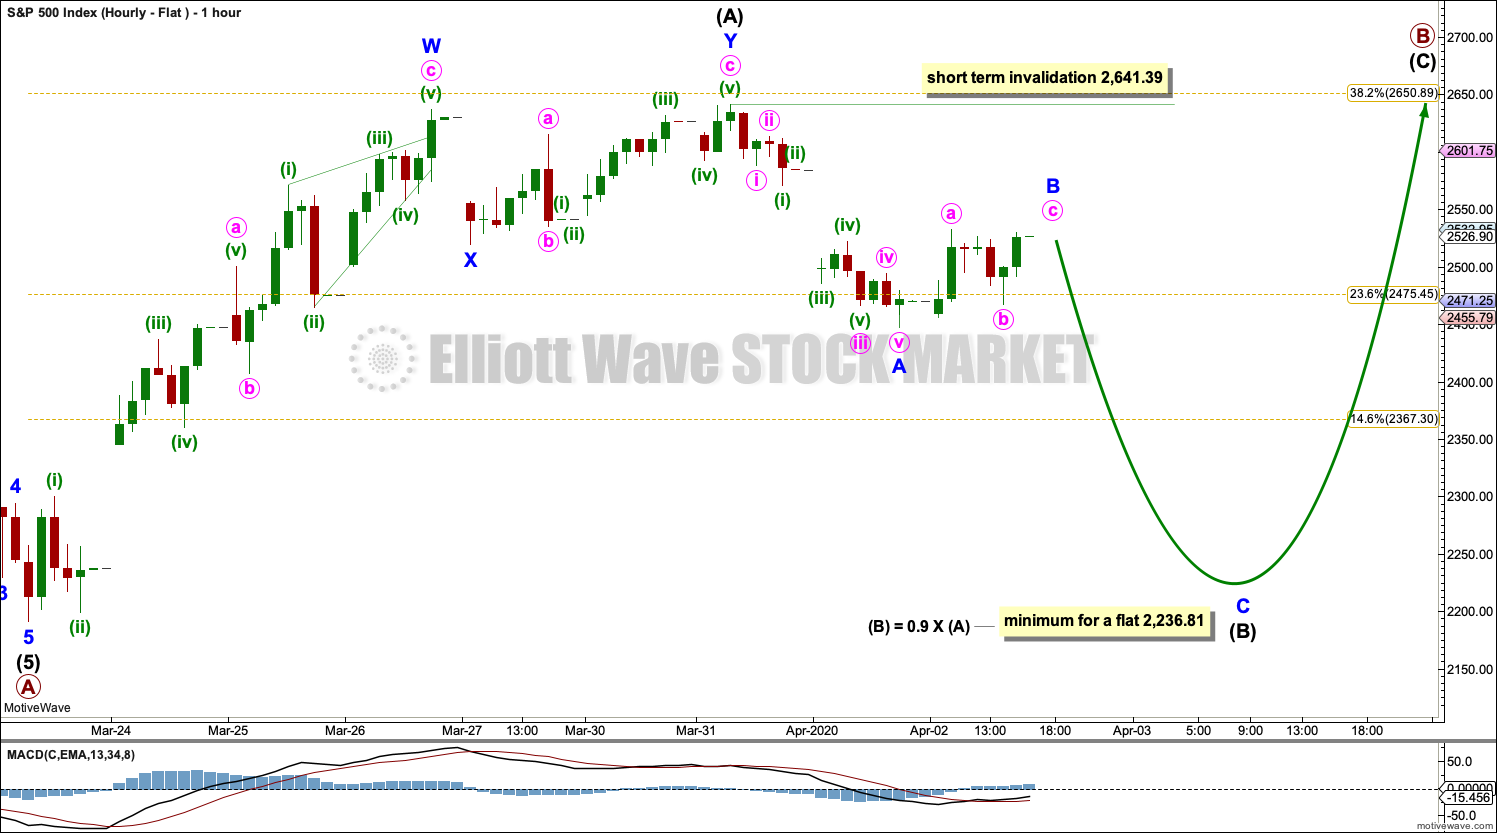
At this stage, it would be clearer to provide separate charts for the various possible structures that primary wave B may be unfolding as.
This first chart considers the possibility that primary wave B may be continuing sideways as a flat correction.
Within a flat correction, intermediate wave (A) must subdivide as a three, a corrective structure. Intermediate wave (A) may be a complete double zigzag.
Within a flat correction, intermediate wave (B) must retrace a minimum 0.9 length of intermediate wave (A) at 2,236.81. Intermediate wave (B) may make a new low below the start of intermediate wave (A) as in an expanded flat. There is no lower invalidation point for this wave count.
HOURLY CHART – TRIANGLE
Click chart to enlarge.
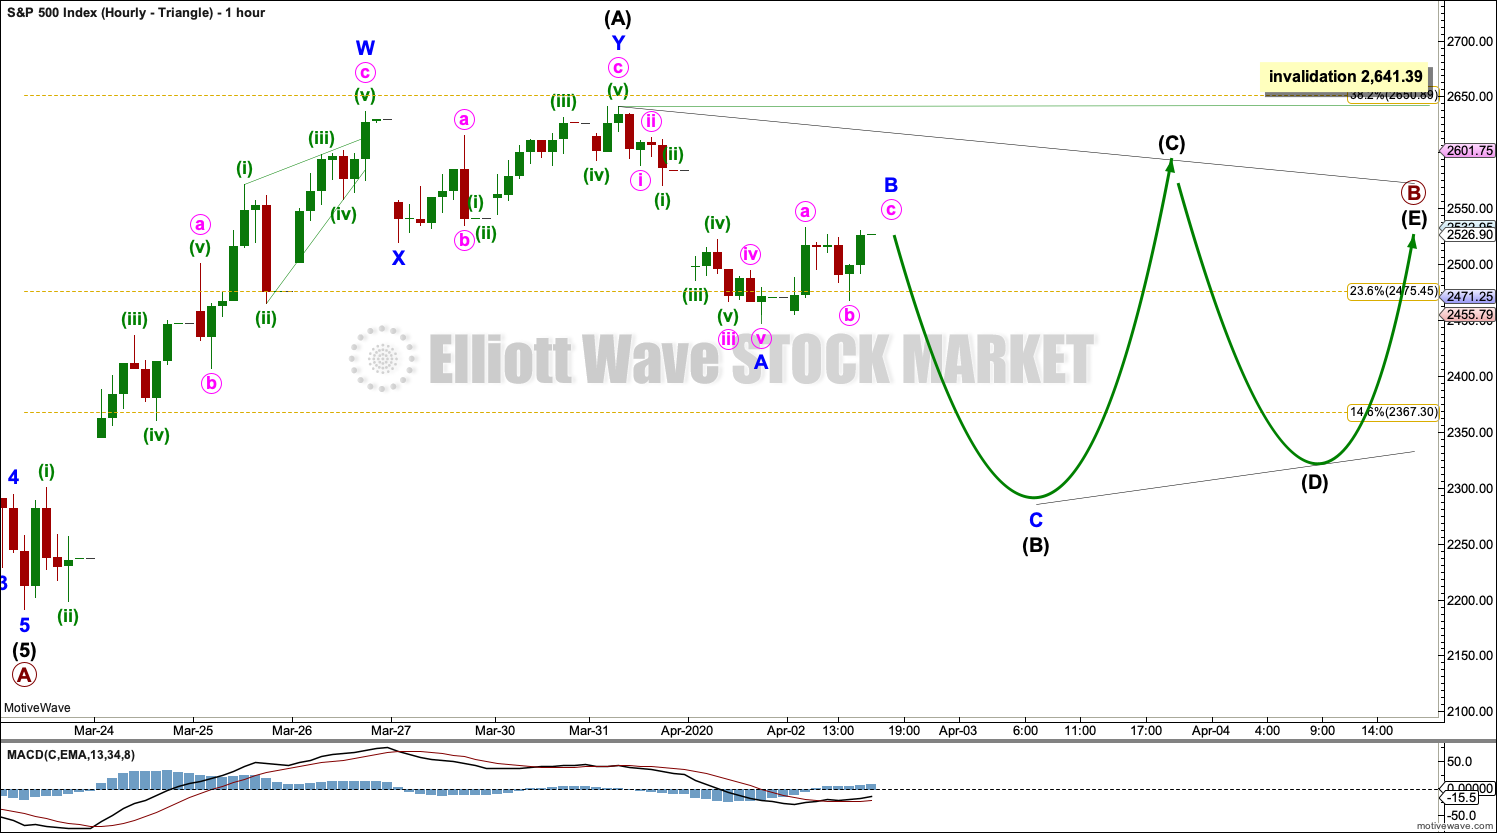
Primary wave B may be subdividing as a triangle.
Within a triangle, four of the five subwaves must subdivide as zigzags or multiple zigzags, with only one subwave being a multiple. Intermediate wave (A) may be complete as a double zigzag.
Three of the four remaining subwaves must subdivide as single zigzags.
Intermediate wave (B) may be subdividing as a zigzag. Within intermediate wave (B), minor wave B may not move beyond the start of minor wave A above 2,641.39.
Intermediate wave (B) may make a new low below the start of intermediate wave (A) as in a running triangle. There is no lower invalidation point for this wave count.
HOURLY CHART – ZIGZAG
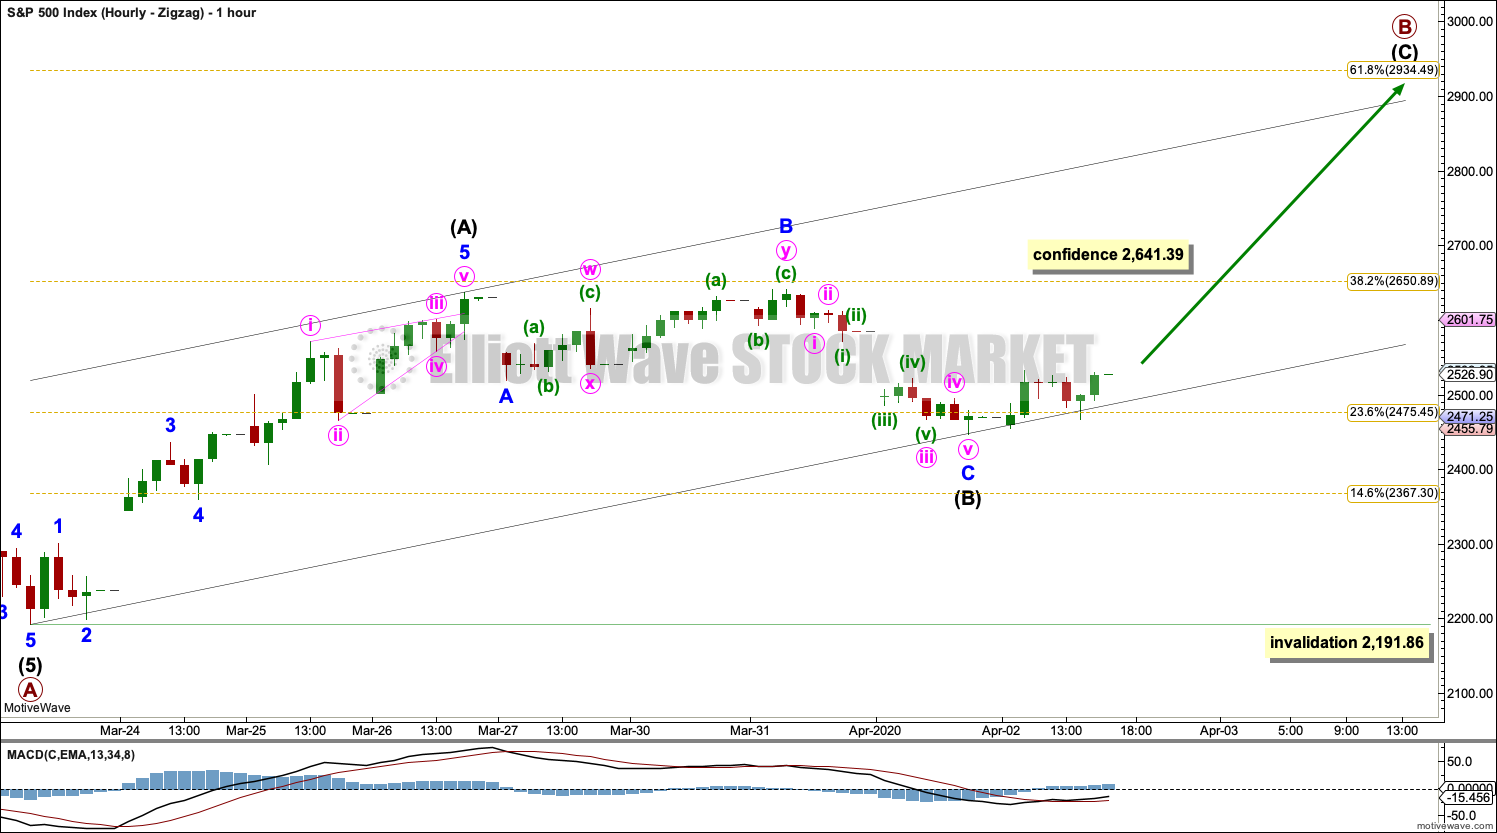
Click chart to enlarge.
It is also possible that primary wave B may subdivide as a zigzag. Within the zigzag, intermediate wave (A) may be a complete impulse. Intermediate wave (B) may be a regular flat correction, which may be complete. If intermediate wave (B) continues lower, then it may not move beyond the start of intermediate wave (A) below 2,191.86.
This wave count would require resistance at the lower edge of the multi-year trend channel to be breached. For this reason it has a lower probability. Assume resistance at that trend line is likely to hold. If it is breached, then this wave count would increase in probability and may become the main hourly wave count.
SECOND HOURLY CHART
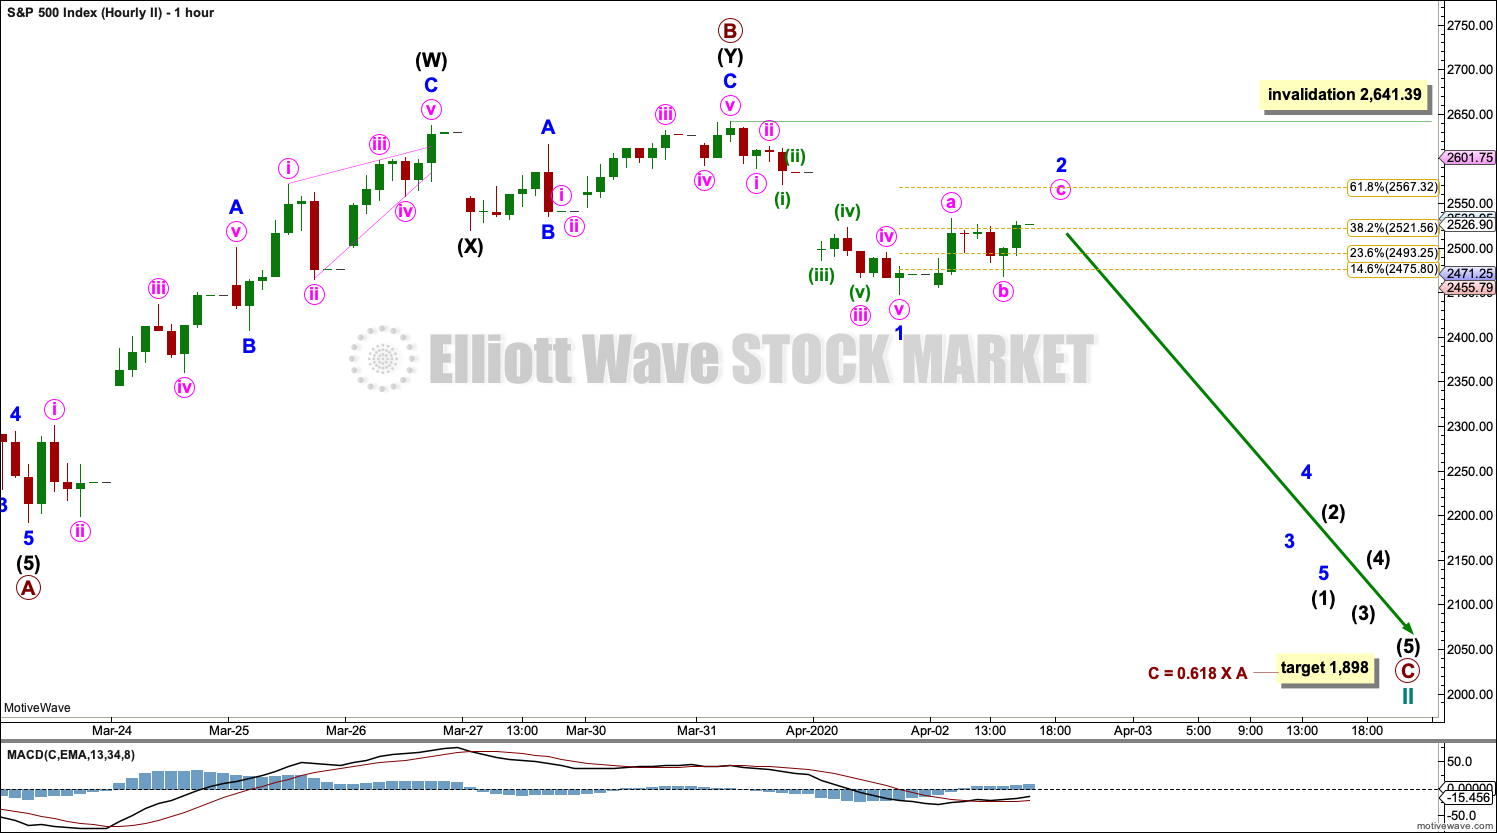
Click chart to enlarge.
By moving the degree of labelling within primary wave B up one, it is possible that it could be over as a brief and shallow double zigzag.
The brevity of this wave count reduces the probability.
A new target is calculated for primary wave C to end.
ALTERNATE DAILY CHART

Click chart to enlarge.
This alternate daily chart follows the Second Alternate Monthly chart published here. Video is here.
By simply moving the degree of labelling in the bull market beginning March 2009 up one degree, it is possible that a Grand Super Cycle trend change occurred on the February 19, 2020.
A correction at Grand Super Cycle degree may be expected to last at least a decade, possibly longer. Corrections for this market tend to be much quicker than bullish moves, and so a fair amount of flexibility is required in expectations for duration of the different degrees.
Grand Super Cycle II would most likely subdivide as a zigzag, although it may be any corrective structure except a triangle. It should begin with a five down at the weekly chart time frame, which would be incomplete.
The first five down on the daily chart is labelled cycle wave I. If this degree of labelling is wrong, it may be too high; it may need to be moved down one degree.
Following cycle wave I, cycle wave II may be complete as a relatively brief and shallow double zigzag. If it continues further as a flat correction, then cycle wave II may not move beyond the start of cycle wave I above 3,393.52.
A target is calculated for cycle wave III to end based upon a common Fibonacci ratio to cycle wave I.
ALTERNATE HOURLY CHART
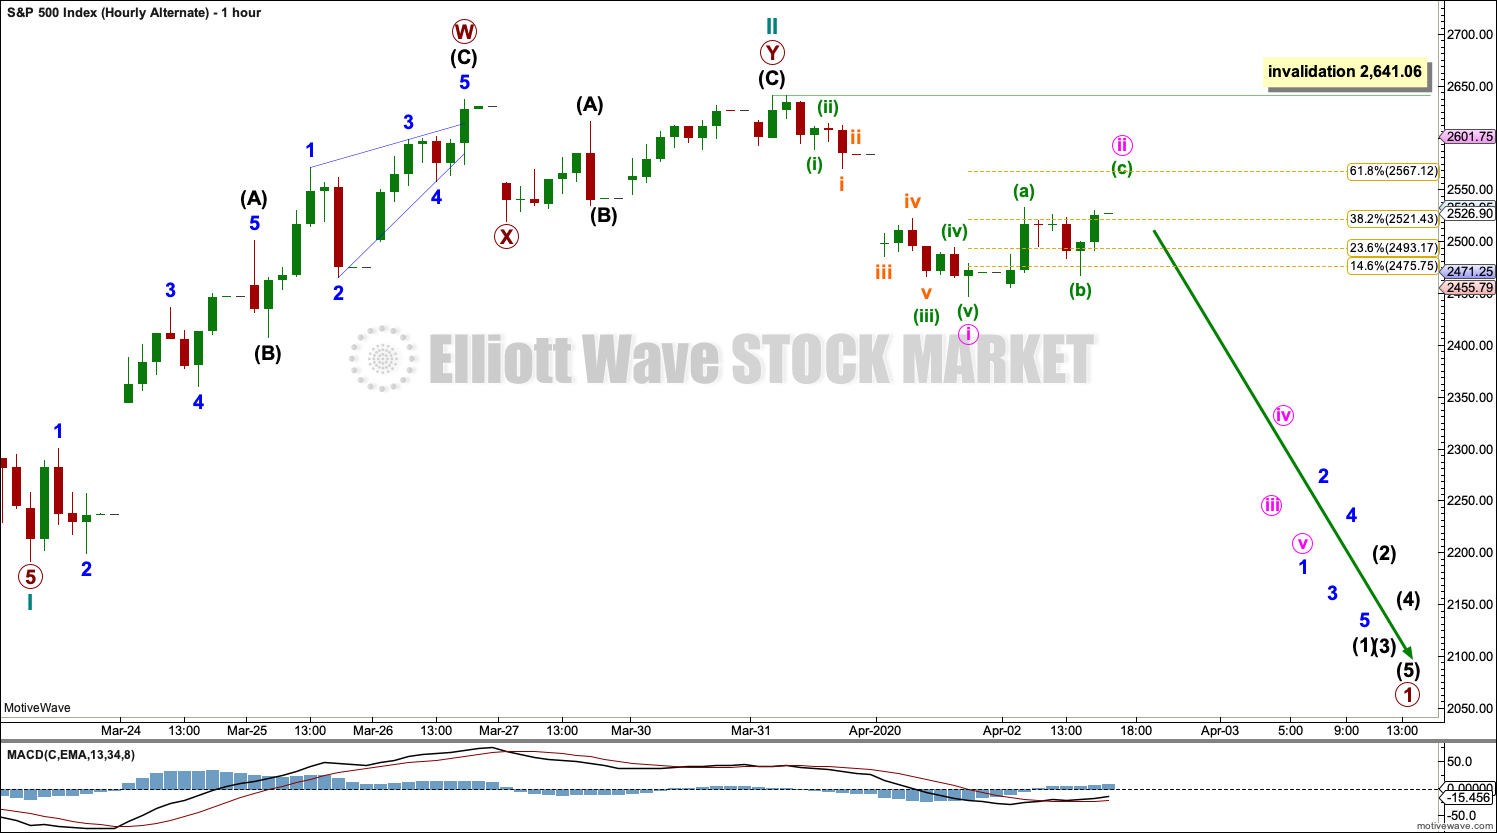
Click chart to enlarge.
Cycle wave II may be a completed double zigzag. Cycle wave III may have begun. Within cycle wave III, no second wave correction may move beyond its start above 2,641.06.
TECHNICAL ANALYSIS
WEEKLY CHART
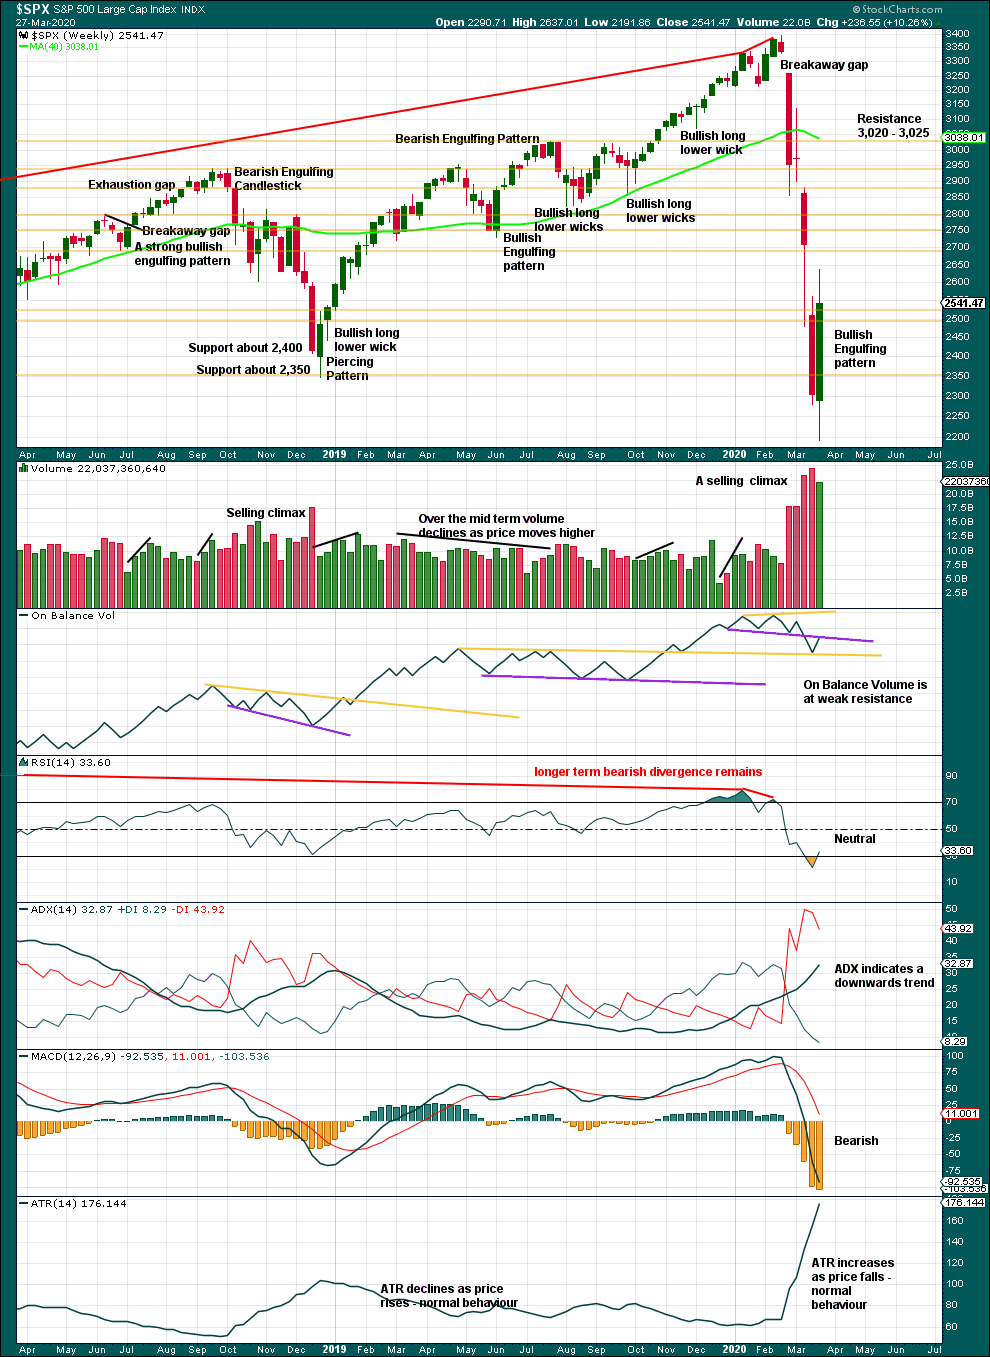
Click chart to enlarge. Chart courtesy of StockCharts.com.
A bounce has arrived within the bear market. It may continue further.
DAILY CHART
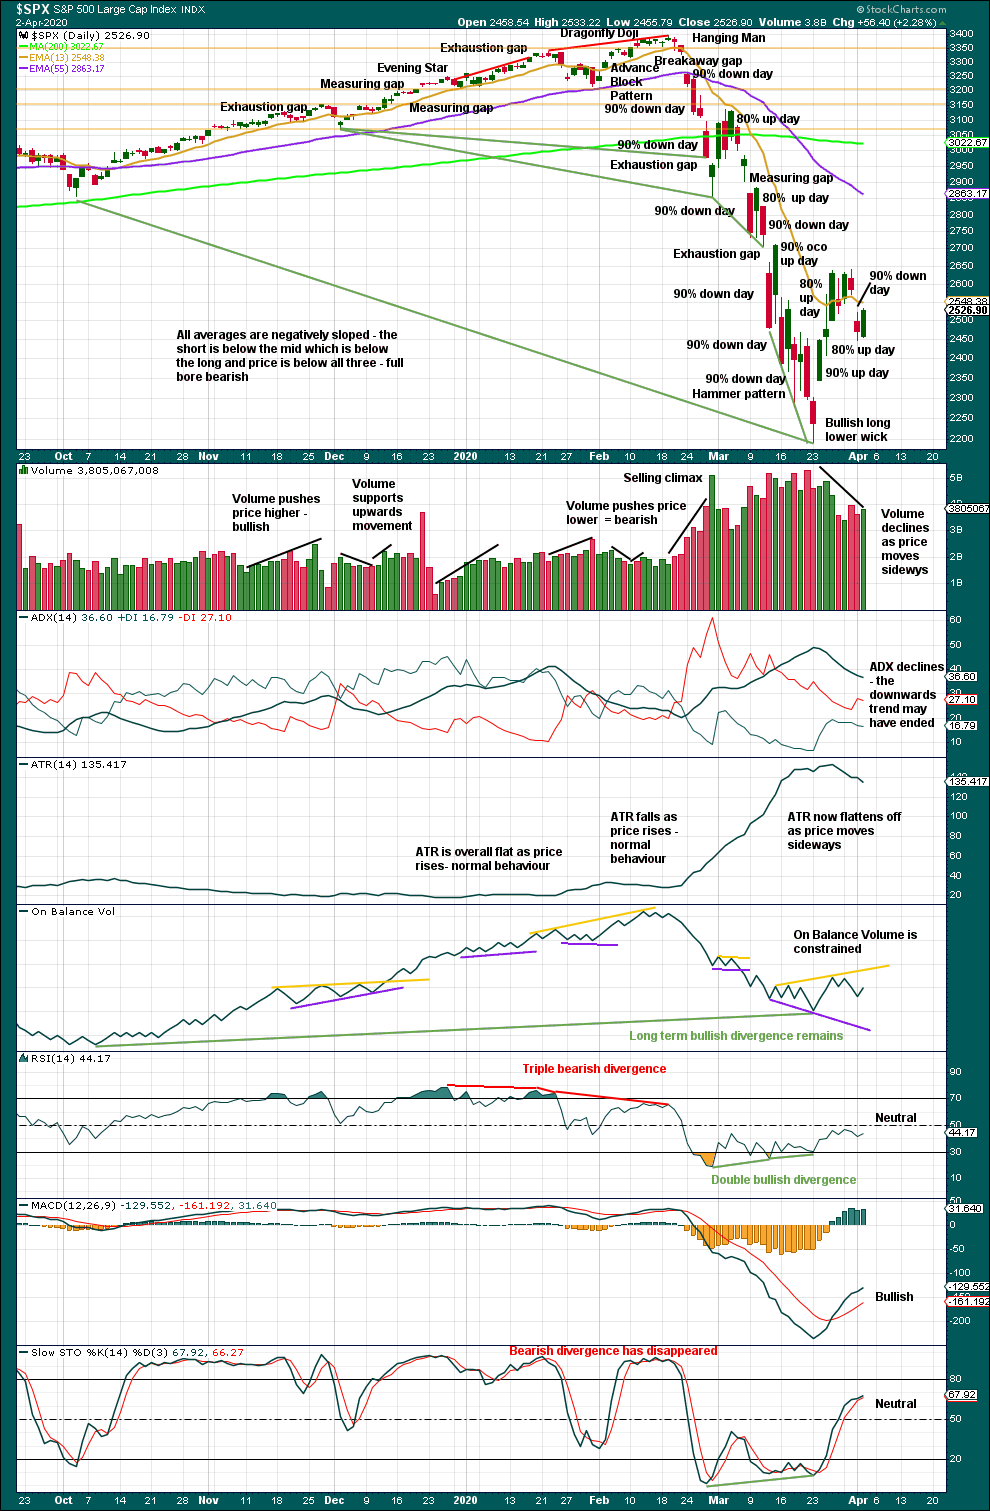
Click chart to enlarge. Chart courtesy of StockCharts.com.
Another 90% downwards day today indicates it is most likely that the bear market is incomplete. It would be highly unusual to see a 90% downwards day so close to a sustainable low.
Volume and range overall continue to decline. So far this movement this week looks like a pause within an ongoing downwards trend.
To see what signals may be looked for to identify a high, the two previous large bear markets will be analysed in end of week analysis. The DotCom crash was analysed last week here with video here.
BREADTH – AD LINE
WEEKLY CHART
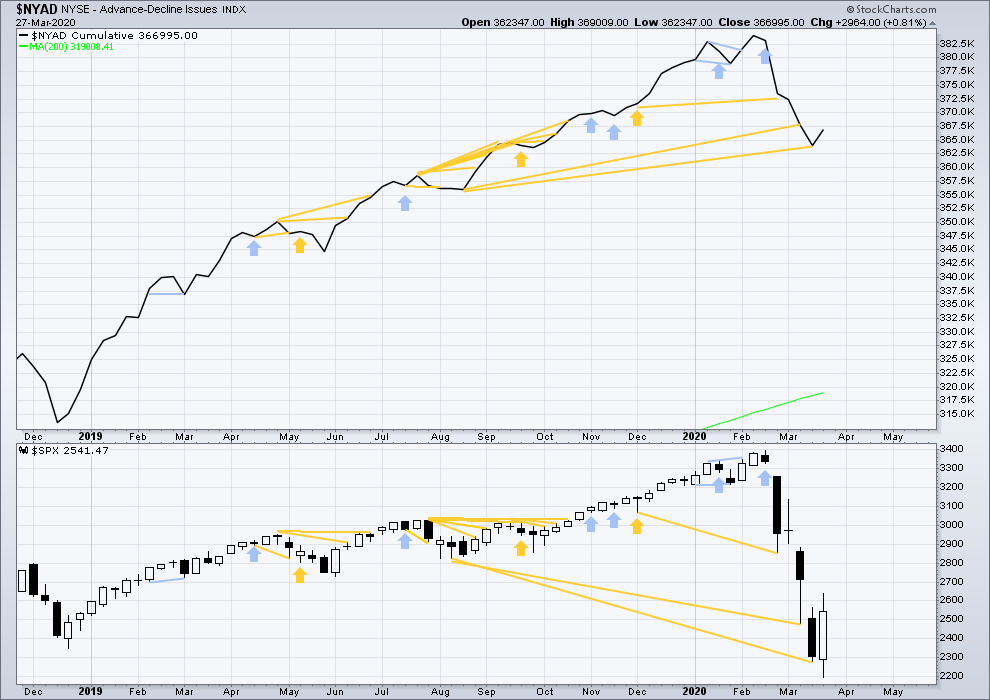
Click chart to enlarge. Chart courtesy of StockCharts.com. So that colour blind members are included, bearish signals will be noted with blue and bullish signals with yellow.
Bear markets from the Great Depression and onwards have been preceded by an average minimum of 4 months divergence between price and the AD line with only two exceptions in 1946 and 1976. With no divergence between the AD line and price at the last all time high, this current bear market now makes a third exception.
In all bear markets in the last 90 years there is some positive correlation (0.6022) between the length of bearish divergence and the depth of the following bear market. No to little divergence is correlated with more shallow bear markets. Longer divergence is correlated with deeper bear markets.
This bear market comes after no bearish divergence. It would more likely be shallow, but this is a statement of probability and not certainty. So far it is slightly more than the 0.382 Fibonacci ratio of the bull market it is correcting (beginning March 2009).
Last week an outside week closes green and the AD line supports upwards movement within the week. There is no new divergence.
Large caps all time high: 3,393.52 on 19th February 2020.
Mid caps all time high: 2,109.43 on 20th February 2020.
Small caps all time high: 1,100.58 on 27th August 2018.
DAILY CHART
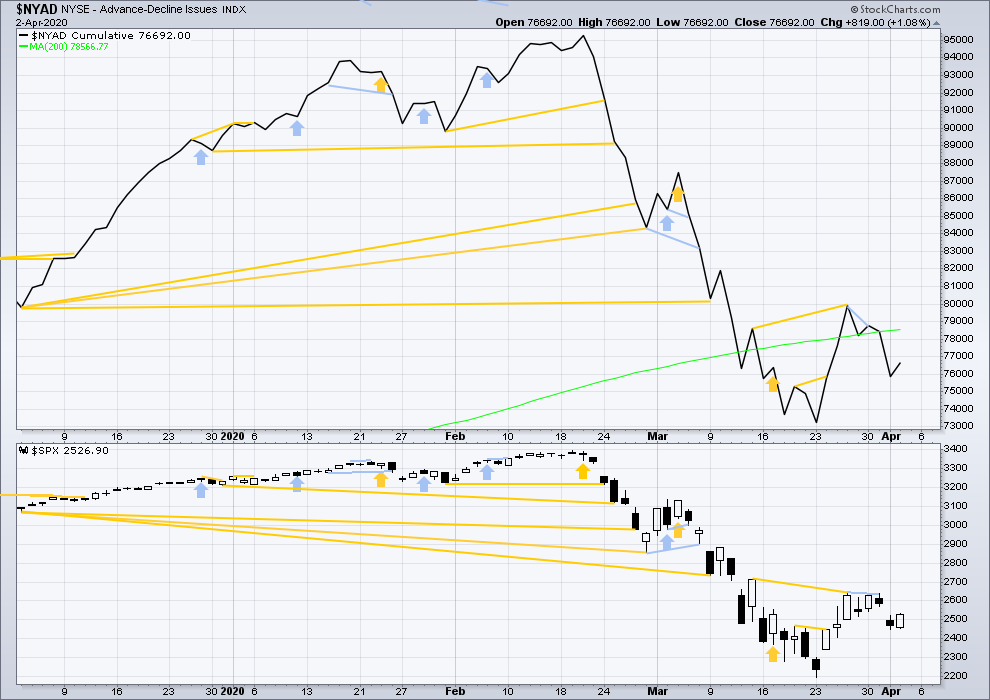
Click chart to enlarge. Chart courtesy of StockCharts.com. So that colour blind members are included, bearish signals will be noted with blue and bullish signals with yellow.
Breadth should be read as a leading indicator.
Today both price and the AD line have moved higher. There is no new short-term divergence.
VOLATILITY – INVERTED VIX CHART
WEEKLY CHART
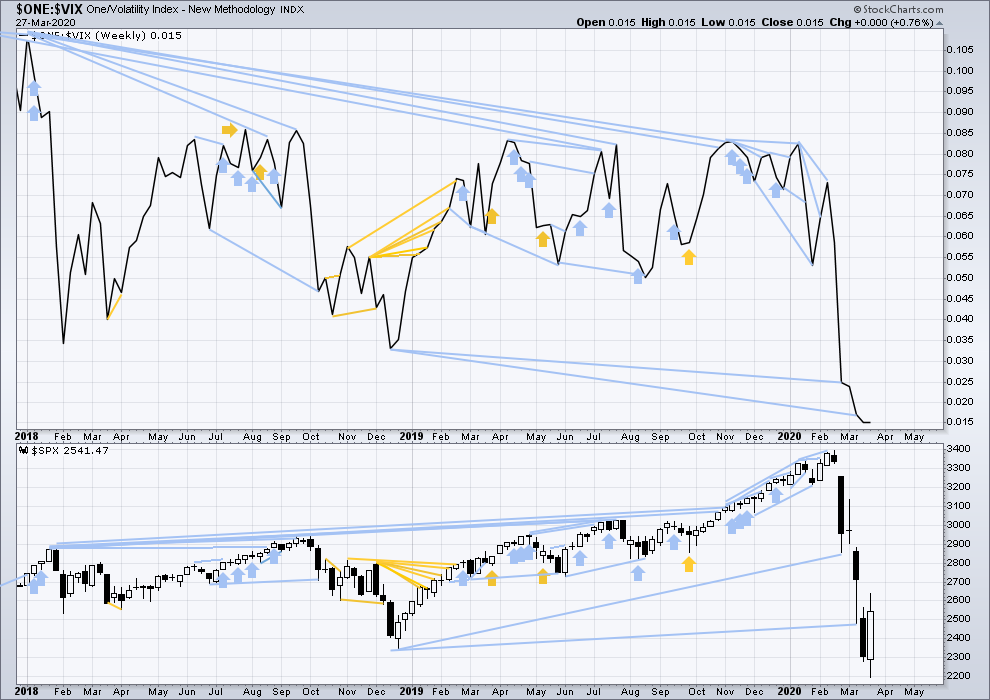
Click chart to enlarge. Chart courtesy of StockCharts.com. So that colour blind members are included, bearish signals will be noted with blue and bullish signals with yellow.
Last week completes an outside week, which has closed green, and inverted VIX is overall flat. There is no new short-term divergence.
DAILY CHART
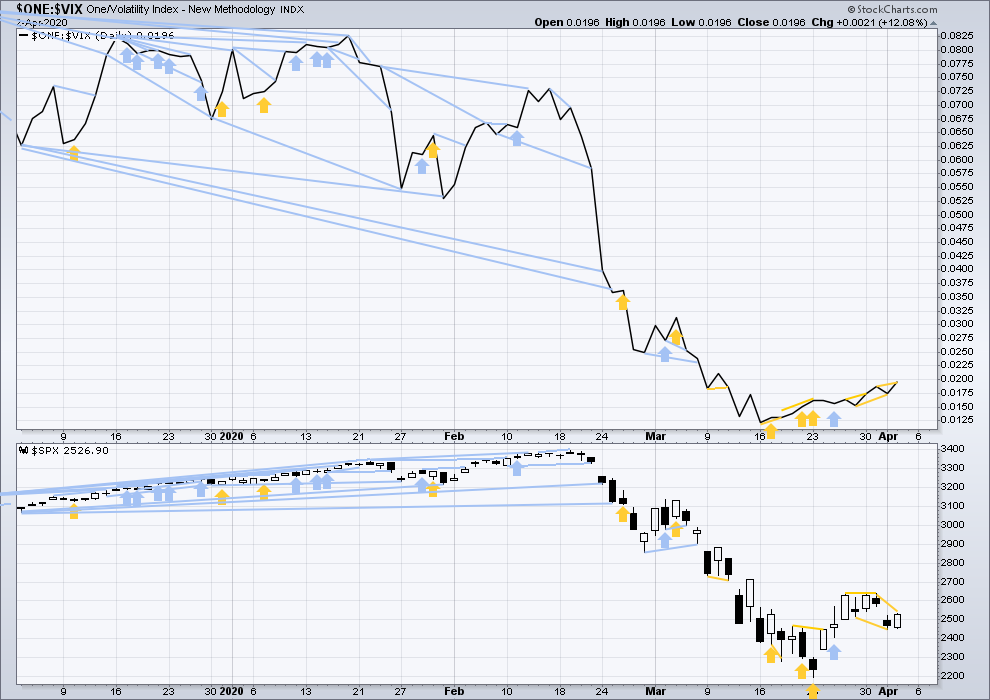
Click chart to enlarge. Chart courtesy of StockCharts.com. So that colour blind members are included, bearish signals will be noted with blue and bullish signals with yellow.
Today both price and inverted VIX have moved higher. Inverted VIX has made a new high above the high two sessions prior, but price has not. This divergence is bullish for the very short term.
DOW THEORY
Dow Theory has confirmed a bear market with the following lows made on a closing basis:
DJIA: 21,712.53 – a close below this point has been made on the March 12, 2020.
DJT: 8,636.79 – a close below this point has been made on March 9, 2020.
Adding in the S&P and Nasdaq for an extended Dow Theory, a bear market has now been confirmed:
S&P500: 2,346.58 – a close below this point has now been made on March 20, 2020.
Nasdaq: 7,292.22 – a close below this point was made on the March 12, 2020.
Published @ 07:32 p.m. EST.
—
Careful risk management protects your trading account(s).
Follow my two Golden Rules:
1. Always trade with stops.
2. Risk only 1-5% of equity on any one trade.
—
New updates to this analysis are in bold.