
S&P 500: Elliott Wave and Technical Analysis | Charts – March 26, 2020
Summary: Primary wave B may have begun. It may be either a quick sharp bounce or a long lasting sideways consolidation. Targets are 2,651 or 2,934.
For the short term, strength in today’s upwards movement suggests it may continue tomorrow. Use the channel on the hourly chart. Expect price to keep rising and use the main hourly chart while price remains within the channel. If the channel is breached by downwards movement (not sideways), expect a pullback has begun and use the first alternate hourly chart.
The biggest picture, Grand Super Cycle analysis, is here.
Last monthly charts are here. Video is here. Members are encouraged to view all three monthly charts. The third is much more bearish than this main wave count and remains a valid possibility.
ELLIOTT WAVE COUNTS
WEEKLY CHART
Click chart to enlarge.
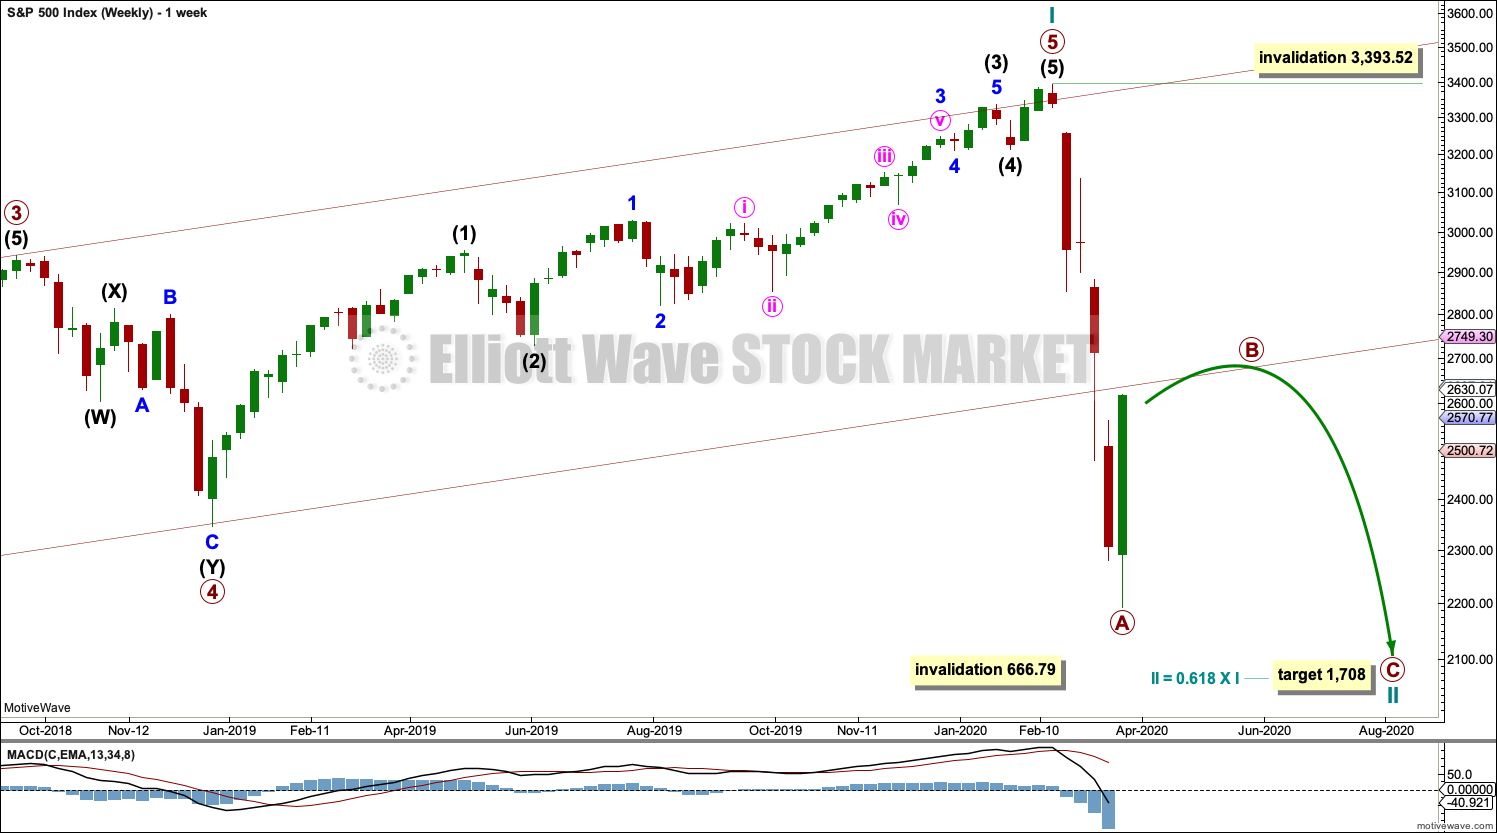
The channel is now breached by a full weekly candlestick below and not touching the lower edge. Further confidence in this wave count may be had.
Price is now below the 0.382 Fibonacci ratio of cycle wave I at 2,352. The structure of cycle wave II may need further to go to complete. The next Fibonacci ratio at 0.618 is now a preferred target for cycle wave II to end.
Cycle wave II would most likely subdivide as a zigzag; thus far that looks like what it is unfolding. When primary waves A and B may both be complete, then the target may be calculated using a Fibonacci ratio between primary waves A and C. At that stage, the final target may change or widen to a zone.
It is possible now that cycle wave II could be complete. This is outlined in a second alternate hourly chart below; in analysis of that chart I have outlined what needs to be seen for confidence in the alternate wave count.
Cycle wave II may not move beyond the start of cycle wave I below 666.79.
DAILY CHART
Click chart to enlarge.
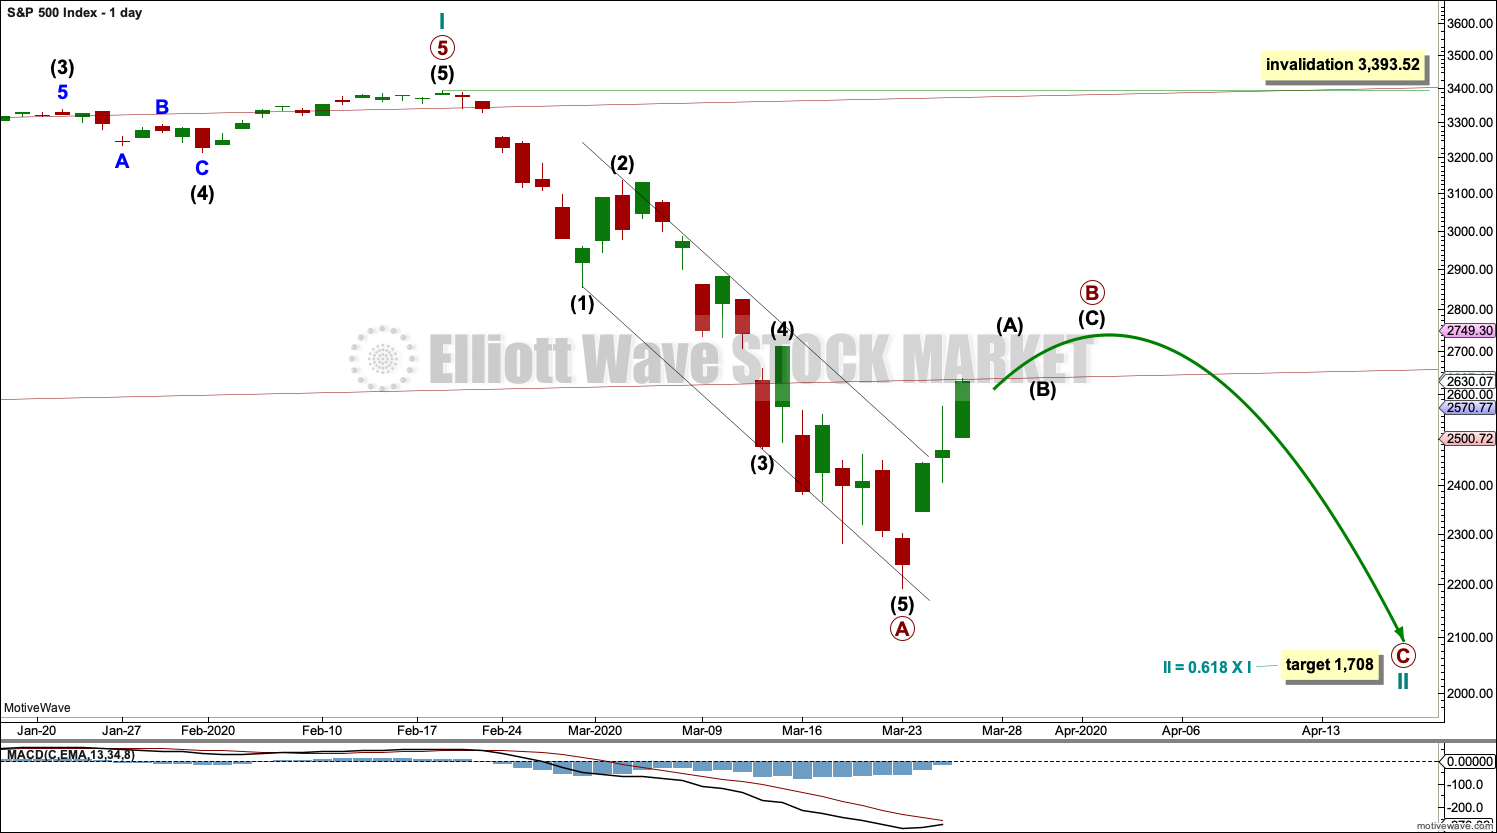
Redraw the wide maroon trend channel carefully: draw the first trend line from the end of primary wave 1 at 2,093.55 (December 26, 2014), to the end of primary wave 3 at 2,940.91 (September 21, 2018), then place a parallel copy on the end of primary wave 2 at 1,810.10 (February 11, 2016). The channel is fully breached indicating a trend change from the multi-year bull trend to a new bear trend.
Cycle wave II may subdivide as any Elliott wave corrective structure except a triangle. It would most likely be a zigzag. Primary wave A may be a complete five wave impulse. Primary wave B may not move beyond the start of primary wave A above 3,393.52.
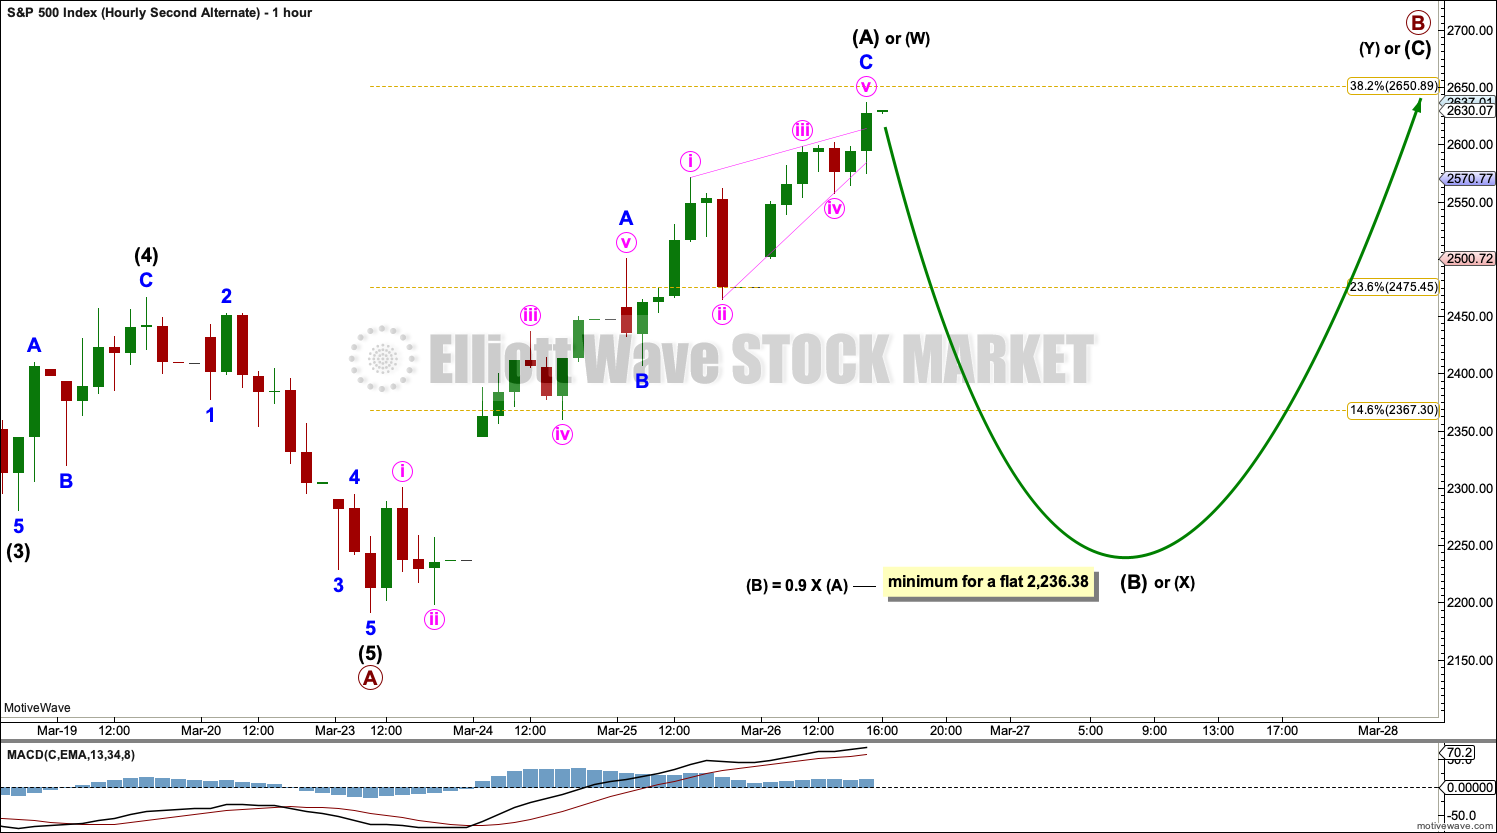
HOURLY CHART
Click chart to enlarge.
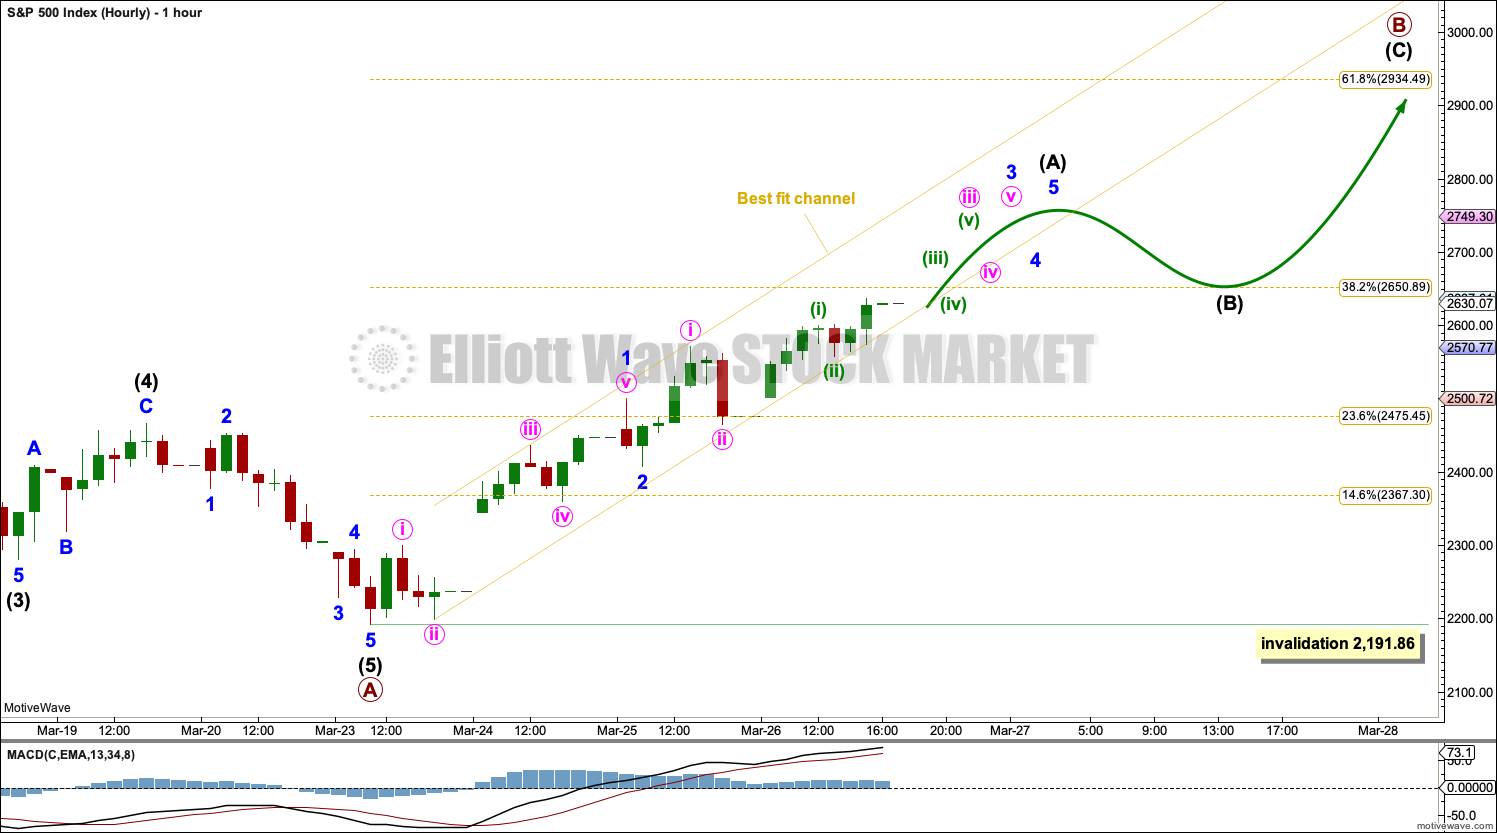
Primary wave B may subdivide as any one of more than 23 possible Elliott wave corrective structures. B waves exhibit the greatest variety in structure and price behaviour. Primary wave B may be a quick sharp bounce as in a single or multiple zigzag, or it may be a time consuming sideways consolidation as in a flat, combination or triangle.
This main hourly wave count considers the possibility that primary wave B may be subdividing as a zigzag. If primary wave B subdivides as a zigzag, then intermediate wave (A) must subdivide as a five wave motive structure, most likely an impulse.
Within impulses the S&P most commonly exhibits extended third waves. This wave count expects that minor wave 3 within intermediate wave (A) is extending. When third waves extend, they show subdivisions at higher time frames.
If primary wave A is correctly analysed as a five wave impulse, then primary wave B may not move beyond its start above 3,393.52.
FIRST ALTERNATE HOURLY CHART
Click chart to enlarge.
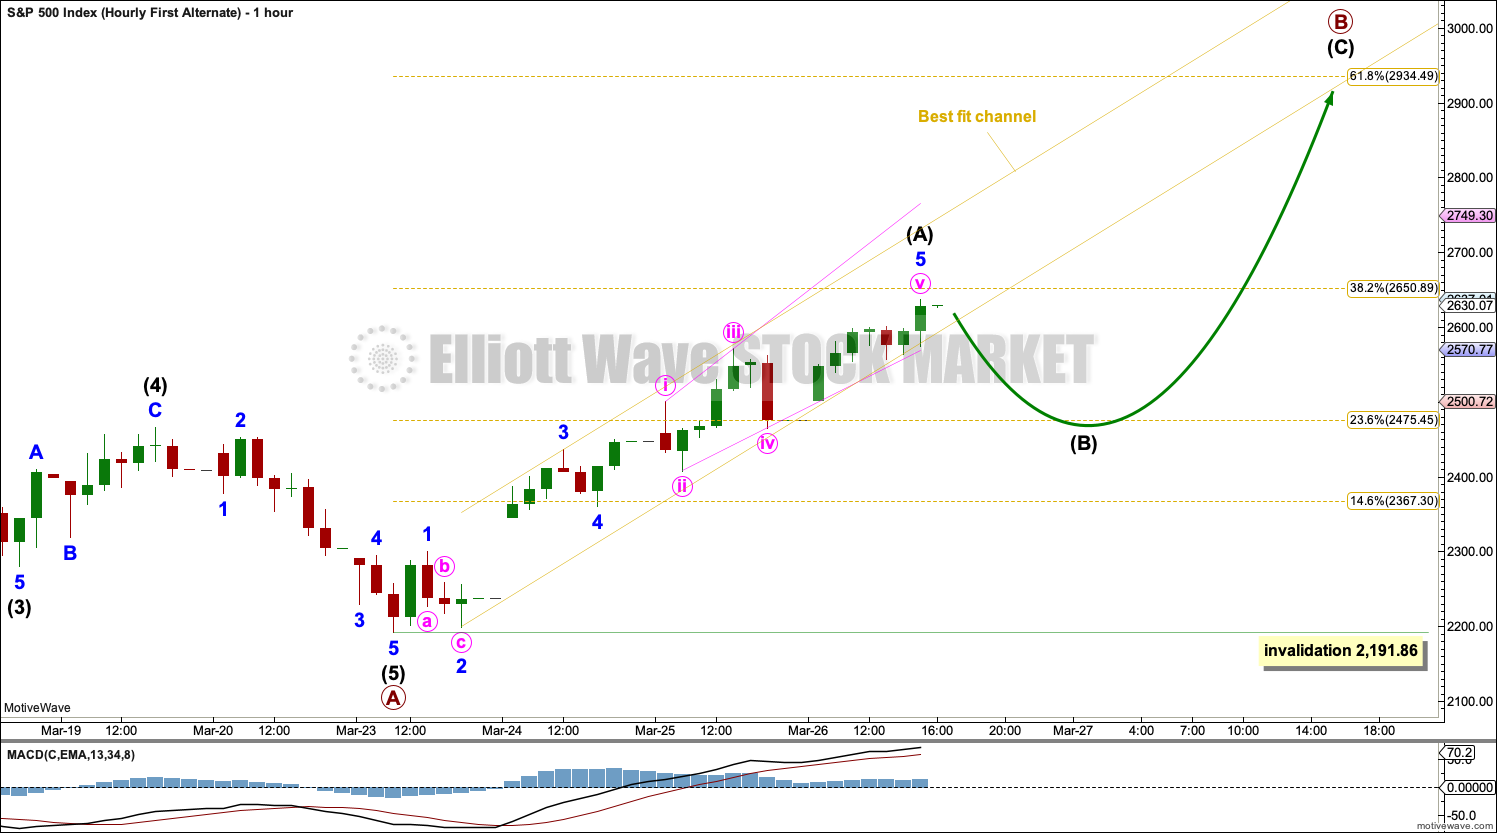
Thank you to Arnaud for publishing this idea in comments.
It is possible today that intermediate wave (A) could be over at today’s high. Within intermediate wave (A), minor wave 5 is an ending expanding diagonal that meets all Elliott wave rules. Within the diagonal, minute wave v may continue higher and this wave count would remain valid.
Use the best fit channel. Only use this wave count if the channel is breached by downwards movement.
Further confidence may come with a new short-term swing low below 2,557.87.
If intermediate wave (A) has subdivided as a five wave structure, then intermediate wave (B) may not move beyond its start below 2,191.86.
SECOND ALTERNATE HOURLY CHART
Click chart to enlarge.
It is also possible that primary wave B may subdivide as a flat, combination or triangle. This second alternate wave count considers those possibilities in the one chart.
If primary wave B subdivides as any one of a flat, combination or triangle, then the first wave up within it should subdivide as a three, most likely a zigzag. That may again be complete. Within the zigzag, minor wave A may be a complete impulse and minor wave C may be a complete ending contracting diagonal.
If primary wave B subdivides as a flat correction, then within it intermediate wave (A) may now be complete. Intermediate wave (B) would need to retrace a minimum 0.9 length of intermediate wave (A). Intermediate wave (B) may make a new low below the start of intermediate wave (A) at 2,191.86 as in an expanded flat. There is no lower invalidation point.
If primary wave B subdivides as a triangle, then within it intermediate wave (A) may now be a complete zigzag. Intermediate wave (B) may not unfold lower as a single or multiple zigzag; there is no minimum length required for intermediate wave (B) within a triangle. Intermediate wave (B) may make a new low below the start of intermediate wave (A) at 2,191.86 as in a running triangle. There is no lower invalidation point.
If primary wave B subdivides as a double combination, then the first structure in a combination may now be complete, a zigzag labelled intermediate wave (W). The double may now be joined by a three in the opposite direction to be labelled intermediate wave (X), which would most likely subdivide as a zigzag. There is no minimum requirement for intermediate wave (X) and it may make a new low below the start of intermediate wave (W). There is no lower invalidation point.
TECHNICAL ANALYSIS
WEEKLY CHART

Click chart to enlarge. Chart courtesy of StockCharts.com.
A 35% drop in price (high to low) no longer has precedent within the larger bull market.
At the weekly chart level, conditions are now oversold; it is now more possible that a bounce or consolidation may arrive.
DAILY CHART

Click chart to enlarge. Chart courtesy of StockCharts.com.
There are now eight 90% downwards days in this strong downwards movement.
At the last low:
– RSI reached deeply oversold and now exhibits short-term double bullish divergence with price.
– Stochastics reached oversold and now exhibits short-term bullish divergence with price.
– On Balance Volume exhibited bullish divergence with price, although short-term bullish divergence disappeared.
Now a 90% upwards day and two back to back 80% upwards days give strong confidence that a low is in place. It may not be the end of the bear market though; the Elliott wave structure may not be complete.
Today a slight decline in volume may support one of the alternate hourly Elliott wave counts. A bullish signal from On Balance Volume supports the main hourly Elliott wave count.
BREADTH – AD LINE
WEEKLY CHART
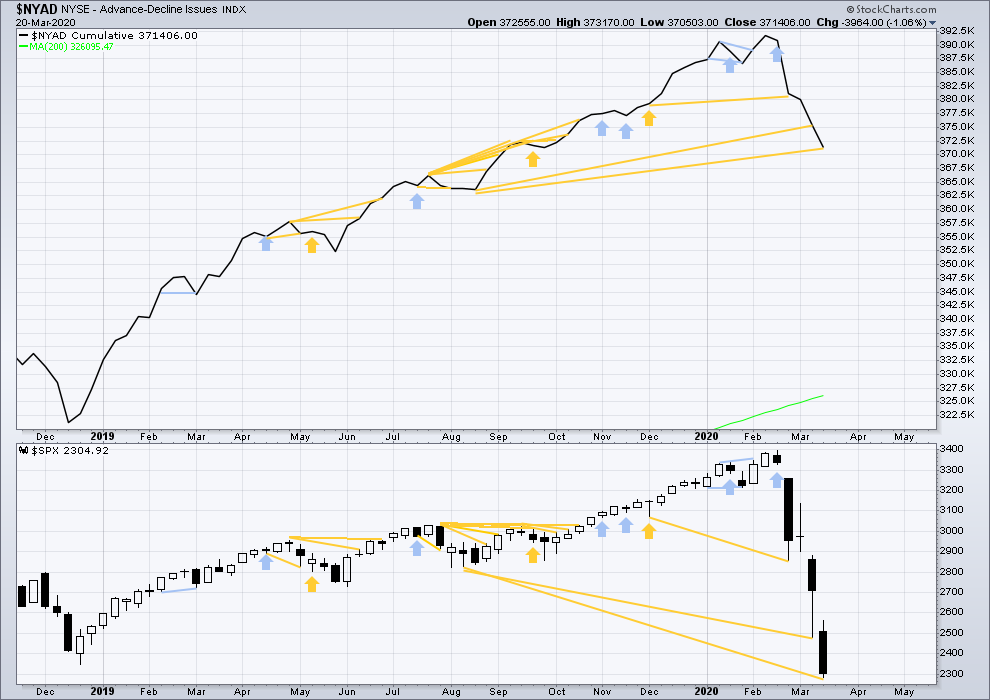
Click chart to enlarge. Chart courtesy of StockCharts.com. So that colour blind members are included, bearish signals
will be noted with blue and bullish signals with yellow.
Bear markets from the Great Depression and onwards have been preceded by an average minimum of 4 months divergence between price and the AD line with only two exceptions in 1946 and 1976. With no divergence between the AD line and price at the last all time high, this current bear market now makes a third exception.
In all bear markets in the last 90 years there is some positive correlation (0.6022) between the length of bearish divergence and the depth of the following bear market. No to little divergence is correlated with more shallow bear markets. Longer divergence is correlated with deeper bear markets.
This bear market comes after no bearish divergence. It would more likely be shallow, but this is a statement of probability and not certainty. So far it is slightly more than the 0.382 Fibonacci ratio of the bull market it is correcting (beginning March 2009).
Last week price made new lows below prior lows of August 2019, but the AD line has not. This fall in price does not have support from a corresponding decline in market breadth. This divergence is bullish and supports the view that this bear market may more likely be shallow.
Large caps all time high: 3,393.52 on 19th February 2020.
Mid caps all time high: 2,109.43 on 20th February 2020.
Small caps all time high: 1,100.58 on 27th August 2018.
DAILY CHART
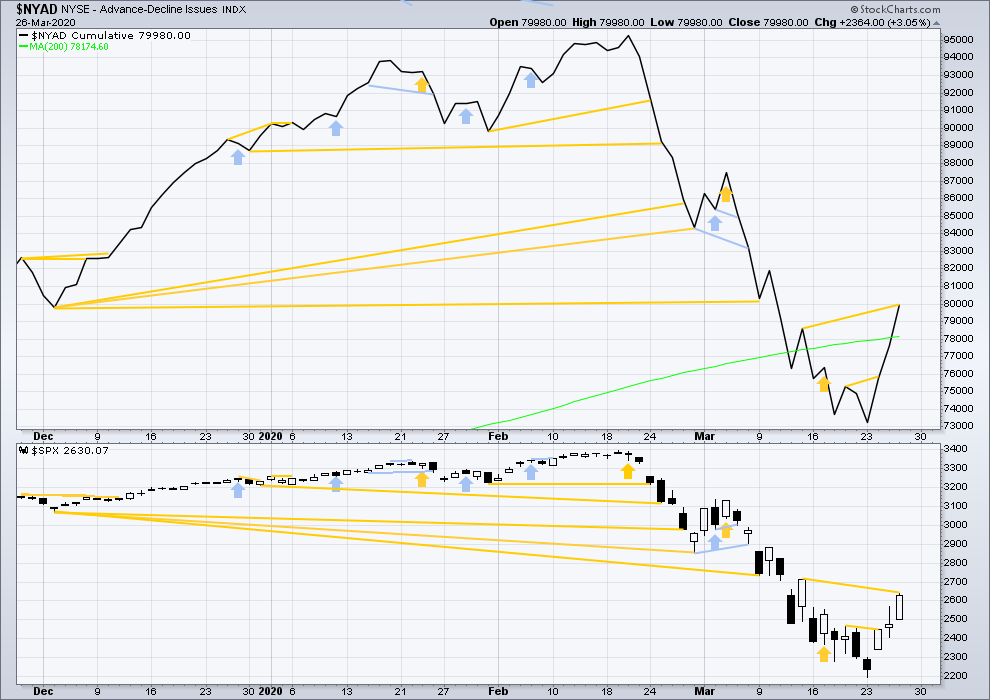
Click chart to enlarge. Chart courtesy of StockCharts.com. So that colour blind members are included, bearish signals
will be noted with blue and bullish signals with yellow.
Breadth should be read as a leading indicator.
Today the AD line has made a new high above the prior swing high of the 13th of March, but price has not. This divergence is bullish and supports the main hourly Elliott wave count.
VOLATILITY – INVERTED VIX CHART
WEEKLY CHART
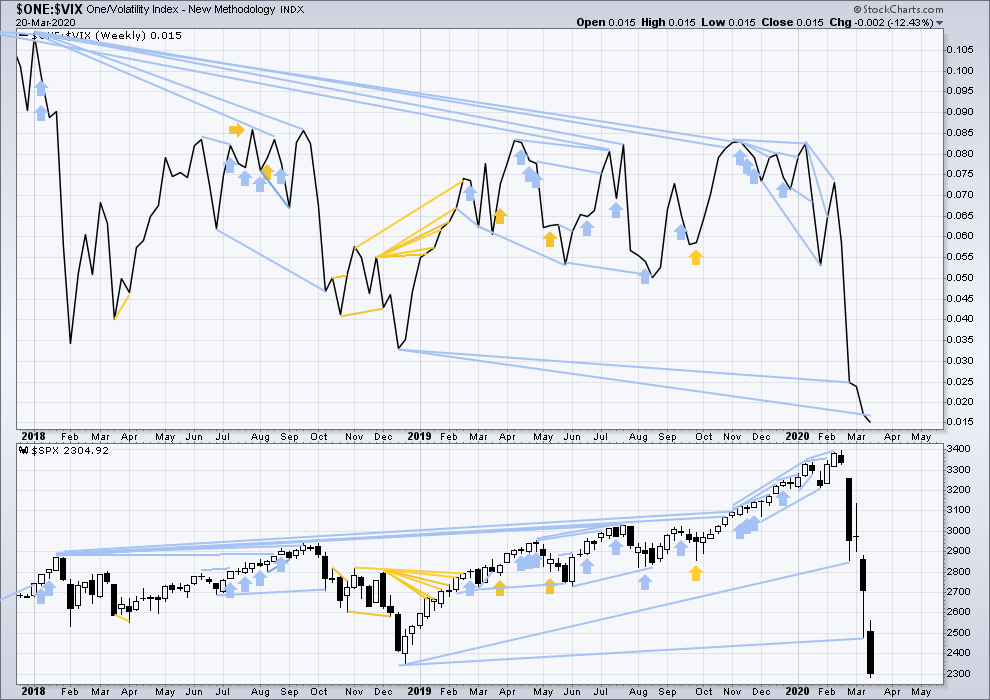
Click chart to enlarge. Chart courtesy of StockCharts.com. So that colour blind members are included, bearish signals
will be noted with blue and bullish signals with yellow.
The all time high for inverted VIX was on 30th October 2017. There is now over two years of bearish divergence between price and inverted VIX.
The rise in price is not coming with a normal corresponding decline in VIX; VIX remains elevated. This long-term divergence is bearish. It may now be resolved by this last fall in price, which meets the technical definition of a bear market.
Last week both price and inverted VIX moved lower to new lows. There is no new divergence.
DAILY CHART
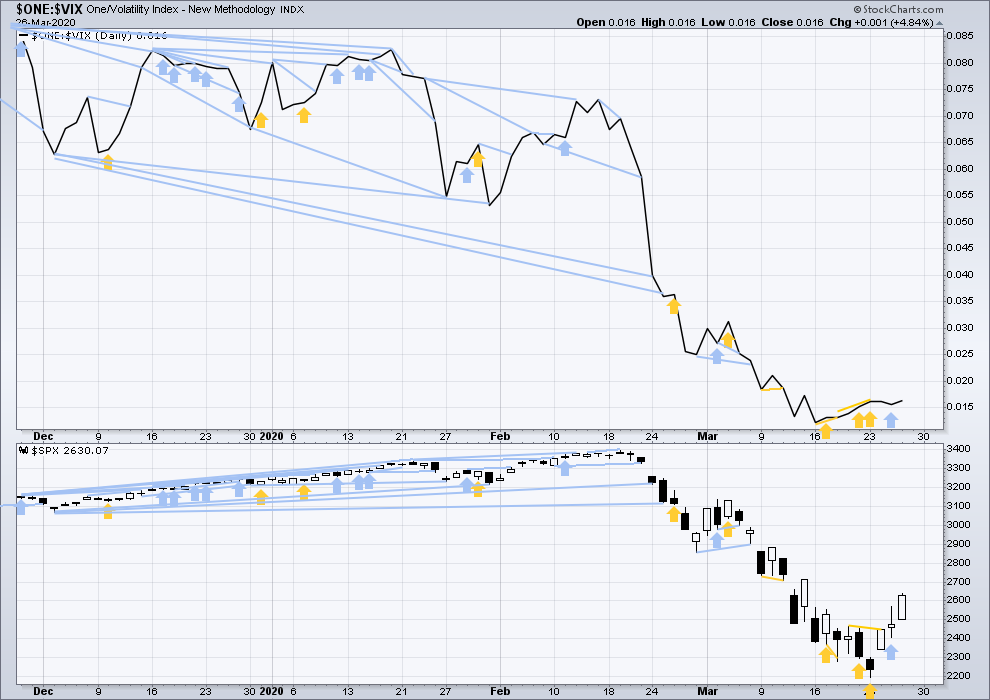
Click chart to enlarge. Chart courtesy of StockCharts.com. So that colour blind members are included, bearish signals
will be noted with blue and bullish signals with yellow.
Today both price and inverted VIX have moved higher. Neither have made new highs above the prior swing high of the 13th of March. There is no short-term divergence.
DOW THEORY
Dow Theory has confirmed a bear market with the following lows made on a closing basis:
DJIA: 21,712.53 – a close below this point has been made on the March 12, 2020.
DJT: 8,636.79 – a close below this point has been made on March 9, 2020.
Adding in the S&P and Nasdaq for an extended Dow Theory, a bear market has now been confirmed:
S&P500: 2,346.58 – a close below this point has now been made on March 20, 2020.
Nasdaq: 7,292.22 – a close below this point was made on the March 12, 2020.
Published @ 06:44 p.m. EST.
—
Careful risk management protects your trading account(s).
Follow my two Golden Rules:
1. Always trade with stops.
2. Risk only 1-5% of equity on any one trade.
—
New updates to this analysis are in bold.
https://www.bbc.com/news/world-europe-52067673
http://www.centerforhealthsecurity.org/event201/scenario.html
Hi everybody, does anyone here have any good answers to this question from a member over at EWG?
“can I have suggestions for the best way to trade gold at the moment because spread bets are off limits given the huge spreads now being applied?”
PHYS (Sprott Physical Trust) ?
Assuming by “huge spreads” it is meant huge bid/ask spreads…that’s not too much of a problem if there’s general liquidity. They will buy/sell to you somewhere in the middle. Avoid the opening 10 minutes and final 10 minutes; get positioned while the market is reasonably quiet.
I have a GLD short via a sold call spread for when…Apr 3 (next Friday), 152/155. I got $1.09 for it a day or two ago. It may be available for around that price on Monday, though if GLD is moving up, may be best to pass on that one!
Anyway, if the market is reasonably liquid, I don’t let wide bid/ask spreads slow me down much. And note that by SELLING a spread, I am on the right side of premium decay. I would NEVER consider buying a spread now, because then I’m paying the exorbitant price being asked for options. So sell a put spread to go long and sell a call spread to go short.
Outright put/call buying also has the problem of potential large premium decay, particularly with calls because implied volatility (price of options) tends to fall with rising prices. You can buy calls and “be right” and still not make much money as the premium sinks! Puts have the advantage of extrinsic value going up as price of the underlying falls. But you get doubly bit if price goes up; you are losing on both the intrinsic (assuming an in the money put) and a more rapidly falling than “normal” extrinsic (time value).
Hope this helps.
Updated hourly chart prior to NY close:
no short term upper invalidation point
this may be a B wave… within a B wave. Intermediate (B) within primary B.
the absolute worst.
it may be any one of more than 23 Elliott wave corrective structures.
Sorry Lara.
You mention absolute worst ? How do you mean. Thsnkyou
B waves are notoriously difficult to trade (if it’s a B wave at all, lol) because it can have up to 23 structure. And if you’re having a B wave within a B wave( each of which with 23 possible structures), then it’s very difficult to navigate from an EW perspective.
Having said that, I’ve found the very first wave of the B wave (the A leg of the B wave) to be decent to trade. For example the rebound from the lows up to yesterday. After that, it’s anyone’s guess what might transpire; and that’s why we have the fine folks on this forum making comments.
Hope that helps
Think that B waves have so many possibilities and a B within a B has that many more. Difficult to build a road map as morphs into something else before you know it
What they said.
Thanks guys!
Bingo. Its month ending soon and weekly close too much rebalancing going on. Expecting a down gap at open next week.
USA cases are spiking!
Is there a minimum that much be reached for C wave?
2,900 feels aggressive given what we know, but anything is surely possible.
We all complain about B waves. I’m generally going to scale risk way back here.
I do think the leveraged vol products are elevated and will bleed as we churn through a B. I will short vol (perhaps through buying svxy) and protect with some long put spreads during this B wave. When the markets rallies the put spreads still retain some good value and can unwind with value as vol and downside skew premiums are very elevated in this market.
I was happy to get back all of my losses on the launch of B the last couple days, now saving bullets for c up C down and end of II, hopefully this year!
Anyone else noticing the glaring disparity between GC and GLD?
Wassup with that?
The Gold/Silve ration at very interesting readings…!
Apparently trading on gold is halted, this may have something to do with it?
mark you calendar boys and girls
This inability to push up and through the gap sets up a high potential massive gap down again over the weekend. Maybe even some strong selling into the close as folks want to take profits on this overall move and be much lighter over the weekend too.
adding to the shorts here?
I am short here
2320 looks healthy.
Yup, like that!
No I’m plenty short for the moment, will wait for CLEAR confirmation of B over before adding.
Hi Kevin, what would be a clear confirmation of B over? When the B wave channel is broken down?
The NYTimes front page has a graphic that is just stunning. Weekly jobless claims from 00 to this week. Rapid rise from the average (345k) to a high of about 700k over the course of 08′-’09. Then a long smooth descending curve to about 250k per week. Then…THIS WEEK!!! With a bar about 450% higher than the ’09 peak. 3200k. Just MASSIVE, surreal.
ROD, I have thinking about these charts like that too…. except the SPX, so thank you
It does appear as if Mr. Market is not pricing in the terrific demand destruction being inflicted on the global economy. Do folk really think the stimulus package is going to fundmentally alter that reality?
Interesting days ahead…
Apparently Verne. To me the markets waiting for this announcement. Doesn’t make sense to me
yum,,, tasty red candles
are you still thinking 2400-ish has these factors ‘priced in’?
Some Charts as food for thought.
Next
Next
And finally
Rodney,
it could be, but then we have to check with Lara – is it possible for B wave’s top to be 15% above top of A wave (3393 for top of wave B vs. 2940 for top of wave A). From what I remember normal overrun would be about 5%, but maybe there is no set rule. And also, currently C wave is 2x of A wave based on your chart. And how do we know if it’s C wave low – it can still go lower, no matter how you mark it. Would be a great question for Lara – if it’s a possible count.
Just food for thought. I always defer to Lara. I am certainly no EW expert by any measure. Thanks for the feedback.
If you ever had any doubt that the derivatives sphere of the market (including putative VIX and other vol calculations) is run by crooks just look at what is going on with DRIP and GUSH.
Oh, I know they have all kinds of fancy explanations as to why supposedly inversely correlated etfs should trade uni-directionally. It is mostly B.S. and these folk think people are stupid (they could be right). The simple and truer explanation is THEFT of traders’ capital. We sued ( and won) CBOE for manipulation of VIX options at expiration.
You’re definitely on to something here, Verne. These inverse ETFs just look whack lately. See UPRO/SPXU or TQQQ/SQQQ or almost any other +/- pair.
I am aware of many attempt to sue CBOE and ETF providers, but I believed all were rejected (for example: https://www.cfo.com/fraud/2019/05/court-dismisses-suit-over-cboes-fear-gauge/).
Which lawsuit did you win?
Thanks
They settled. NDA.
Hourly chart updated:
We have a winner.
Thanks Lara. I am always tickled when the EW count lines up perfectly with my trading plan, in this case a potential re-tag of maginot line round number 2400. Sweet!
Kevin, only two trades??! 🙂 🙂
Two NEW trades. I’ve got short positions (SPY and IWM puts and sold call spreads) coming out of my ears. And I hope to add to those…but I’m waiting for that for obvious reasons.
Thankyou Lara
Hi Lara. Looking at your chart. Is the timeline today. ? I mean end of B at 2900 or so ?
pretty doubtful were gonna see 2900 hundred today. time frame is always unknown. but it seems logical the hourly charts describe several days worth of action.
I’m amazed that we could go that high in next few days
I’m very doubtful of hitting 2900 “ever”. I’m not even sure we see a move above yesterday’s high. On the daily, price got awfully close to the upper big down channel line. But I’m being patient because certainly Lara’s main structure has significant probability.
This is one of the greatest sucker rallies in stock market history. Maybe it does go higher; there are a lot of suckers out there, and the big money is pushing this up to enable distribution at higher prices. Read some “bull market is back!” posts here and there (other forums) yesterday, unbelievable.
Don’t forget yesterday was rebalancing for majority of Pension funds ahead of the QTR closing.
On another note, while we have not yet fully understood the impact of COVID19 on real estate, over the last few days I have so many folks already planning to buy real estate. I guess the some retail folks are seeing a completely different picture and not willing to wait to lock into low rates head first.
Thsnkyou rishi. I didn’t realize the pension funds are rebalancing. Is that info publicly available ?
Two trades I’ve taken today, one short term, one longer term.
The $ retraced strongly over the last week, and just started to turn up today again. Similarly, FXE moves up strong to a 50%, and turned down today.
Sold May 15 103/106 call spread. Stop at 105.
Gold appears to be topping around a 78% of a B or 2 wave up. Sold Apr 3 152/155 call spread. Stop at 155 (now at 152.3).
These are about 2-1 reward to risk with these stops. With the set ups, they “should be” quite +EV.
Looking at LQD, normally a very stable investment grade corporate bond fund that tanked from 135 to 105. It’s retraced to 124, the 61.8%, tagged and turned and is now consolidating just under that level. I’m not shorting it yet but this is a prime target for me as the set up completes. Maybe it goes up to the 76-78% at 128 on a continued B wave up in the equity averages. Stalking this one for sure.
I am!! 🙂
It should be trading at a NEGATIVE number..hehe!
Now there’s a strongly confirming indicator!
Here a reasonable working model for what generally comes next.
Wow, no wonder why only 2 crashes compare to this one (1929 and 1987). I think you are right Kevin – we are very likely in 1929 all over again. Good chart -thanks.
Remember, that wasn’t the end/bottom, that took another couple of years.
But it’s what’s just ahead that counts for us.
NYTimes headline: “Job Losses Soar; US Virus Cases Top World”
And the world wide CV rate is ripping exponentially.
As we say when we’ve really got someone in a state of stuck-ness in the game of one pocket, “it’s a baaaaad situation”.
I hope not Kevin.
Thanks for Sharing Kevin!
Hi Lara,
I thought about Rodney’s comment yesterday proposing that we might have seen this bear market’s low at 2191.86 and we could possibly not see lower than this low anymore. If that is the case, is there any count that would fit this assumption? How would it look like? Can C wave end above previous low and then bounce up or should it be some different count altogether?
Thank you.
Be careful who you listen to. ZBT did not trigger.
Hi Rodney,
It’s not that I say you are 100% wrong or right. I just thought about possibility and see if there is a valid count for it just to keep it in mind as well. As Kevin said, we have to know as many options as possible, no matter how low probability it may be. I just don’t want it to bite me in the rear when it shows up as you thought it might:)
Good to know about ZBT. Thanks.
Thank goodness. I’m short. You had my attention there!
Who would have thought the day would come when VIX would trade ABOVE futures/leveraged instruments like VXX and UVXY?
Through the looking glass…!
VIX futures are almost always in backwardation, so we should expect: VIX > VX1 > VX2 > VX3 >…
VXX and VIXY are combination of VX1 and VX2 so we should expect: VIX > VX1 > VXX > VX2
There is no relationship for leverage ETFs of course.
What abnormal behavior are you seeing?
Arnaud I am simply talking as a trader about nominal value. As you probably know, quant calculations have a scary number of variables and “implied volatility” can often bear no resemblance to what actually unfolds in the market. I told fellow traders in the War Room in mid Feb that I thought certain option contracts were woe-fully mis-priced and I got a very skeptical reception then as well… 🙂
I do not see any abnormal relationship in the SPX vol surface and in the VIX futures (i.e., there is no arbitrage possible, and SPX options and VIX futures are consistently price one versus the another).
I understand you are saying that VIX is too low in your opinion?
Hourly /ES with overnight data. Tag and turn off the “next up” fitted projection of the swing completion level. Could be it for this move…or not.
CV infection totals for 3/26 very bad folks. 60,000 new cases. The exponential growth continues. See coronavirus dot app “global” page for the data. Yikes.
Hey. Comments are back. First?
Maybe everyone’s at home day trading ?