
S&P 500: Elliott Wave and Technical Analysis | Charts – March 25, 2020
Summary: Primary wave B may have begun. It may be either a quick sharp bounce or a long lasting sideways consolidation. Targets are 2,651 or 2,934.
A new high above 2,466.97 today and a breach of the black channel on the hourly charts provide some confidence in this view.
The biggest picture, Grand Super Cycle analysis, is here.
Last monthly charts are here. Video is here. Members are encouraged to view all three monthly charts. The third is much more bearish than this main wave count and remains a valid possibility.
ELLIOTT WAVE COUNTS
WEEKLY CHART
Click chart to enlarge.
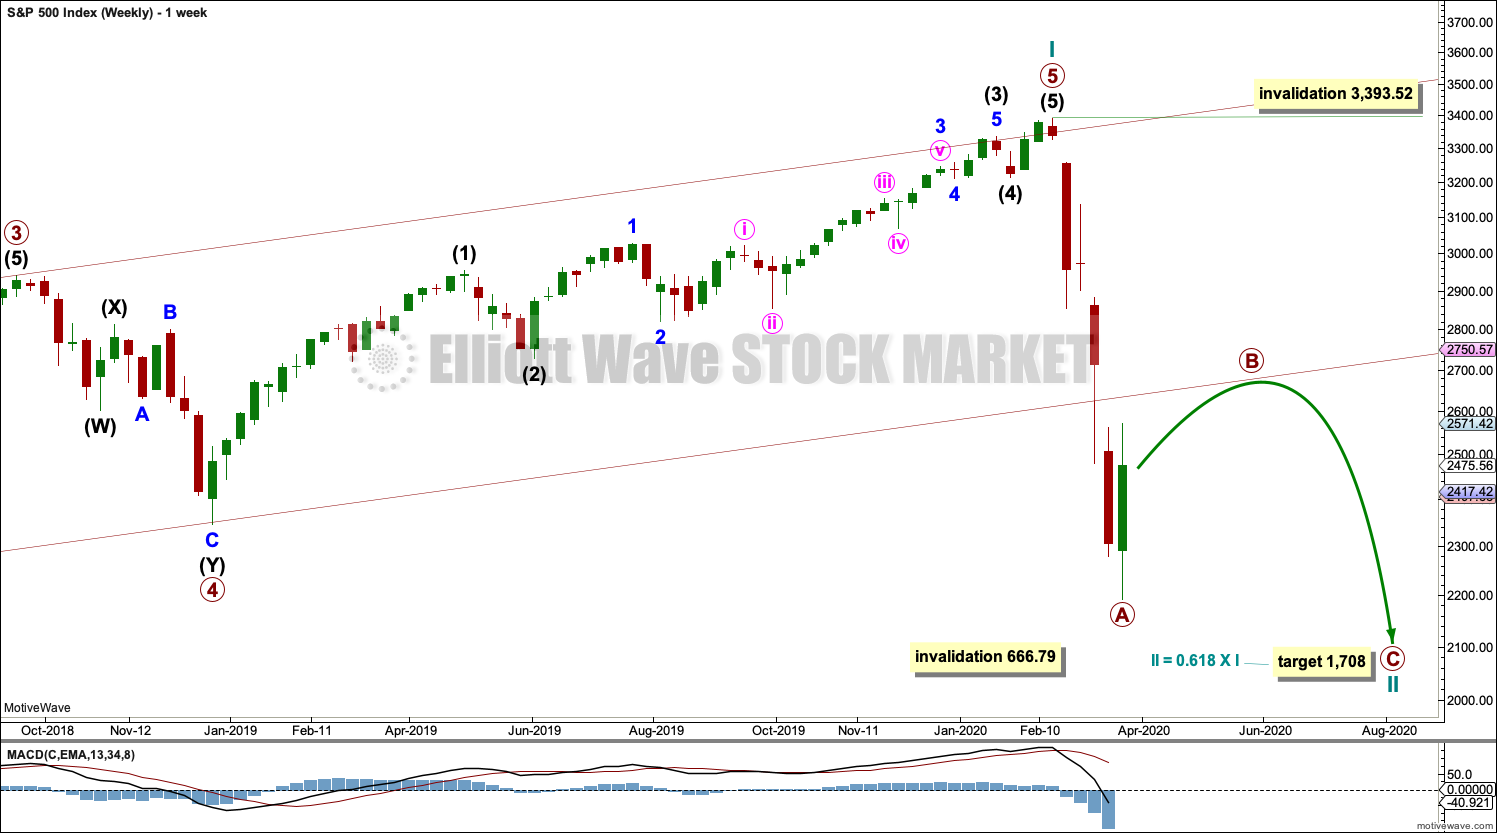
The channel is now breached by a full weekly candlestick below and not touching the lower edge. Further confidence in this wave count may be had.
Price is now below the 0.382 Fibonacci ratio of cycle wave I at 2,352. The structure of cycle wave II may need further to go to complete. The next Fibonacci ratio at 0.618 is now a preferred target for cycle wave II to end.
Cycle wave II would most likely subdivide as a zigzag; thus far that looks like what it is unfolding. When primary waves A and B may both be complete, then the target may be calculated using a Fibonacci ratio between primary waves A and C. At that stage, the final target may change or widen to a zone.
It is possible now that cycle wave II could be complete. This is outlined in a second alternate hourly chart below; in analysis of that chart I have outlined what needs to be seen for confidence in the alternate wave count.
Cycle wave II may not move beyond the start of cycle wave I below 666.79.
DAILY CHART
Click chart to enlarge.
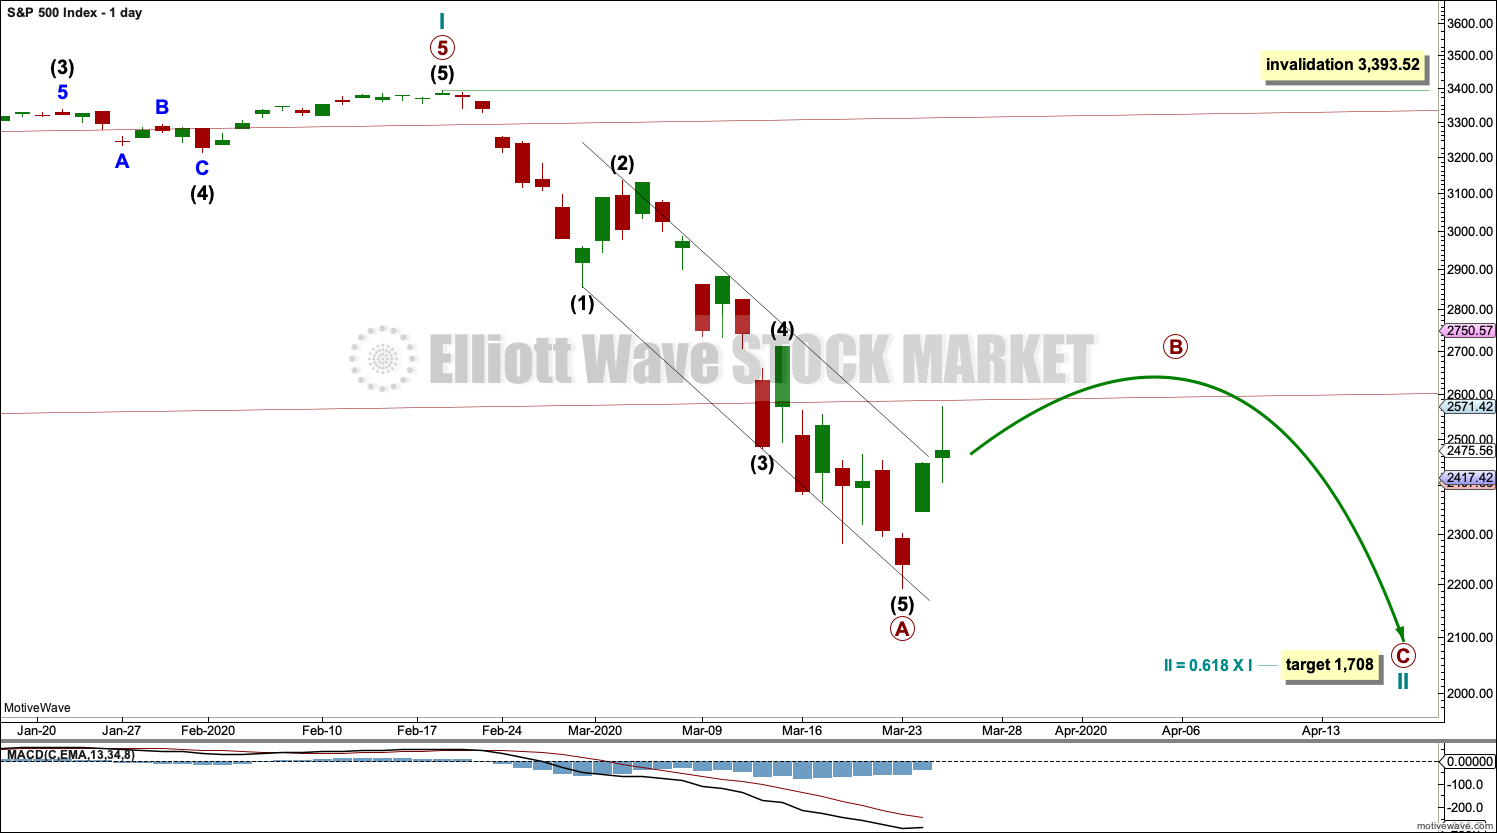
Redraw the wide maroon trend channel carefully: draw the first trend line from the end of primary wave 1 at 2,093.55 (December 26, 2014), to the end of primary wave 3 at 2,940.91 (September 21, 2018), then place a parallel copy on the end of primary wave 2 at 1,810.10 (February 11, 2016). The channel is fully breached indicating a trend change from the multi-year bull trend to a new bear trend.
Cycle wave II may subdivide as any Elliott wave corrective structure except a triangle. It would most likely be a zigzag. Primary wave A may be a complete five wave impulse. Primary wave B may not move beyond the start of primary wave A above 3,393.52.
HOURLY CHART
Click chart to enlarge.
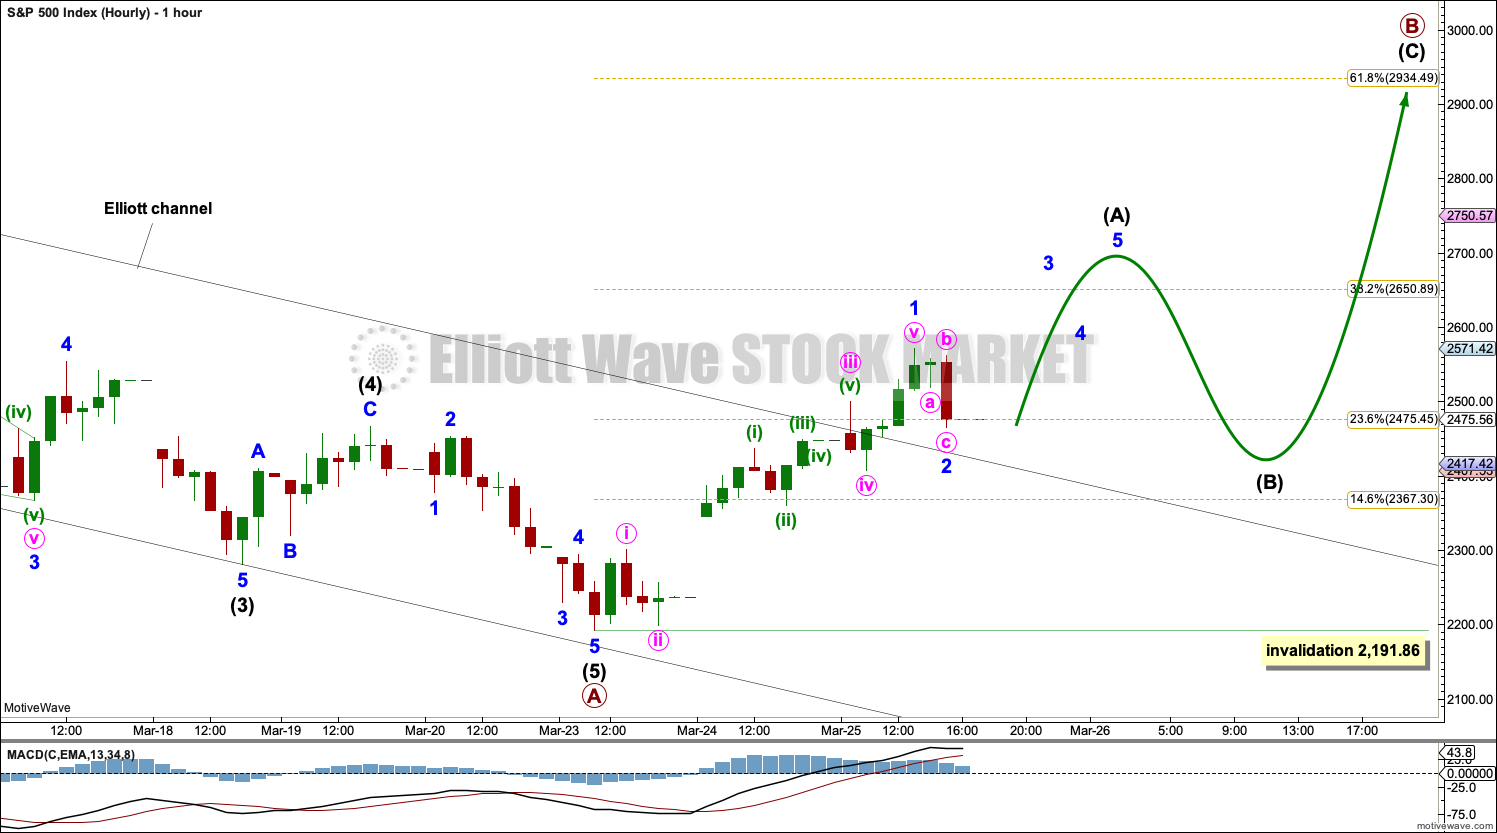
Primary wave B may subdivide as any one of more than 23 possible Elliott wave corrective structures. B waves exhibit the greatest variety in structure and price behaviour. Primary wave B may be a quick sharp bounce as in a single or multiple zigzag, or it may be a time consuming sideways consolidation as in a flat, combination or triangle.
Today this main hourly wave count considers the possibility that primary wave B may be subdividing as a zigzag. If primary wave B subdivides as a zigzag, then intermediate wave (A) must subdivide as a five wave motive structure, most likely an impulse.
Within intermediate wave (A), minor wave 1 may be complete at today’s high. Minor wave 2 may also be complete as labelled, but it may also continue lower as a double zigzag. Minor wave 2 may not move beyond the start of minor wave 1 below 2,191.86.
This is the main wave count because the most common Elliott wave corrective structure is a zigzag.
If primary wave A is correctly analysed as a five wave impulse, then primary wave B may not move beyond its start above 3,393.52.
ALTERNATE HOURLY CHART
Click chart to enlarge.
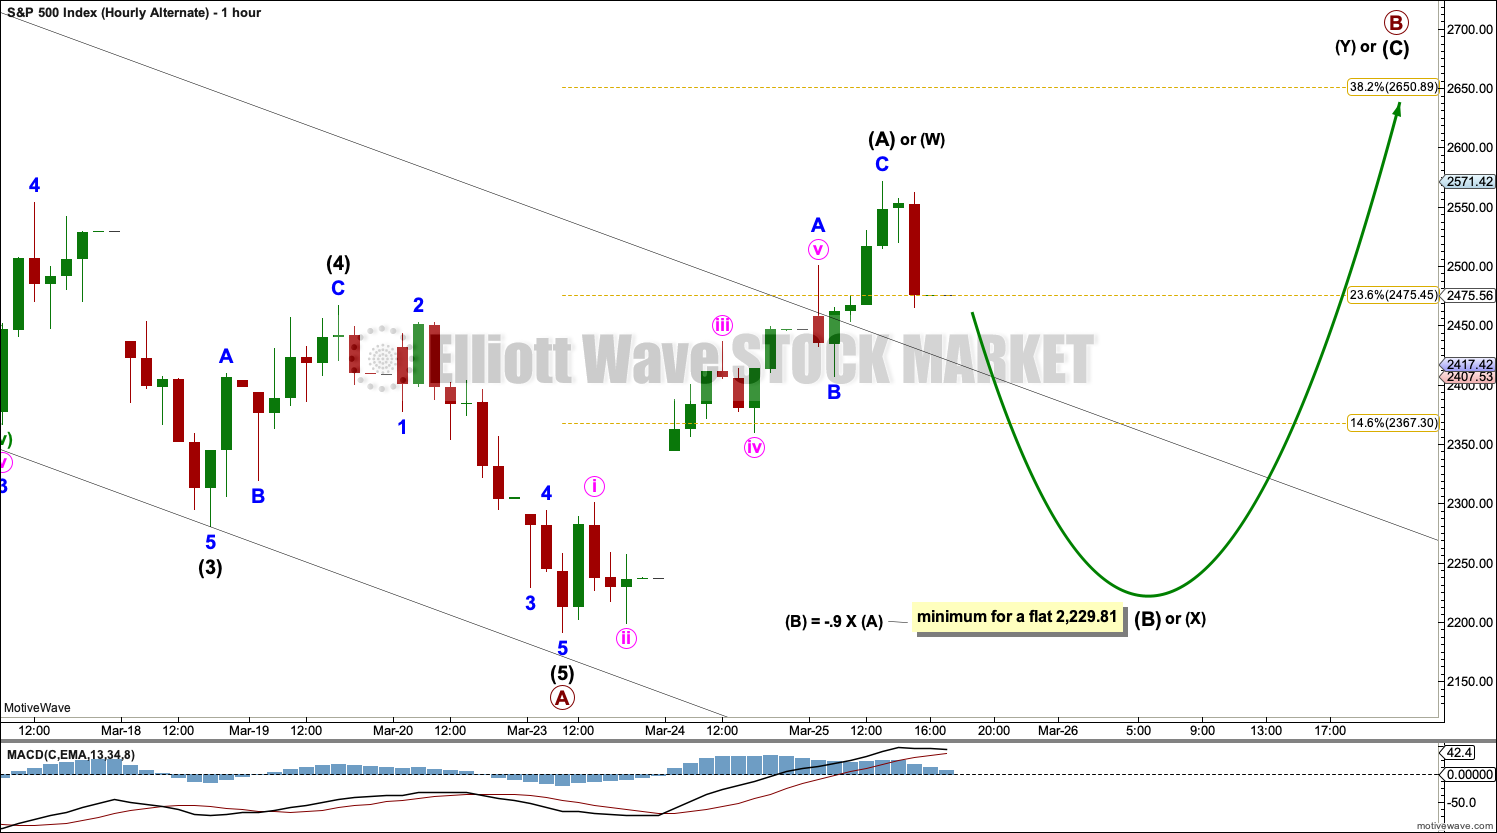
It is also possible that primary wave B may subdivide as a flat, combination or triangle. This alternate wave count considers those possibilities in the one chart.
If primary wave B subdivides as any one of a flat, combination or triangle, then the first wave up within it should subdivide as a three, most likely a zigzag. That may now be complete.
If primary wave B subdivides as a flat correction, then within it intermediate wave (A) may now be complete. Intermediate wave (B) would need to retrace a minimum 0.9 length of intermediate wave (A). Intermediate wave (B) may make a new low below the start of intermediate wave (A) at 2,191.86 as in an expanded flat. There is no lower invalidation point.
If primary wave B subdivides as a triangle, then within it intermediate wave (A) may now be a complete zigzag. Intermediate wave (B) may not unfold lower as a single or multiple zigzag; there is no minimum length required for intermediate wave (B) within a triangle. Intermediate wave (B) may make a new low below the start of intermediate wave (A) at 2,191.86 as in a running triangle. There is no lower invalidation point.
If primary wave B subdivides as a double combination, then the first structure in a combination may now be complete, a zigzag labelled intermediate wave (W). The double may now be joined by a three in the opposite direction to be labelled intermediate wave (X), which would most likely subdivide as a zigzag. There is no minimum requirement for intermediate wave (X) and it may make a new low below the start of intermediate wave (W). There is no lower invalidation point.
TECHNICAL ANALYSIS
WEEKLY CHART

Click chart to enlarge. Chart courtesy of StockCharts.com.
A 35% drop in price (high to low) no longer has precedent within the larger bull market.
At the weekly chart level, conditions are now oversold; it is now more possible that a bounce or consolidation may arrive.
DAILY CHART
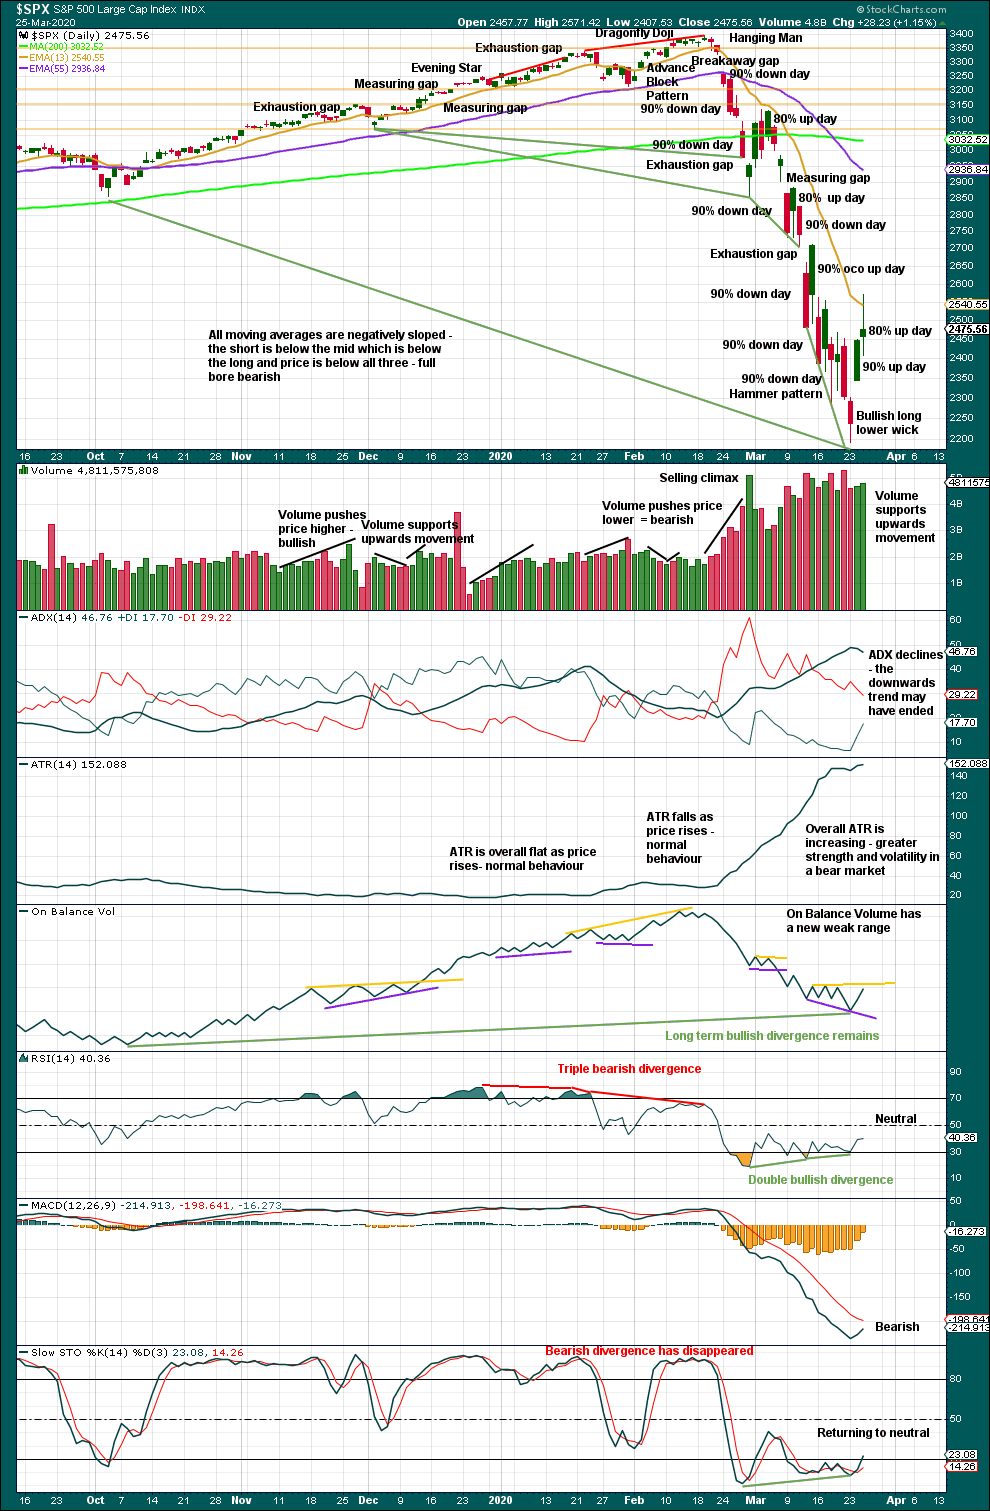
Click chart to enlarge. Chart courtesy of StockCharts.com.
There are now eight 90% downwards days in this strong downwards movement.
At the last low:
– RSI reached deeply oversold and now exhibits short-term double bullish divergence with price.
– Stochastics reached oversold and now exhibits short-term bullish divergence with price.
– On Balance Volume exhibited bullish divergence with price, although short-term bullish divergence disappeared.
Now a 90% upwards day and an 80% upwards day give some confidence that a low is in place. It may not be the end of the bear market though; the Elliott wave structure may not be complete.
Today a spinning top candlestick suggests indecision and a balance of bulls and bears. The bulls won though, dominating volume and breadth. This is not a reversal pattern and may occur within a trend. Support from volume suggests more upwards movement in the short term.
BREADTH – AD LINE
WEEKLY CHART
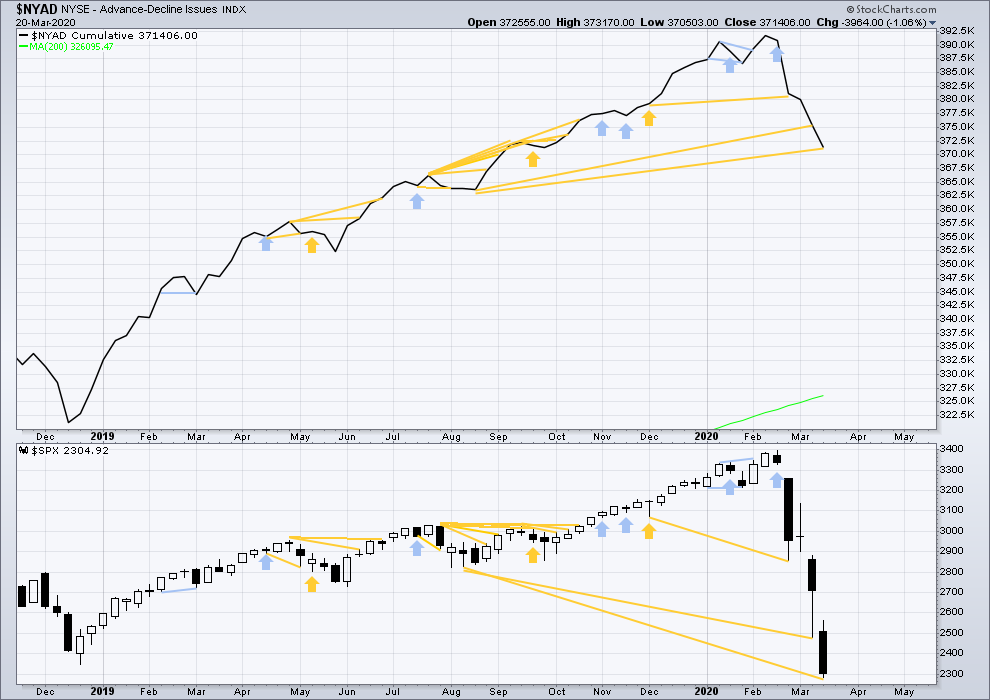
Click chart to enlarge. Chart courtesy of StockCharts.com. So that colour blind members are included, bearish signals
will be noted with blue and bullish signals with yellow.
Bear markets from the Great Depression and onwards have been preceded by an average minimum of 4 months divergence between price and the AD line with only two exceptions in 1946 and 1976. With no divergence between the AD line and price at the last all time high, this current bear market now makes a third exception.
In all bear markets in the last 90 years there is some positive correlation (0.6022) between the length of bearish divergence and the depth of the following bear market. No to little divergence is correlated with more shallow bear markets. Longer divergence is correlated with deeper bear markets.
This bear market comes after no bearish divergence. It would more likely be shallow, but this is a statement of probability and not certainty. So far it is slightly more than the 0.382 Fibonacci ratio of the bull market it is correcting (beginning March 2009).
Last week price made new lows below prior lows of August 2019, but the AD line has not. This fall in price does not have support from a corresponding decline in market breadth. This divergence is bullish and supports the view that this bear market may more likely be shallow.
Large caps all time high: 3,393.52 on 19th February 2020.
Mid caps all time high: 2,109.43 on 20th February 2020.
Small caps all time high: 1,100.58 on 27th August 2018.
DAILY CHART
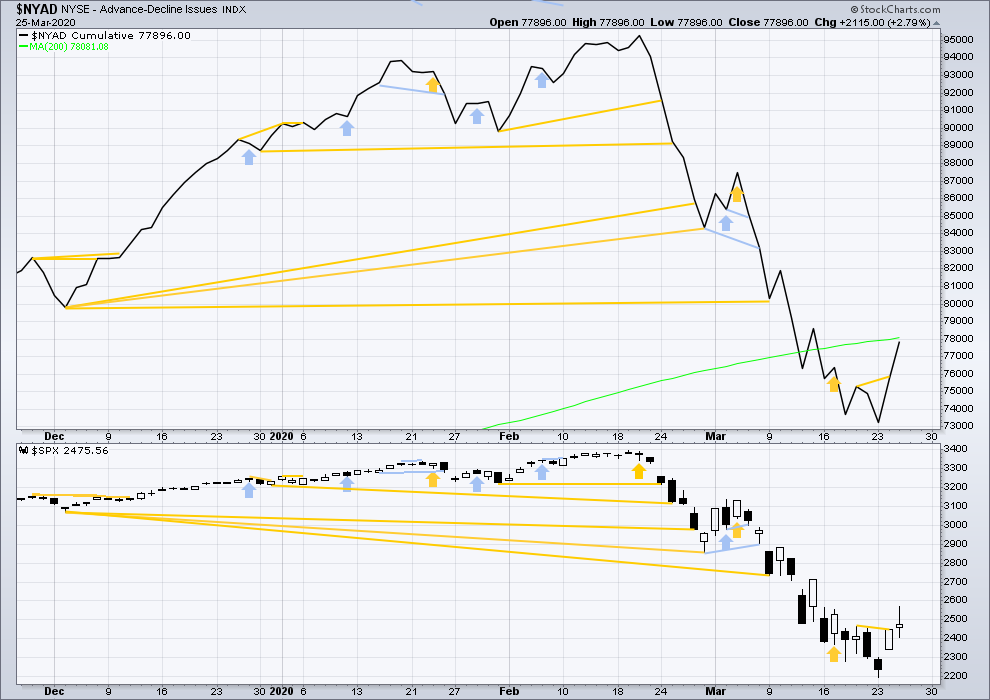
Click chart to enlarge. Chart courtesy of StockCharts.com. So that colour blind members are included, bearish signals
will be noted with blue and bullish signals with yellow.
Breadth should be read as a leading indicator.
Today both the AD line and price have moved higher to make new short-term swing lows. Upwards movement has support from rising market breadth. This supports the Elliott wave count.
VOLATILITY – INVERTED VIX CHART
WEEKLY CHART
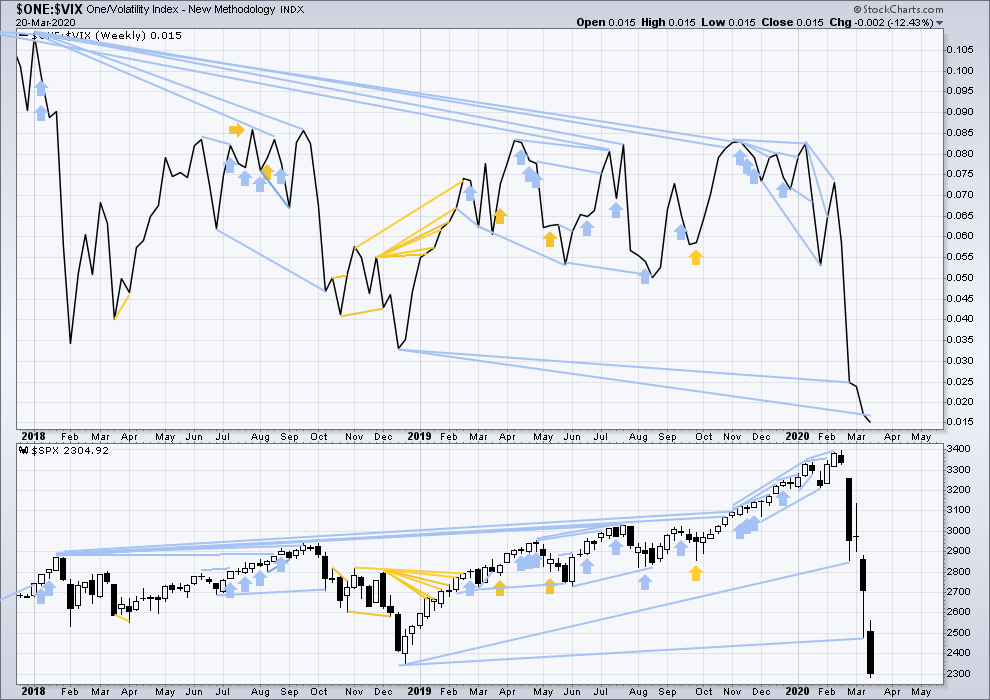
Click chart to enlarge. Chart courtesy of StockCharts.com. So that colour blind members are included, bearish signals
will be noted with blue and bullish signals with yellow.
The all time high for inverted VIX was on 30th October 2017. There is now over two years of bearish divergence between price and inverted VIX.
The rise in price is not coming with a normal corresponding decline in VIX; VIX remains elevated. This long-term divergence is bearish. It may now be resolved by this last fall in price, which meets the technical definition of a bear market.
Last week both price and inverted VIX moved lower to new lows. There is no new divergence.
DAILY CHART
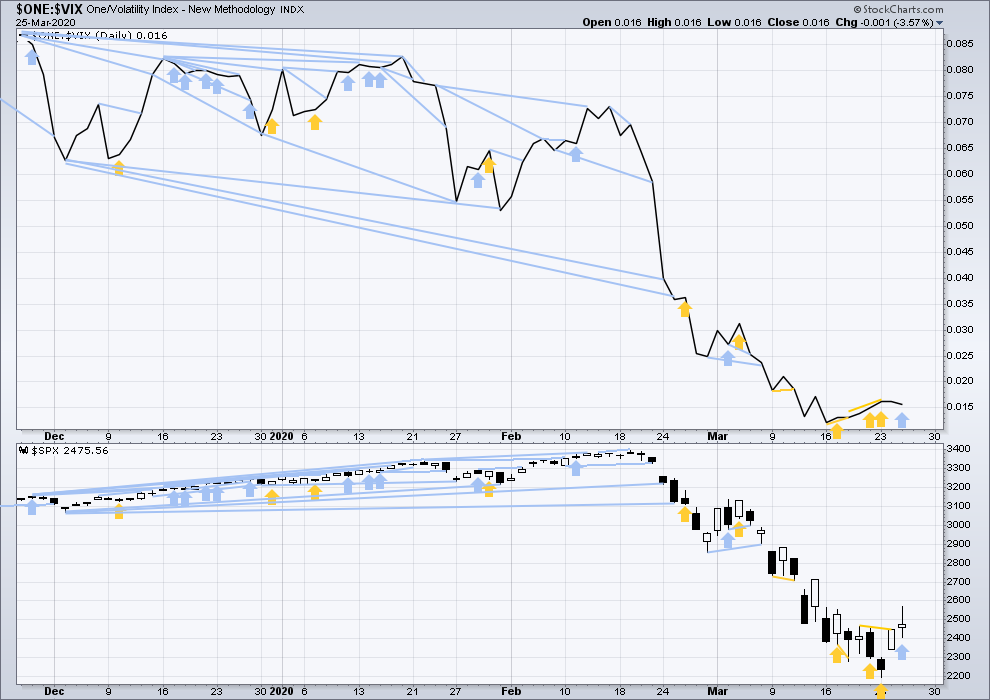
Click chart to enlarge. Chart courtesy of StockCharts.com. So that colour blind members are included, bearish signals
will be noted with blue and bullish signals with yellow.
Today price has moved higher, but inverted VIX has moved lower. The upwards movement in price has not come with a normal corresponding decline in VIX. VIX remains elevated. This divergence is bearish for the short term, but it will not be given weight in this analysis because the AD line disagrees.
DOW THEORY
Dow Theory has confirmed a bear market with the following lows made on a closing basis:
DJIA: 21,712.53 – a close below this point has been made on the March 12, 2020.
DJT: 8,636.79 – a close below this point has been made on March 9, 2020.
Adding in the S&P and Nasdaq for an extended Dow Theory, a bear market has now been confirmed:
S&P500: 2,346.58 – a close below this point has now been made on March 20, 2020.
Nasdaq: 7,292.22 – a close below this point was made on the March 12, 2020.
Published @ 06:39 p.m. EST.
—
Careful risk management protects your trading account(s).
Follow my two Golden Rules:
1. Always trade with stops.
2. Risk only 1-5% of equity on any one trade.
—
New updates to this analysis are in bold.
over 3 million unemployed and the market says ,, meh, no big. watch the house throw a wrench in the bill, or better yet watch them sell the news tomorrow. Oh, I see, they saw that we were to have a B wave and went contrary to the news. They are watching Laras counts
no comments for todays analysis,,, first.
Actually doc, I was first.
Hyuk! 🙂
Lara:
What’s your view on the expanding diagonal count I showed at 11:47 am ?
SPX close is right on target for this count.
Thank you.
This is also smack bang on my upper trend line – which has tempted me to go short – although I am desperately conflicted.
I’ve taken a close look at it and it’s valid. Price needs to reach 2,629.09 for it to work, so a little more upwards movement required.
It’s a good wave count that should be considered because price is right now so close to the 0.382 Fibonacci ratio. That may be about where intermediate (A) endsl
It has reached the limit at the close. That’s what’s exciting…..
Hourly chart updated just prior to close:
I can’t count a complete intermediate (A) (I tried on a blank chart, there’s too much overlapping in the middle for the third wave within it to be complete) so I expect more upwards movement overall.
Most may be familiar with this model. And no one needs to be told where we are, lol!!
WSJ just published that Dow escapes bear market with 6% rally, the blue-chip index is now +20% from its low, qualifying as new bull market. I wonder if in several days, weeks, etc. they will write that it was the shortest bull market in history:)
The chart from Kevin is classic – i also believe we’re in “return to normal” stage right now. I don’t think there was enough feat or especially capitulation yet. Everyone is still talking about buying dip. Only when they will be scared to buy anything, only then we might have a bottom. I might be completely wrong, but I didn’t sense any capitulation in the market yet.
Classic
Yeah, this.
1900 looks like good target level for Lara’s C.
You may all be pleased to know that this website will be updated to a new format this weekend, and then we shall be installing Disqus for comments.
There may be a few issues to iron out (there are a couple over at Elliott Wave Gold) but overall it should be a much better comment system for you and me.
Hi Lara. Have understood the chart correctly B finishing up around 2900
About 2,934.49, the 0.618 Fibonacci ratio.
Thankyou Lara. So if I’m looking at the charts correctly. Timeline being next few sessions ?
Hourly chart updated:
The main count is the one so far. A third wave may currently be unfolding. MACD supports this, momentum is increasing.
I’ll also have an alternate today, and every day from here. There may be a few alternates to cover the various possible structure for this B wave.
I think Inter A is done. I can count five up in Minor degree.
Looks like tomorrow will be the same rinse and repeat process going to 2650 levels. They will drop it tonight first, same as previous 2 days. It becomes 1-2-3 process:) We’ll see
I’m struggling to see a complete five up. A chart of your idea would be helpful? To see what I may be missing
Hi Lara, sorry, not based on any EW. Just looking at the next channel band. And the next channel up is 2600-2675 for tomorrow if it keeps going with the same angle. Just a speculation on my part, but so far it did go over two channel bands for the past 2 days exactly that way. We’ll see. It matches with your main count too.
This market is a joke: the largest increase among SPX stocks today is CCL (Carnival), up +17% so far. I guess it is pricing that the Easter Egg Hunt will occur on one of their ships?
Checkout RCL as well..this goes to show that this market is being juiced …
We are on the verge of getting a Zweig Breadth Thrust (ZBT) signal. The last time this happened was the end of 2018 / beginning of 2019. From there we had a roughly a 44% up move in SPX. If the ZBT triggers I will be going long on the next correction. I expect that correction to begin any day now and complete somewhere around 2350-2300.
This indicator has mixed reviews from McClellan (https://www.mcoscillator.com/learning_center/weekly_chart/zweig_breadth_thrust_signal/).
Is there a particular TA reason to think this time will be a good one (of course, there is an EW reason, as the mid-2300s would be a great level for the upcoming B to finish).
I was referred to that same article back in January 2019 when the ZBT last triggered. Note that McClellan changed some of the original parameters in his analysis. Also, some of the triggers he noted as ‘not so good’ because they exhibited further downside movement were later followed by a strong move up for many months. It is like a 1-2 wave. 1 takes it up and triggers the ZBT, then 2 is a correction. However, this is followed by a lot more movement to the upside. I would consider this a very good signal.
All that being said, the ZBT just like any indicator is not 100%. Nothing is 100%, at least I have not seen such an indicator.
You ask what particular TA reason I have as this being a good time to go long. Well, ZBT is TA. Other TA reasons include a 90% up day followed by another 80% up day, followed by today’s large up move. In addition we have a long lower wick candle at the bottom. Then we have a breach of the upper downwards sloping channel line. Today we have a bullish crossover of the daily MACD. Finally we have a move on the McClellan oscillator moving from a -139 through 0 and above +20 which lends great confidence in this bullish breakout. All in all, I think TA supports the idea that the bottom may be in place.
Can the 2191.96 low be broken to the downside? Yes, of course. But looking out several months, I suspect the SPX will be in a sustainable uptrend.
Perhaps.
I’m far more bearish than this. I think the bear markets of ’29-32, ’00-01, and ’07-09 are the critical analogues. I discount ’87 as an outlier with virtually zero similarity re: fundamentals to this situation. Add in the unprecedented nature of the initial move down; that is a bright red revolving light to me.
I expect a bottom out several months, at least. Possibly in the worst case out a year or more.
But I remain open and responsive to new data as it arrives. Can’t lock into a bias; that can cost big time.
Charting an expanding ending diagonal on the SPX. This would be the end of A.
this count projects:
wave 5 (red) must be longer than 3 (red) -> at least 2630
upper trendline of the diagonal ~ 2650 (depending on time)
These targets are close enough to the 38% retracement (2650), so I will expect top of A in a range 2630/2650
DJIA turn expected around 22290,
S&P is at turn around 2575-2577,
NDX closing in on the turn point around 7,6–,7,700.
From what I see we could go all the way to 2620 levels or even higher on SPX today.
No helicopter money if your FY2019 income was over 99k. Even if you made $100k and are unemployed now. “You should have saved some rainy day cash”, yea just like the corporations didn’t. They get bailed for their malfeasance, but the citizens can hunt gophers for food and go to the pawn shop for rent money. Lot of gophers here in SF, soup anyone?
SPX hourly with channels and turn target area. Note the turn so far was right at the Fibonacci projection from a day or two ago (lower blue line). Next one up show, just above zone of the crossing channels target, and just below the pivot high of that kickback Friday that turned into an epic rout overnight.
As I mentioned yesterday – they do exactly the same thing today as they did the day before. Drop it to 38% retracement over night and then rinse and repeat – they have no other way to go but up to correct. They don’t care what fundamentals show. They need to collect as many FOMOs as possible and then as Verne says shake those trees hard.
Lol!!! And it works…
Initial turn down now off my Fib projection target, nice. We’ll see if that’s it here…
Similar view for RUT. RUT the leader this morning.
Lara’s B is coming to haunt you and probably even me. Buying is pretty strong, still counter trend, but looking like 2850 is possible. B waves can really test those limits.
i wouldn’t be surprised even if they touch 3K levels – just to get all the unstable shorts out. They like testing your thesis all the time. If you don’t really believe your thesis, they will shake you off. I have seen it so many times. They will test your beliefs to the core until you stay really strong or break as most do.
the 61.8% retrace target Lara has would by my back of the envelope math be a 33% move up off the lows. That I believe would be unprecedented re: 1929, 1987, 2000, and 2007. On the other hand…the initial swing down was unprecedented in ferocity. So a spectacular B up might be in the cards.
Let’s keep in mind however that the US is headed toward an epic health care disaster. Some NY hospitals already having to triage because of lack of space, and it will get like that all over the country soon. Most of the world will veer (or already has veered) the same way. I’m comfortable that “this B wave too shall pass”, as reality comes crashing in over the next several weeks. And the market may overlook this 3.2 million unemployment claims…but let’s see it overlook the next report! This one was very partial/earliest of days worth.
That all said…watch the new infections rate. It somehow it miraculously crests and starts falling for multiple days, definitely time to reassess.
A few billion dumprd in futures to try and counter release of initial jobless claims. Amazing!
It is only paper, they have lots of it to dump….unreal that they have masses hooked on cheap money drug.
I was just telling this to a mate Verne. How rigged up the market is
2400 again being vigorously defended. Outcome there controls next momentum move.
I am hearing that Bernie Sanders is going derail / oppose the COVID19 aid package unless there are changes made to expand benefits for the unemployed.
Peter S – thanks for your reply last night to my chart – yes the S&P looks like the Nikkie at the end of 1989 to me (albeit over a longer timeframe). Before my time but I see it was an asset price bubble which burst.
Here’s a scary set of #’s.
Coronavirus cases outside China.
25th of January: 40
25th of February: 2,700
25th of March: 380,000
Folks, the trend is your friend (strongest down in history), and the fundamentals and hence the market are being driven by an external disaster in fast motion. Trade safe…but maybe trade a bit on the aggressive side to take advantage of a unique situation.
I ran the simple numbers of 8 billion on a 1% infection rate and then a 1% mortality rate. we have a very long way to go here. we really need the antibody test to show that there are already a large % of walking survivors. that could possibly drop the mortality rate to under 1%
they probably want to counter act any negative market action from the jobs/unemployment report with the news of passing of the C19stimulus bill. hold on to your hats…
One positive consequence of the quarantine in New York City is that traffic accidents are way down!
Interestingly, not down to zero since a lot of people do not think staying at home is best for everyone.
https://trafficstat.nypdonline.org/2e5c3f4b-85c1-4635-83c6-22b27fe7c75c/view/89
Clearest skies ever here in SF. TWO GREEN FLASHES AT SUNSET IN A ROW a few days ago. I’m quite sure that for the first time since the dawn of the industrial revolution, daily total atmospheric pollution levels have dropped significantly (several 10’s of percentage points perhaps?). Sadly that won’t last.
PREMIUMS (“implied volatility”) are sky high in all kinds of issues. AMZN isn’t the highest but it’s high too, and it carries a lot of leverage per per contract ($187,000 worth of stock per contract) due to the super high price, and it’s VERY liquid in options. Which creates perfect conditions for “milking the premium.” You can do this pragmatically and safely with very few stocks.
Here’s a profit/loss curve for selling an iron condor (selling a put spread below and profiting on the full credit on any ending price above the upper put price, and selling a call spread and profiting on the full credit on any ending price below the lower option price), May 3 (only 7 trading days!), with a very wide spread, put spread sold at 1720/1700, call spread sold at 2040/2060. I make all the credit if the expiry price is in the range.
Assuming stops at the break even points, risk/reward is about 2.2/1. Accord to the raw statistics based on the probabilities based on the price…the odds are 57.8% of being in the winners circle (but note this # goes down due to stopping; some stop situations would have closed in the profit price range). But we know premium is crazy high, and we have a market situation where we expect correction action, not impulsive: big volatile waves going nowhere. So I surmise the risk of an excursion “too far” is much lower than premium suggests.
The price range for profit here is 18% of the current price: 9% range per side roughly. If you think the odds of holding the price for 7 days to +/-9% of current price is better than just 48% or so, then this trade starts to get +EV. If you think it’s more like 65%…it gets very +EV.
And note that there’s no risk of assignment as we exit if either of the sold spreads ever get in-the-money.
I’m so jealous I’ve looked for decades to see the green flash… never
My take on ES. Of course (A) or (W) may not be finished.
Nice. A long and wide W seems common here (29-32, 87, 01-02, 07-09). Punishing those trading the breakouts with some whipsaws. But there is a small chance, with this kind of momentum, that this is a 4 up of a larger impulsive A wave down, and the market will get rocked over the next week. Not impossible.
Here’s my take on the likely places for a pivot high of this swing. Channel structure and Fibonacci levels (retrace, and fit projected in blue).
Yep for sure could be a 4( poetry in a chart).
I’m having trouble seeing any buy signals just yet.
great overlaying channels-
great work, nice graph
first?
Secundo
Third