
S&P 500: Elliott Wave and Technical Analysis | Charts – March 24, 2020
Summary: Primary wave B may have begun today. It may be either a quick sharp bounce or a long lasting sideways consolidation. Targets are 2,651 or 2,934.
However, members with a lower risk appetite may prefer to wait for a new high above 2,466.97, or for even lower risk a breach of the black channel on the hourly charts, before having confidence in this view.
It is possible that primary wave A is incomplete while price remains below 2,466.97 and is still within the channel. The target is now at 1,929.
The biggest picture, Grand Super Cycle analysis, is here.
Last monthly charts are here. Video is here. Members are encouraged to view all three monthly charts. The third is much more bearish than this main wave count and remains a valid possibility.
ELLIOTT WAVE COUNTS
WEEKLY CHART
Click chart to enlarge.
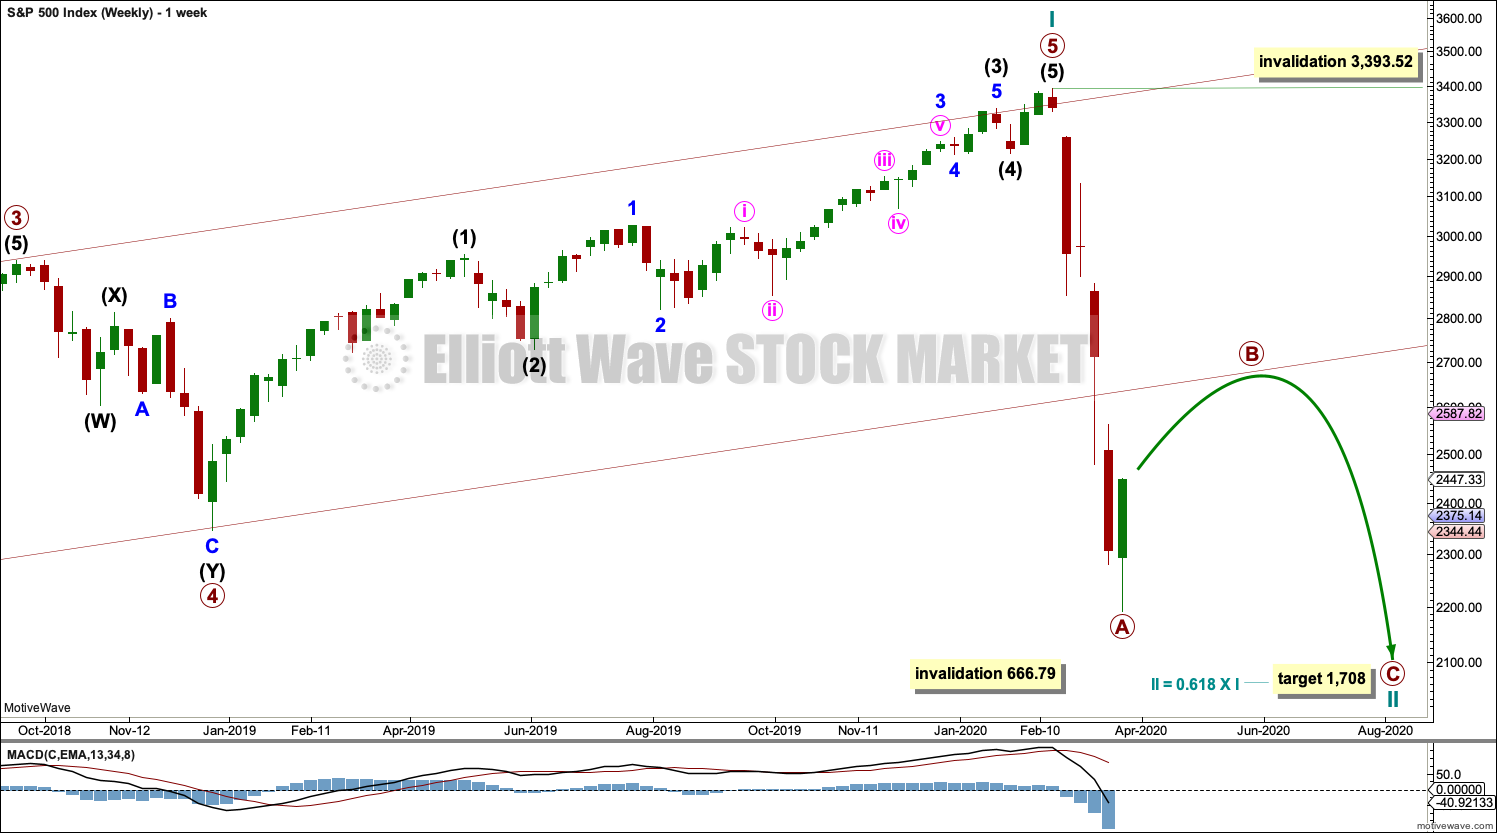
The channel is now breached by a full weekly candlestick below and not touching the lower edge. Further confidence in this wave count may be had.
Price is now below the 0.382 Fibonacci ratio of cycle wave I at 2,352. The structure of cycle wave II may need further to go to complete. The next Fibonacci ratio at 0.618 is now a preferred target for cycle wave II to end.
Cycle wave II would most likely subdivide as a zigzag; thus far that looks like what it is unfolding. When primary waves A and B may both be complete, then the target may be calculated using a Fibonacci ratio between primary waves A and C. At that stage, the final target may change or widen to a zone.
It is possible now that cycle wave II could be complete. This is outlined in a second alternate hourly chart below; in analysis of that chart I have outlined what needs to be seen for confidence in the alternate wave count.
Cycle wave II may not move beyond the start of cycle wave I below 666.79.
DAILY CHART
Click chart to enlarge.
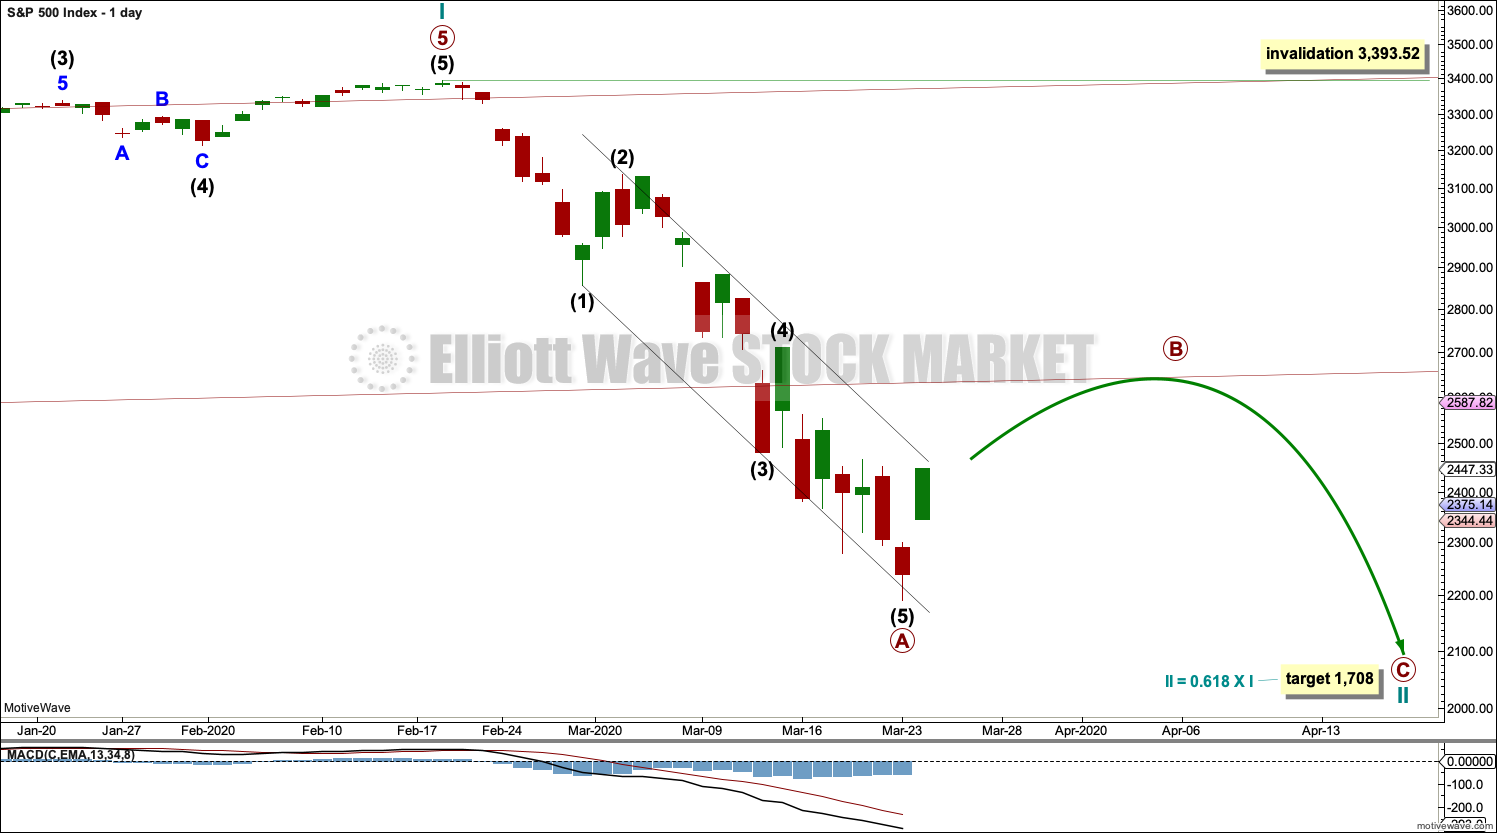
Redraw the wide maroon trend channel carefully: draw the first trend line from the end of primary wave 1 at 2,093.55 (December 26, 2014), to the end of primary wave 3 at 2,940.91 (September 21, 2018), then place a parallel copy on the end of primary wave 2 at 1,810.10 (February 11, 2016). The channel is fully breached indicating a trend change from the multi-year bull trend to a new bear trend.
Cycle wave II may subdivide as any Elliott wave corrective structure except a triangle. It would most likely be a zigzag. Primary wave A may be a complete five wave impulse. Primary wave B may not move beyond the start of primary wave A above 3,393.52.
HOURLY CHART
Click chart to enlarge.
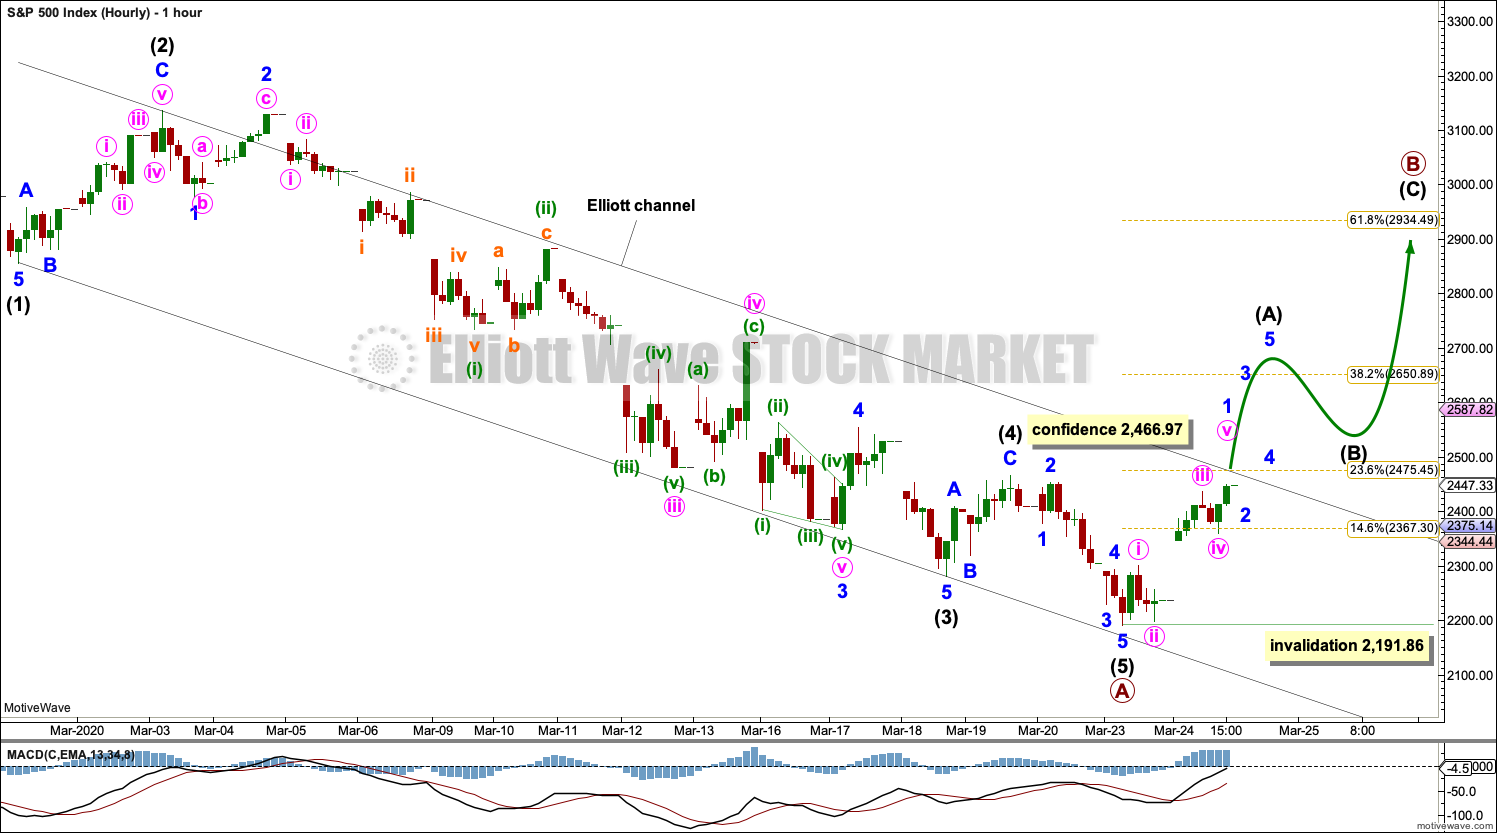
There is now enough support from classic technical analysis to make this the main hourly wave count today. It is possible now that primary wave A may be complete.
Fibonacci ratios within primary wave A are: intermediate wave (3) is 14.1 points short of 1.618 the length of intermediate wave (1), and intermediate wave (5) has no Fibonacci ratio to either of intermediate waves (1) or (3).
Draw the channel about primary wave A using Elliott’s first technique: draw the first trend line from the ends of intermediate waves (1) to (3), then place a parallel copy on the end of intermediate wave (2). A breach of this channel would add reasonable confidence to this wave count.
Primary wave B may subdivide as any one of more than 23 possible Elliott wave corrective structures. B waves exhibit the greatest variety in structure and price behaviour. Primary wave B may be a quick sharp bounce as in a single or multiple zigzag, or it may be a time consuming sideways consolidation as in a flat, combination or triangle.
If primary wave A is correctly analysed as a five wave impulse, then primary wave B may not move beyond its start above 3,393.52.
ALTERNATE HOURLY CHART
Click chart to enlarge.
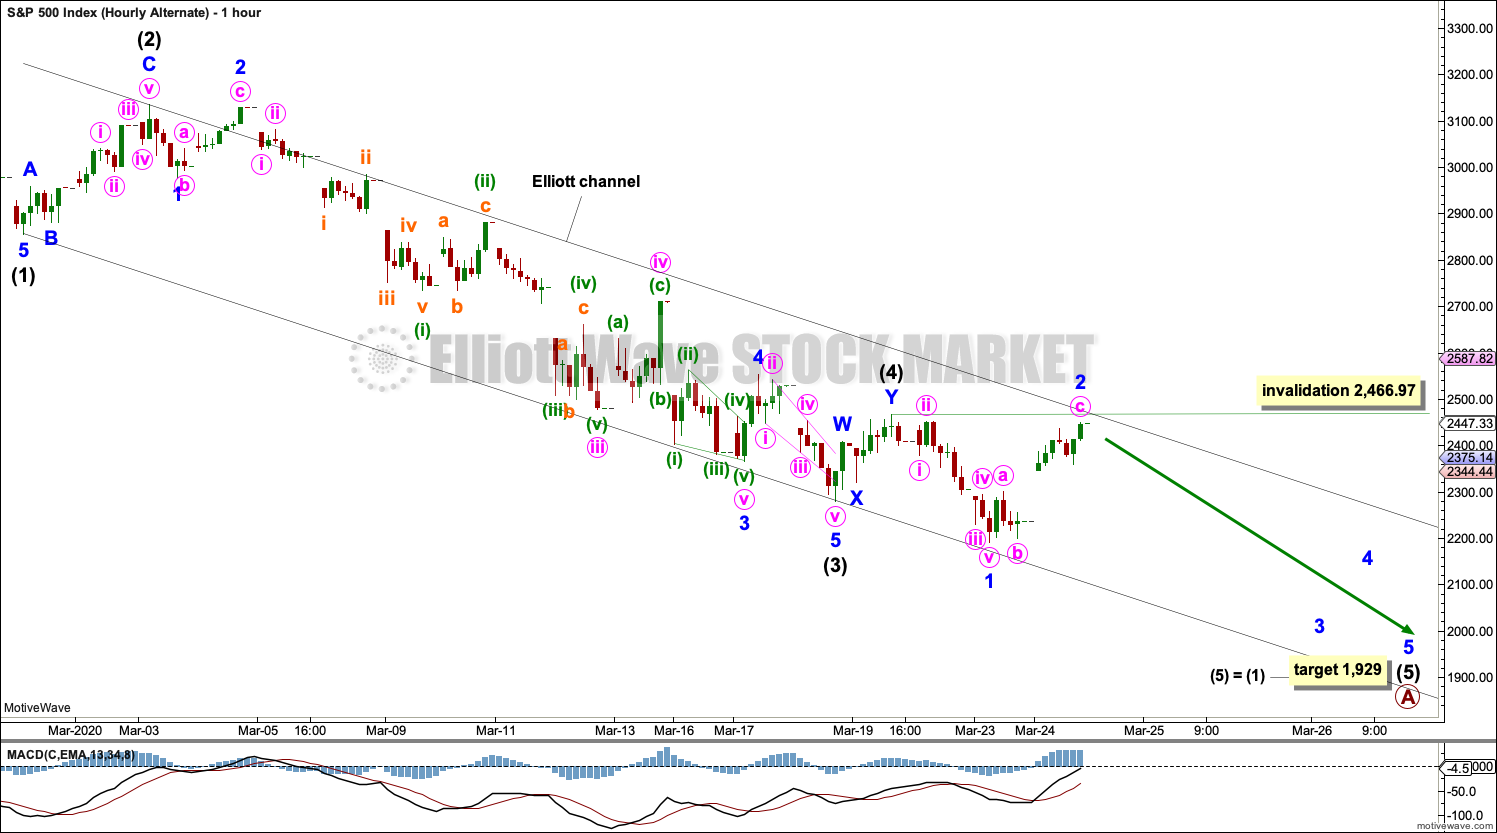
It remains possible that primary wave A may be incomplete.
Intermediate wave (3) is 14.1 points short of 1.618 the length of intermediate wave (1). The most common Fibonacci ratio for intermediate wave (5) would be equality in length with intermediate wave (1).
Within intermediate wave (5), minor wave 2 may not move beyond the start of minor wave 1 above 2,466.97.
Minor wave 2 looks like an impulse and does not look like a zigzag. This wave count does not have as good a fit as the main hourly wave count for this piece of movement.
TECHNICAL ANALYSIS
WEEKLY CHART

Click chart to enlarge. Chart courtesy of StockCharts.com.
A 32.8% drop in price (high to low) no longer has precedent within the larger bull market.
At the weekly chart level, conditions are now oversold; it is now more possible that a bounce or consolidation may arrive.
DAILY CHART
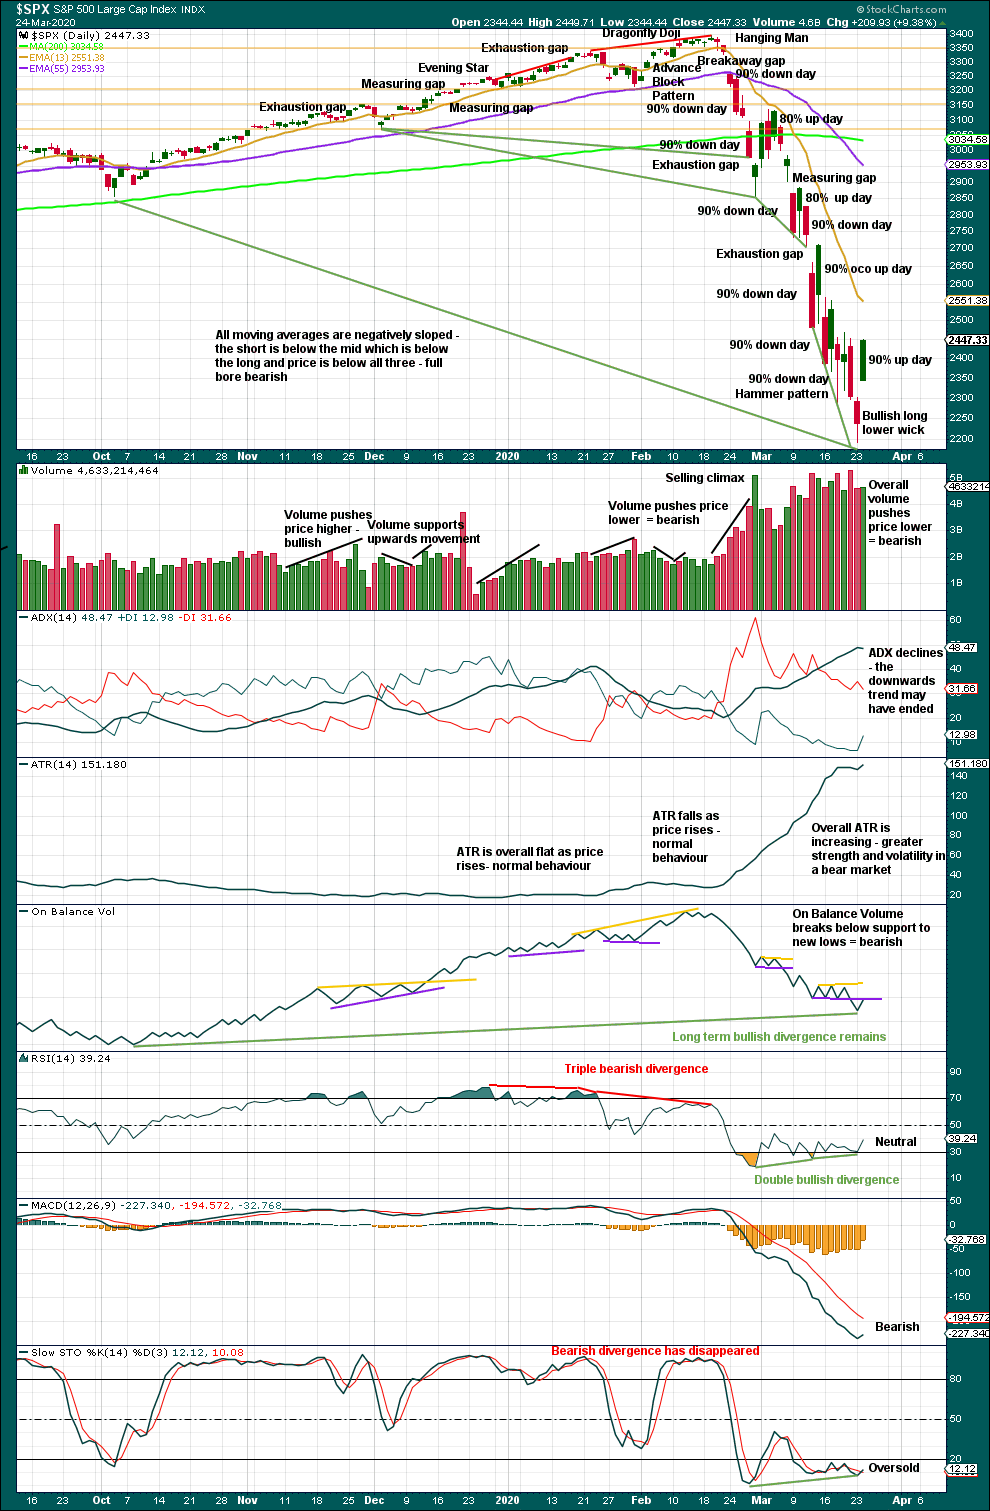
Click chart to enlarge. Chart courtesy of StockCharts.com.
There are now eight 90% downwards days in this strong downwards movement.
The following indicators still suggest a low may be in place soon:
– RSI reached deeply oversold and now exhibits short-term double bullish divergence with price.
– Stochastics reached oversold and now exhibits short-term bullish divergence with price.
– On Balance Volume continues to exhibit bullish divergence with price, although short-term bullish divergence has simply disappeared. On Balance Volume now confirms new lows short term.
A reasonable indication of a low in place is a strong 90% up day coming after the above technical indicators noted. This is not expected to be the end of the bear market, just a longer lasting correction within it.
BREADTH – AD LINE
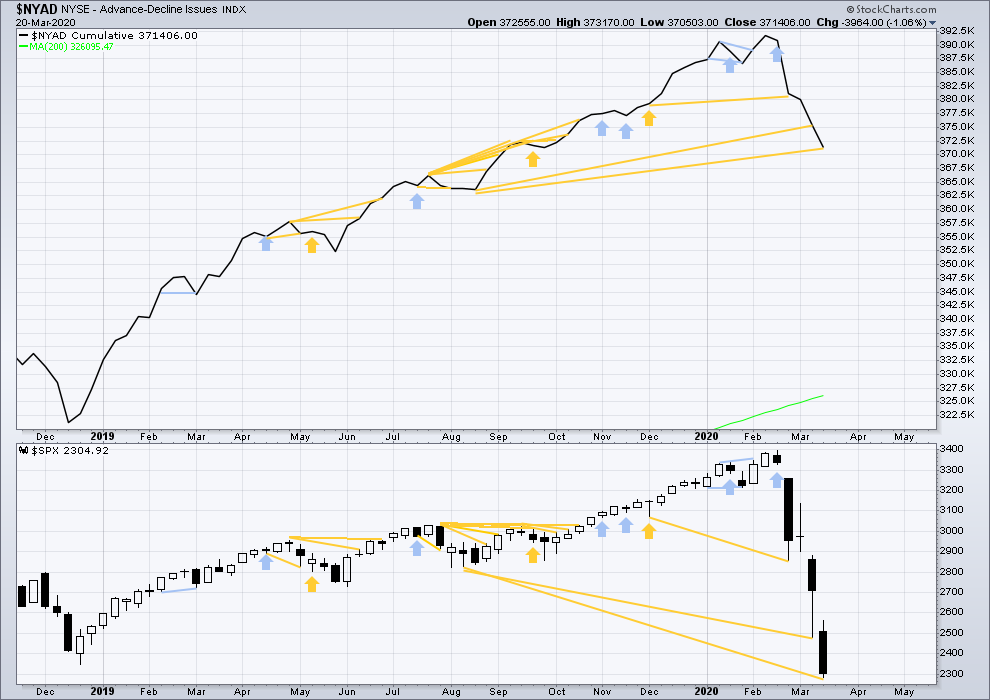
WEEKLY CHART
Click chart to enlarge. Chart courtesy of StockCharts.com. So that colour blind members are included, bearish signals
will be noted with blue and bullish signals with yellow.
Bear markets from the Great Depression and onwards have been preceded by an average minimum of 4 months divergence between price and the AD line with only two exceptions in 1946 and 1976. With no divergence between the AD line and price at the last all time high, this current bear market now makes a third exception.
In all bear markets in the last 90 years there is some positive correlation (0.6022) between the length of bearish divergence and the depth of the following bear market. No to little divergence is correlated with more shallow bear markets. Longer divergence is correlated with deeper bear markets.
This bear market comes after no bearish divergence. It would more likely be shallow, but this is a statement of probability and not certainty. So far it is slightly more than the 0.382 Fibonacci ratio of the bull market it is correcting (beginning March 2009).
Last week price made new lows below prior lows of August 2019, but the AD line has not. This fall in price does not have support from a corresponding decline in market breadth. This divergence is bullish and supports the view that this bear market may more likely be shallow.
Large caps all time high: 3,393.52 on 19th February 2020.
Mid caps all time high: 2,109.43 on 20th February 2020.
Small caps all time high: 1,100.58 on 27th August 2018.
DAILY CHART
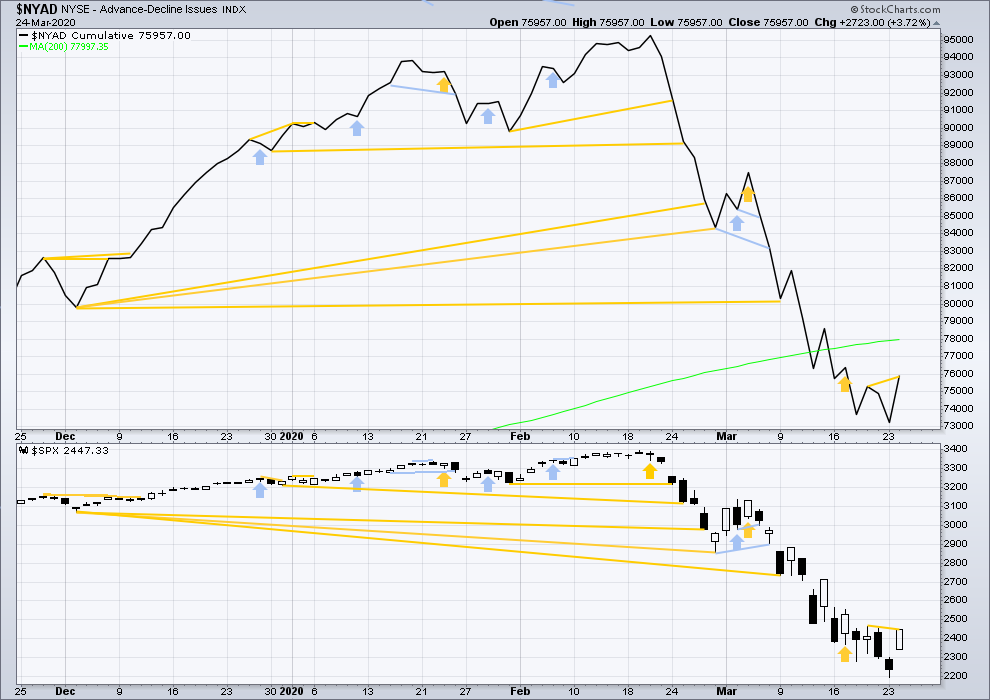
Click chart to enlarge. Chart courtesy of StockCharts.com. So that colour blind members are included, bearish signals
will be noted with blue and bullish signals with yellow.
Breadth should be read as a leading indicator.
Today the AD line has made a new high above the prior high three sessions ago, but price has not. This divergence is bullish and supports the main hourly Elliott wave count.
VOLATILITY – INVERTED VIX CHART
WEEKLY CHART
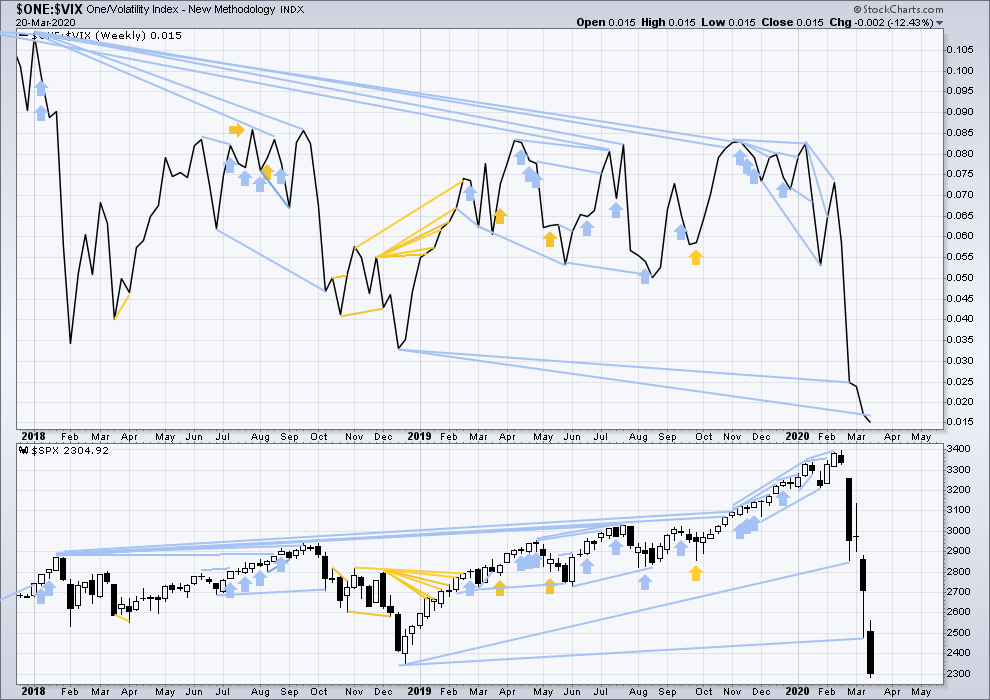
Click chart to enlarge. Chart courtesy of StockCharts.com. So that colour blind members are included, bearish signals
will be noted with blue and bullish signals with yellow.
The all time high for inverted VIX was on 30th October 2017. There is now over two years of bearish divergence between price and inverted VIX.
The rise in price is not coming with a normal corresponding decline in VIX; VIX remains elevated. This long-term divergence is bearish. It may now be resolved by this last fall in price, which meets the technical definition of a bear market.
Last week both price and inverted VIX moved lower to new lows. There is no new divergence.
DAILY CHART
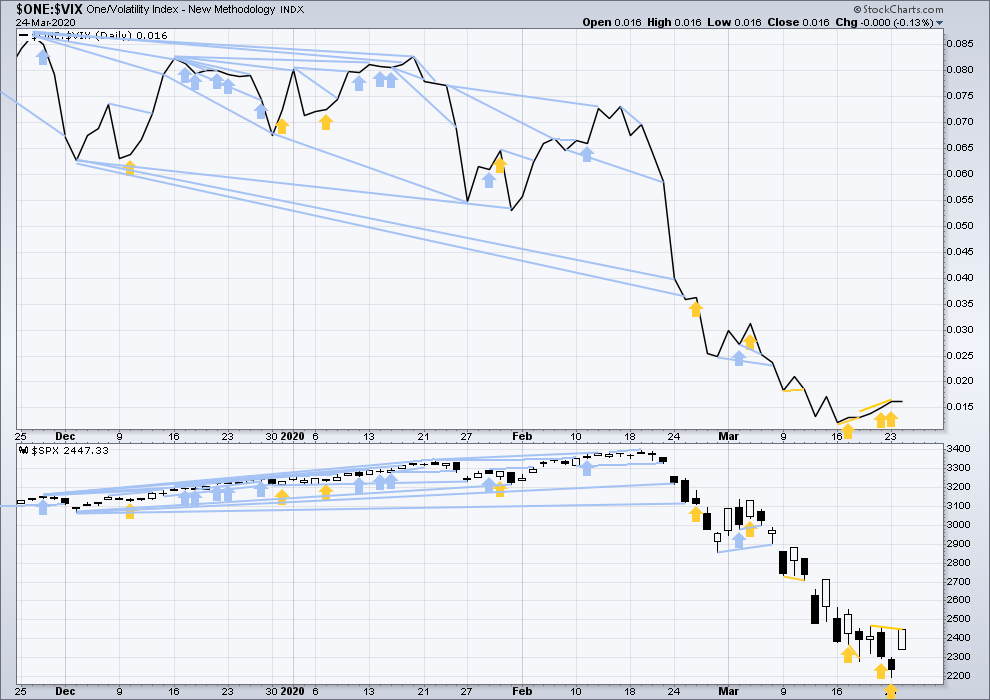
Click chart to enlarge. Chart courtesy of StockCharts.com. So that colour blind members are included, bearish signals
will be noted with blue and bullish signals with yellow.
Today inverted VIX has made new highs above the high three sessions ago, but price has not. This divergence is bullish and further adds to a cluster of bullish signals from inverted VIX that support the main hourly Elliott wave count.
DOW THEORY
Dow Theory has confirmed a bear market with the following lows made on a closing basis:
DJIA: 21,712.53 – a close below this point has been made on the March 12, 2020.
DJT: 8,636.79 – a close below this point has been made on March 9, 2020.
Adding in the S&P and Nasdaq for an extended Dow Theory, a bear market has now been confirmed:
S&P500: 2,346.58 – a close below this point has now been made on March 20, 2020.
Nasdaq: 7,292.22 – a close below this point was made on the March 12, 2020.
Published @ 07:26 p.m. EST.
—
Careful risk management protects your trading account(s).
Follow my two Golden Rules:
1. Always trade with stops.
2. Risk only 1-5% of equity on any one trade.
—
New updates to this analysis are in bold.
Apologise for the rather crude chart but would appreciate anyone’s views on whether this could be the way we are heading (hopefully self explanatory). I take a relatively simplistic approach to trends so the entry points are not overly accurate. I’d greatly appreciate any input. Thanks.
Have you examined the NKY in 1989…
Rumour has that smart money aggressively sold into the close.
got 25 puts, but I’m not smart ….
MM took my money …. 1 APR 210 P. cost me 1.84 when SPX was 2500. At 1475 they were worth 1.56 ….. hmmm
2475 that is
Open a STC order the instant you’re filled. Scalping’s the name of the game during bear market price action. Jack be nimble, Jack be quick! 🙂
Yeah bernie doesnt want stimulus. Probably will come around to that but for now what keeps market going higher?
Lots of data coming out tomorrow. To me we got a lot more wood to chop and 2900 seems ambitious.
Too volatile. Will just stick with my long oil at 23.80. Aiming for 35.
Problem with stimulus…
Hourly chart updated
The confidence point is passed and the channel is breached. Some confidence in this wave count may now be had.
I’m going to label intermediate (A) a possible impulse, for primary B a possible zigzag. But please be aware there are multiple other ways to label this movement. Shortly (another day or two?) we shall have to work with multiple alternate wave counts for primary B. Flexibility during B waves is essential.
This market still has high volatility and is vulnerable to big whipsaws. Risk management is absolutely essential in this environment please.
I’m labelling minor 2 complete, but that would have been rather brief and shallow. So I’m leaving the invalidation point at the start of minor 1 to allow for the possibility that minor 2 has not arrived yet.
test comment
and finally a chart
The market is zooming up.
The VIX opened gap down…and is zooming up too.
B careful.
I love it – B careful = “B” wave careful:) Nice:)
Yup. Nibbling at it today.
NDX tagged and turned at a 50%
SPX tagged and turned at my next Fibo fit level (2578).
RUT tagged and turned at a 76-78% level.
We’ll see.
Looks to me we might have similar day tomorrow going to 2600+ levels. We’ll see.
any thoughts on market reaction to unemployment numbers tomorrow am?
Might be a down reaction, but temporary (my take on it) – the thing is that everyone knows it’s happening. They think they already projected bad numbers in the market – so it might pull back to some fib level and then back up. But the real fundamental question is what we see tomorrow – is that it or will it go worse further. I think the latter is very highly likely and that market is not projecting yet. However, we would talk about it when we get to wave C (my take, again).
wtf knows. no one. the future is not pre-determined.
we need to let market action itself tell us when B is over. Again, I’ll be shocked if this thing makes its way up to 2900 ultimately. But I’ve been shocked before. So while I desperately want to build short positions here, I’m trying to be patient. Don’t pounce until that bird strays REALLY close!
One thing for sure: DO NOT be surprised by a massive down move AT ANY TIME. That can happen…and at some point in the near future, WILL happen.
I totally agree with you Kevin. The only reason why I think they might pull it up even to 2900 is to do exactly that – to make you hesitant and possibly drop your original theme that we are going down in wave C. I know they won’t shake you, but as Verne uses this great phrase, they will shake a lot of unstable trees this way pushing it as high as they can. Once they shake all FOMOs, then they will start doing normal fundamental thing. They did it on a way up to 3400 and they will do the same on a way down. As you said correctly: the patient cat gets the bird. 100%
ha you mean like the one that just stopped me out? gotta remember singles and doubles win games.
ira epstein said it best a few weeks ago… get out of the way…this is a market for the pros. dont try to be a hero.
Did start adding to my shorts…happy with that decision so far! But I’m using mid-May expiry to give me plenty of time to take heat if required.
The heavy final minutes selling screams momentum trader driven and short covering driven market last two days, B wave city.
Tomorrow might be very interesting indeed.
Legendary Gann expert Alan Lax posted a presentation on the free Trading Analysis Wednesday youtube presentation.
Most interesting is the remarkably accurate pi based time analysis and harmonic relationships.
Alan Lax starts at 7.57 minutes. I wish he presented the entire hour.
youtube DOT com/watch?v=6hznXx96gvY&t=2748s
Also check out his charts on the Ryefield Capital website.
I watched that. What I notice is that these guys come up with these relationships after the fact. He didn’t present anything going forward based on similar relationships. His only go forward view was based on classical channel structure. That to me is telling. Weird relationships (the degree of movement of Uranus to something or other…oh please) can be found everywhere looking backward.
The only guy I’ve found using Gann in a forward looking way is Jeff Cooper. Trying to figure out how to use the big wheel (just a spiral of successive integers) my self. It’s interesting. But how valuable I don’t yet know.
Maybe take another look, he did provide quite a bit of predictive data.
The pi relationships DID provide forward looking turn zones, (as well as past turn zone examples).
I found the harmonic examples remarkable too.
Not for everyone of course, but astrological forecasts have value, imo.
I’ll respect your viewpoint and withhold additional comment. Except to say, I’m an engineer and scientist by training. I won’t debate astrology.
I appreciate your restraint, especially as a scientist, engineer and scholar.
I make no judgement about astrology personally, but just about every technique Gann did uses it in some way.
Kevin. My son is 6 years of age. The closest thing I want him to do with what dad does on a aeroplane is to enjoy first class.
He has a appetite for science and no I don’t want him to follow in my footsteps flying a B777 professionally. Hopefully something like the quals you have will do me fine.
correction – think still going up in Minor 1
DJT up 6.6%
8%
Time for an attempt at Fibonacci magic on this move up off the lows.
Blue lines are where I find high fit with the Fibo structure defined by a concluding pivot high at that level. We’ll see. One at a time.
By the way, this is now the largest up move since the bear market started, adding to confirming evidence it is indeed the B wave.
anyone think Minor 2 is not yet over?
I’m allowing for that possibility
negative rates… OMG
Yes Sir! A big deal!
Full lockdown here in Panama now. Borders closed, curfew 5pm to 5am and only allowed to go out one hour a day. The time we can go out is determined by the last digit on our id, for us our passports. Cesar’s digit is different to mine and I don’t think I want to go out without him, so essentially I’m fully locked inside.
Which means I have more time for work. I need to keep busy after all.
Hi Lara, I also subscribe to your gold service. Have you had a chance to look at bitcoin?
I did the other day…. will update today
Perhaps a good read is in order.
Might I suggest “Atlas Shrugged” by Ayn Rand? 🙂
You might take a gander at the review “Atlas Shrugged is a Ridiculous Book” before spending your money. I did read the book at 16, though at the advice of my father I skimmed through the 40 page speech full of nothing.
Both you and Cesar stay safe and healthy-we need you in these times of uncertainty.
Good morning everybody.
The confidence point is breached, the alternate hourly wave count is invalidated. Right now this remains the only wave count.
Price remains within the channel, just. It might be breached this session, lets see.
Kevin. I’m just trying to understand. Your waiting for north of Lara’s targets if in fact we are in a B wave
No. I’m waiting for the B wave to complete, to take significant shorts. Whereever that may be price wise.
I’m much less “bullish” about the B wave ultimate size than Lara is currently projecting. Lara doesn’t consider the fundamental backdrop, and I value that a lot. I do add in consideration of the fundamental backdrop, and I think it’s dire at a historic level. Hence, I’m rather doubtful B plays out as diagrammed; it would really shock me if the market would go so high while the world’s economy is “turning off”. So while Lara’s call here looks tempting to play on the long side, I’m being very cautious about that. I may (may) again try very short term tactical longs with super tights stops if a very clear set up and trigger presents itself, but I’m trying to keep my fingers generally away from that button here. Overnight long holds in particular strike me as full of risk right now. We could have another overnight limit down move at any time.
Thankyou Kevin. I have never i stood this social mood and that fed printing cash never effects it. I hope I understand someday why this is the case.
RUT finished a minute 4 up??? Tag and turn off a key 61.8%, well structured ABC up, and good proportion with the identified 2.
Good bye to that 61.8% level…next up, the 76-78%.
Color me chicken, but I’ve taken my longs (sold put spreads for Friday) for decent partial profits and taken my rear off the hot seat. Sure I’ll regret it later when B charges higher…perhaps. But I don’t trust “tomorrow”, and counter trend trading in the strongest down trend in history is risky. Quick bites work for me.
Time to wait for the B wave top for me.
I took the long position at 2400. Best trade ever. Must admit tho I’m not sure when to get back in. Water is mighty warm
I’m also out with a profit. I think we will be able to buy at a lower level tomorrow.
Nice!
My play now: wait out the B wave. No more longs here. The trend is our friend! I will wait for it to begin to resume…and pounce short. I view the fundamentals as absolutely dismal, and the market is grasping at straws re: $’s being thrown into the economic black hole. If the unemployment # doesn’t do it this week, it or other economic reports will be devastating probably next week.
Kevin even a small contract size if the target up to 2600 plus ?
Maybe. Not for me. Waiting to get in line with the higher TF trend (I’ve already got shorts for mid April and mid May, want to add “at the top”).
I was actually very lucky. Rode Longs’s up to 2480. Then shorts down to 2420. So it was a great day.
Time to trade the top of the B or 2 wave up in gold for me. Selling GLD 152/155 call spread for April 17. Assuming no horrific gaps I thinks it’s about 1-3 or 1-4 risk-reward (I stop at GLD > 156).
Still waiting to short the $ by selling FXE call spread…
Hi everyone.
Do we need to close a cash session say a over 2466 for confirmation of this B wave or if it breaches the target through out the session then that’s ok
Any amount at any time frame beyond my confidence points is always going to be enough for them to give confidence.
Because the EW rules are absolute. No part of a second wave correction may move beyond the start of the first wave.
The only caveat is that this applies only to cash session data, not futures. Futures are a different (albeit related) market and so may have a slightly different wave count.
Thankyou Lara.
Looks like the bankster line in the sand is ES 2400.
I suspect what happens there will be probative for the cash session…
Agreed Verne. I wonder if during the cash session we test the 2500 again. As it did during the futures. Short sellers.
Here is a good paper from the N.Y. FED on mortgage spreads. A real canary imho…
https://www.google.com/url?sa=t&source=web&rct=j&url=https://www.newyorkfed.org/medialibrary/media/research/staff_reports/sr674.pdf&ved=2ahUKEwjkiO6cw7XoAhUMWK0KHfLOCJEQFjACegQIAxAB&usg=AOvVaw0ZDKpwNU6V3KS3asxDo_PO
Much appreciated Verne!
I am learning so much from all you folks, thanks for sharing the knowledge!
🙂
Futures jumped on the aid deal…$2 trillion. helicopter money
Replied to your post yesterday a bit late your time Verne….not sure if you’ll see it:
“Hope so Verne – long now on ES with a close stop!
This volatility has to stop-playing havoc with Initial Margins. Although it does move our old friend price a lot more!”
There is a pitched battle going on in the futures markets, which have become strangely illiquid of late, and so increasing volatility of price swings.
Were it not for that huge shadow on one of the flag candles, one would be tempted to see a bull flag in VIX. One smart trader I know once told me that unlike EWT, where any price movement beyond a specific point will firmly invalidate a count, one can be flexible in flag and pennant pattern recognition and focus on CLOSING price of the candle. If that is truly a bull flag in VIX….!
The measured target is there for all to see….YIKES!!!!
Trading friend of mine who keys heavily off VIX and VVIX patterns sees the same thing: he believes a VERY large down move is just ahead, Thursday and/or Friday.
My suspicion swirls around Thursday’s unemployment report.
My broker is showing price breached 2466, so the alt is discarded already?
No, that’s in the futures market. The levels here only apply to SPX. Futures have already turned back down and are below that level now as a matter of fact. Who knows by open tomorrow; over night futures have been IN-SANE last few days!
Waiting for the set up you like is very sane. Trading B waves long is fraught with peril in normal times, and these are anything but.
If the B wave develops, then as it completes and starts to roll over…might be one of the great short opportunities of a lifetime.
I only trade futures tho.
Overnight inventory is almost always short. ?
In my experience, the best way to trade a B wave is to catch its first (A) wave either up or down…
After that, it’s sit and watch time to see what unfolds. I’m hoping futures will trade lower due to Congress debacle passing the stimulus bill and hopefully have a good entry price to go long.
Too risky for long after fedzooka is priced in. More likely we trade 2k before any consolidation starts. For that reason I rather sit it out
Foist!
old school!!! these days #2 ain’t bad either…
turd is best
No sh_t…! 😀
Evening Verne- I saw your note about 5g and CV im assuming this is based in the idea that Wuhan was the first city to have a full 5g rollout. with some digging, similar pandemics also occurred around prolification of radio and, later, radar waves around the world. at first glance it seems to look suspicious. however further digging also shows that, specifically, viral out breaks originating in animals, also ravaged the earths human population well prior to our cells being corrupted by todays man made electro magnetic radiation. I’m sure that our cellular health is being effected someway by the electrification of our neighborhoods, homes and pockets. but scratching the surface- claims that 5g specifically are at fault are doubtful. overlaying maps of CV infection centers, 5g coverage (as well as excessive use of glycophospahte-roundup) also coincide with population centers, which in my opinion is just coincidence, as it makes sense that we would only roll out 5g in areas where people can/would use it.
Thanks! Good info.