
S&P 500: Elliott Wave and Technical Analysis | Charts – March 23, 2020
Summary: It may be safest to assume the downwards trend remains intact while price remains below 2,378.08. The short-term target remains at 2,173; if this is wrong, it may not be low enough now.
However, at the last low there is a Hammer reversal pattern that comes while RSI exhibits triple bullish divergence, On Balance Volume has not confirmed new lows, and ADX is now very extreme. Conditions are now set for a strong bounce. Be aware this market is vulnerable to large whipsaws.
A breach of the downwards sloping channel on the daily chart would strongly indicate a multi-day to multi-week bounce may have arrived. A new high above 2,466.97 would provide further confidence.
The final target is now at 1,708.
The biggest picture, Grand Super Cycle analysis, is here.
Last monthly charts are here. Video is here. Members are encouraged to view all three monthly charts. The third is much more bearish than this main wave count and remains a valid possibility.
ELLIOTT WAVE COUNTS
MAIN WAVE COUNT
WEEKLY CHART
Click chart to enlarge.
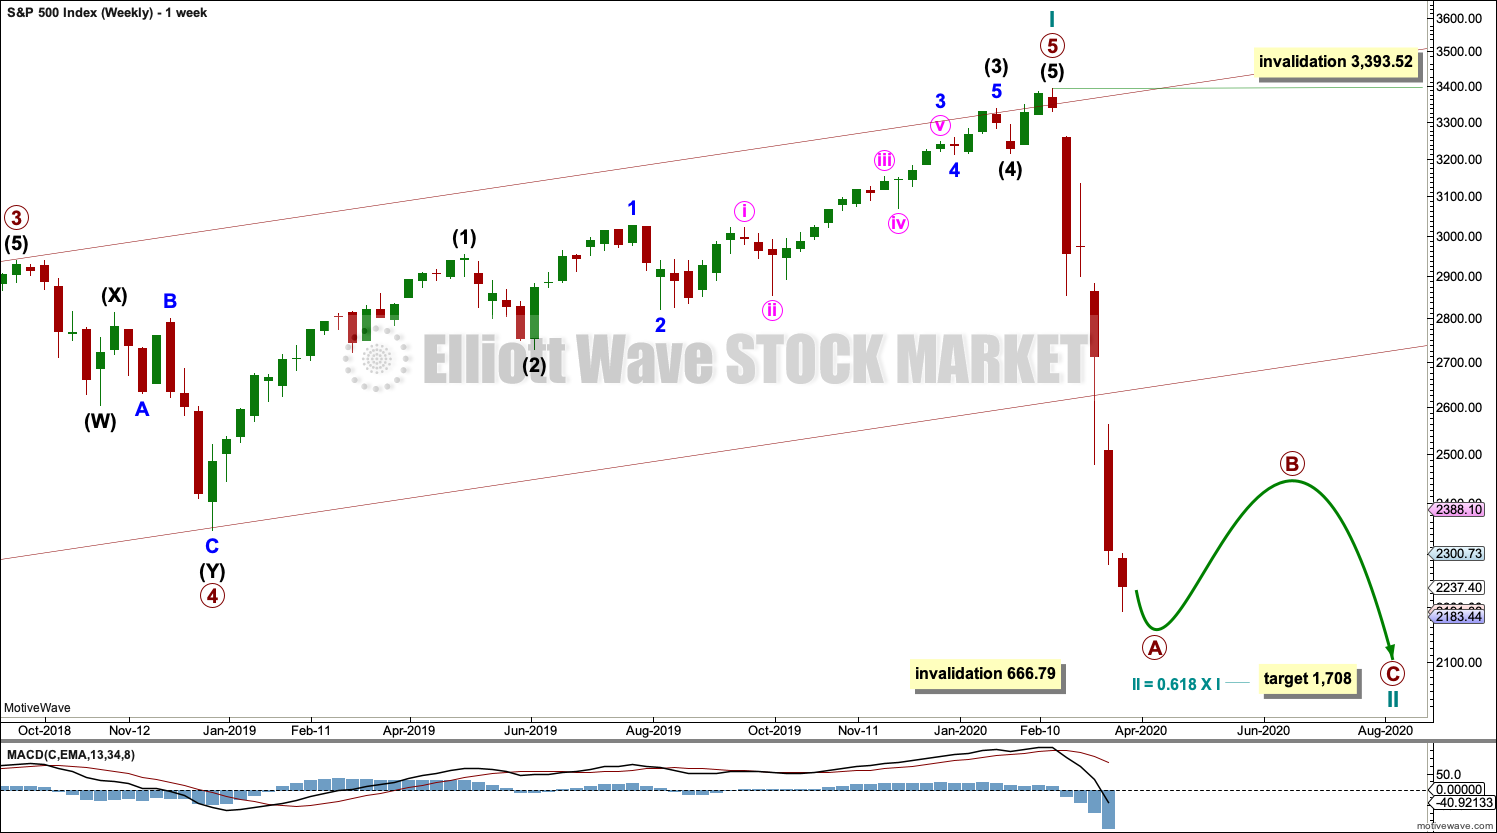
The channel is now breached by a full weekly candlestick below and not touching the lower edge. Further confidence in this wave count may be had.
Price is now below the 0.382 Fibonacci ratio of cycle wave I at 2,352. The structure of cycle wave II may need further to go to complete. The next Fibonacci ratio at 0.618 is now a preferred target for cycle wave II to end.
It is possible now that cycle wave II could be complete. This is outlined in a second alternate hourly chart below; in analysis of that chart I have outlined what needs to be seen for confidence in the alternate wave count.
Cycle wave II may not move beyond the start of cycle wave I below 666.79.
DAILY CHART
Click chart to enlarge.
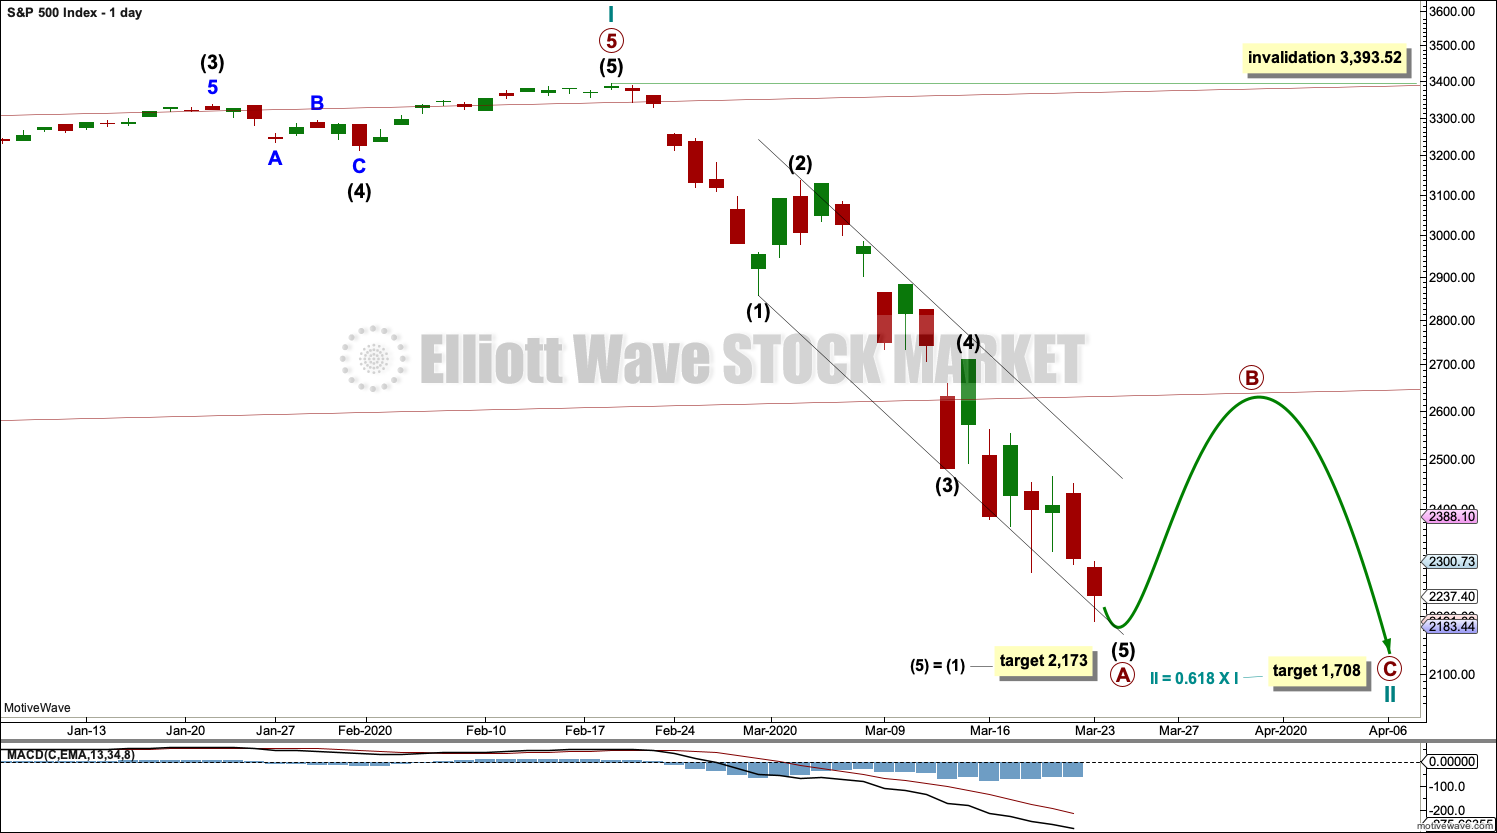
Redraw the wide maroon trend channel carefully: draw the first trend line from the end of primary wave 1 at 2,093.55 (December 26, 2014), to the end of primary wave 3 at 2,940.91 (September 21, 2018), then place a parallel copy on the end of primary wave 2 at 1,810.10 (February 11, 2016). The channel is fully breached indicating a trend change from the multi-year bull trend to a new bear trend.
Cycle wave II may subdivide as any Elliott wave corrective structure except a triangle. It would most likely be a zigzag. Primary wave A may be an incomplete five wave impulse. Primary wave B may not move beyond the start of primary wave A above 3,393.52.
Within primary wave A, there is no Fibonacci ratio between intermediate waves (1) and (3). This makes it more likely that intermediate wave (5) may exhibit a Fibonacci ratio to either of intermediate waves (1) or (3). The most common Fibonacci ratio for a fifth wave is equality in length with its counterpart first wave.
HOURLY CHART
Click chart to enlarge.
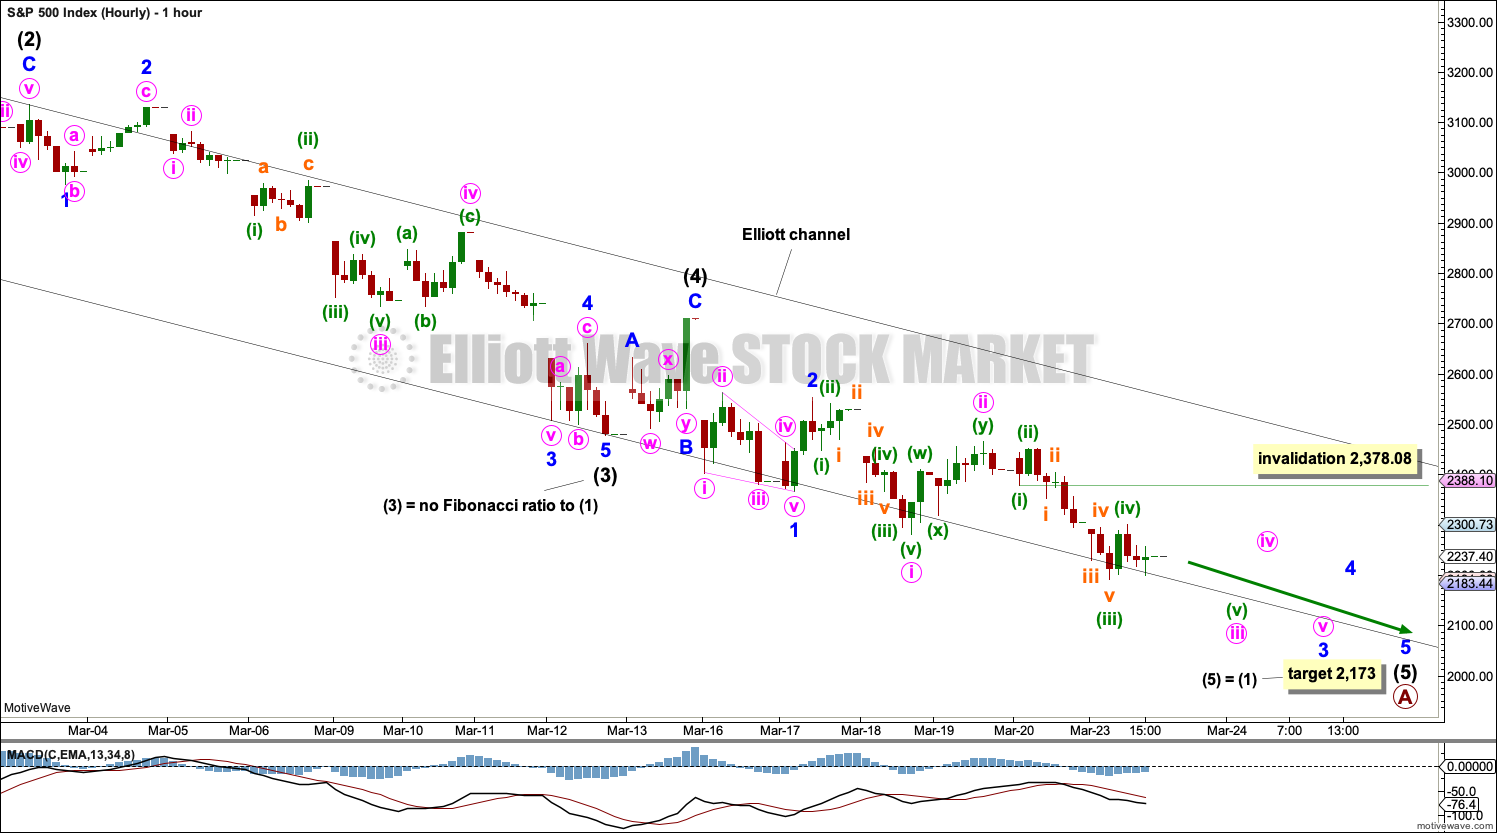
It is always safest to assume the trend remains the same until proven otherwise. The trend now is down, so assume it may continue down until this wave count is invalidated.
Primary wave A may be an incomplete five wave impulse.
Draw a channel about primary wave A using Elliott’s first technique: draw the first trend line from the ends of intermediate waves (1) to (3), then place a parallel copy on the end of intermediate wave (2).
During bear moves, this market sometimes behaves like commodities. It may exhibit swift strong fifth waves. Look for the possibility for intermediate wave (5) to end with further strength. If the target is wrong, it may not be low enough.
Intermediate wave (5) must subdivide as a five wave motive structure, either an impulse or an ending diagonal. An impulse is most likely. That is what shall be expected until and unless overlapping indicates a diagonal.
Within intermediate wave (5), minor waves 1 and 2 may be complete. Minor wave 3 may have moved through its middle today. Within minor wave 3, minute waves i and ii may be complete. Within minute wave iii, minuette waves (i) through to (iv) may be complete. If minuette wave (iv) moves any higher, then it may not move into minuette wave (i) price territory above 2,378.08.
If this wave count is invalidated with a new high by any amount at any time frame above 2,378.08, and if the black Elliott channel is breached, then that would indicate a trend change. At that stage, assume primary wave A is over and primary wave B has begun.
TECHNICAL ANALYSIS
WEEKLY CHART

Click chart to enlarge. Chart courtesy of StockCharts.com.
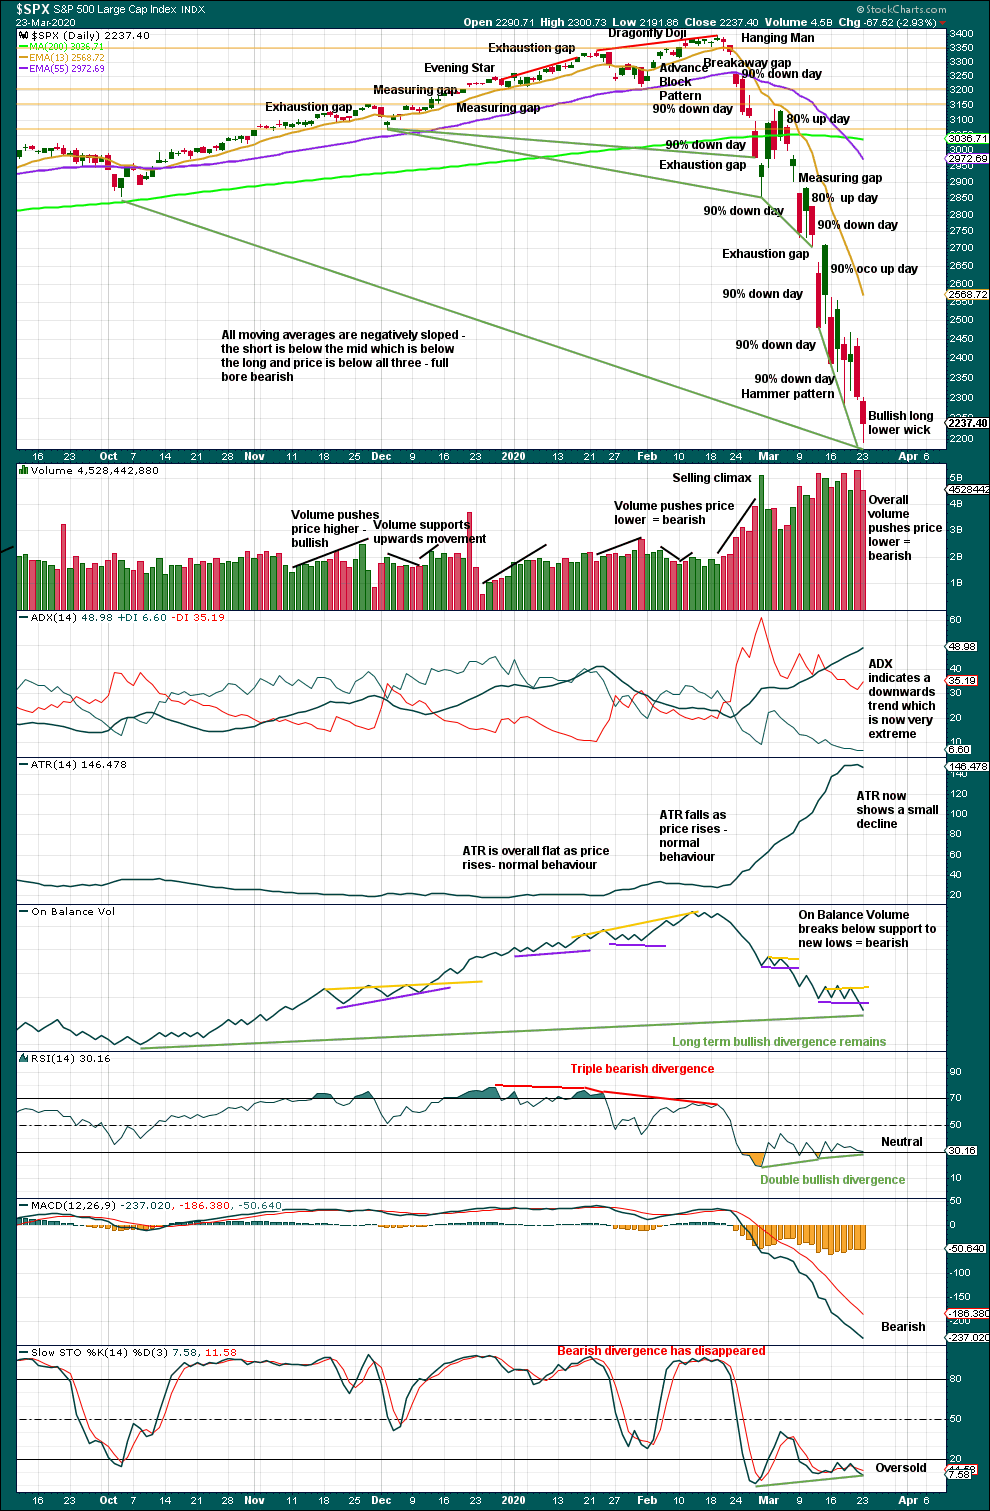
A 32.8% drop in price (high to low) no longer has precedent within the larger bull market.
At the weekly chart level, conditions are now oversold; it is now more possible that a bounce or consolidation may arrive.
DAILY CHART
Click chart to enlarge. Chart courtesy of StockCharts.com.
There are now eight 90% downwards days in this strong downwards movement.
The following indicators still suggest a low may be in place soon:
– RSI reached deeply oversold and now exhibits short-term double bullish divergence with price.
– Stochastics reached oversold and now exhibits short-term bullish divergence with price.
– On Balance Volume continues to exhibit bullish divergence with price, although today short-term bullish divergence has simply disappeared. On Balance Volume now confirms new lows short term.
If price bounces here, then it would most likely be a correction within an ongoing bear market and not necessarily the end of the bear market.
At this stage, there is not any evidence of a sustainable low in place.
BREADTH – AD LINE
WEEKLY CHART
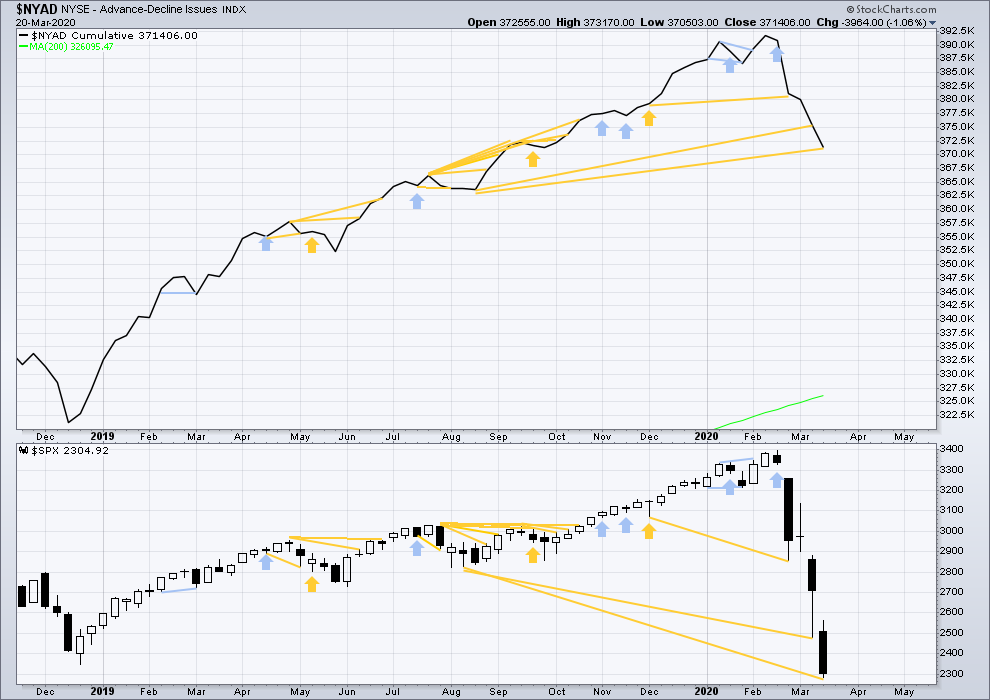
Click chart to enlarge. Chart courtesy of StockCharts.com. So that colour blind members are included, bearish signals
will be noted with blue and bullish signals with yellow.
Bear markets from the Great Depression and onwards have been preceded by an average minimum of 4 months divergence between price and the AD line with only two exceptions in 1946 and 1976. With no divergence between the AD line and price at the last all time high, this current bear market now makes a third exception.
In all bear markets in the last 90 years there is some positive correlation (0.6022) between the length of bearish divergence and the depth of the following bear market. No to little divergence is correlated with more shallow bear markets. Longer divergence is correlated with deeper bear markets.
This bear market comes after no bearish divergence. It would more likely be shallow, but this is a statement of probability and not certainty. So far it is slightly more than the 0.382 Fibonacci ratio of the bull market it is correcting (beginning March 2009).
Last week price made new lows below prior lows of August 2019, but the AD line has not. This fall in price does not have support from a corresponding decline in market breadth. This divergence is bullish and supports the view that this bear market may more likely be shallow.
Large caps all time high: 3,393.52 on 19th February 2020.
Mid caps all time high: 2,109.43 on 20th February 2020.
Small caps all time high: 1,100.58 on 27th August 2018.
DAILY CHART
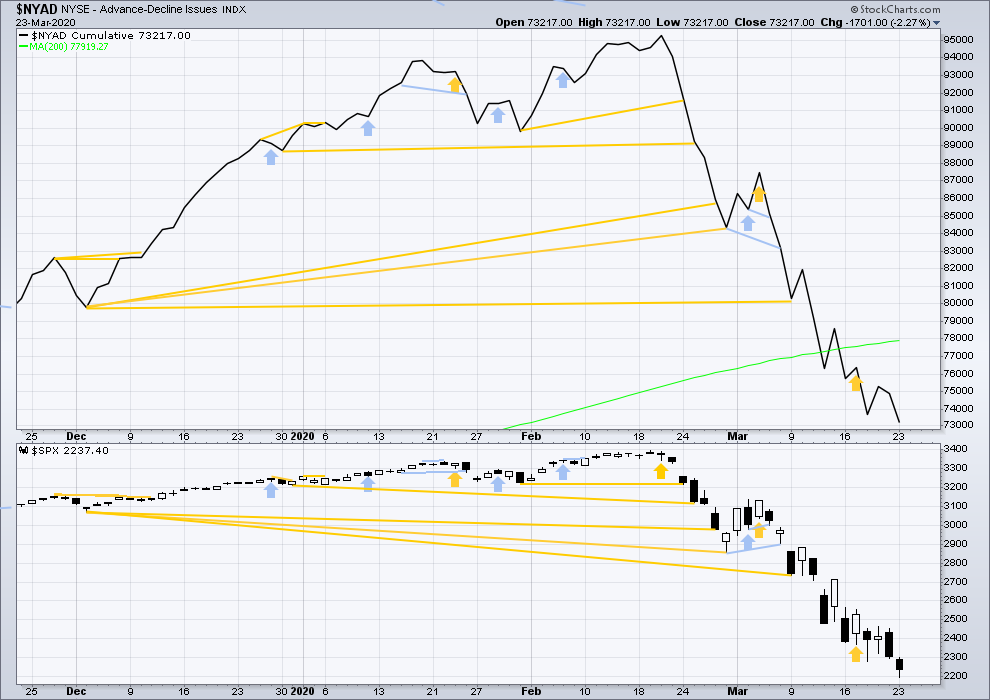
Click chart to enlarge. Chart courtesy of StockCharts.com. So that colour blind members are included, bearish signals
will be noted with blue and bullish signals with yellow.
Breadth should be read as a leading indicator.
Both price and breadth have moved lower to make new lows. There is no new short-term divergence.
VOLATILITY – INVERTED VIX CHART
WEEKLY CHART
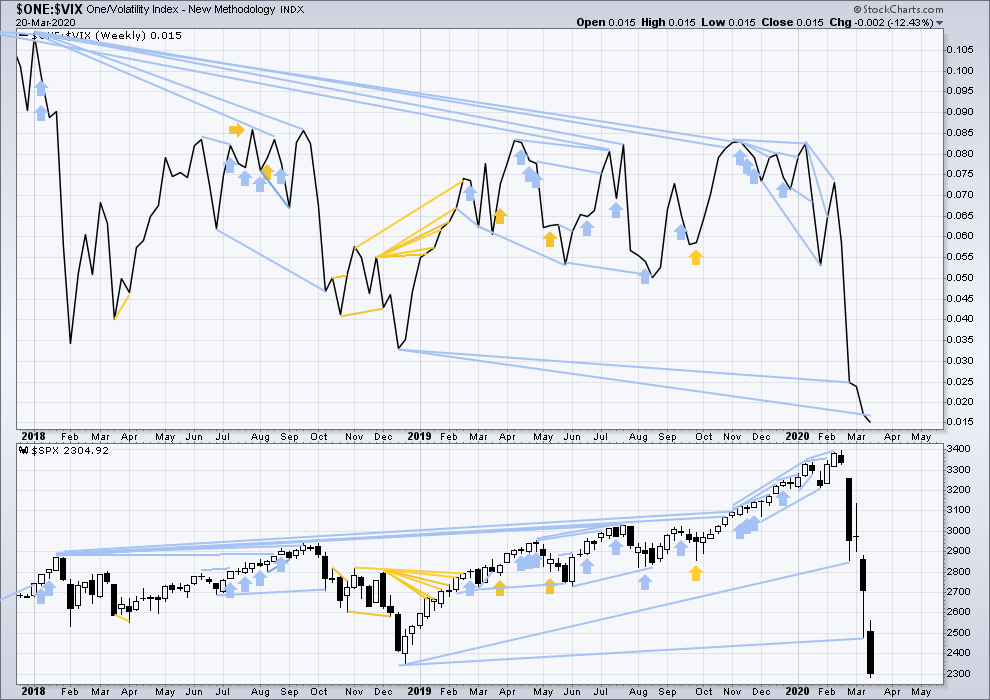
Click chart to enlarge. Chart courtesy of StockCharts.com. So that colour blind members are included, bearish signals
will be noted with blue and bullish signals with yellow.
The all time high for inverted VIX was on 30th October 2017. There is now over two years of bearish divergence between price and inverted VIX.
The rise in price is not coming with a normal corresponding decline in VIX; VIX remains elevated. This long-term divergence is bearish. It may now be resolved by this last fall in price, which meets the technical definition of a bear market.
Last week both price and inverted VIX moved lower to new lows. There is no new divergence.
DAILY CHART
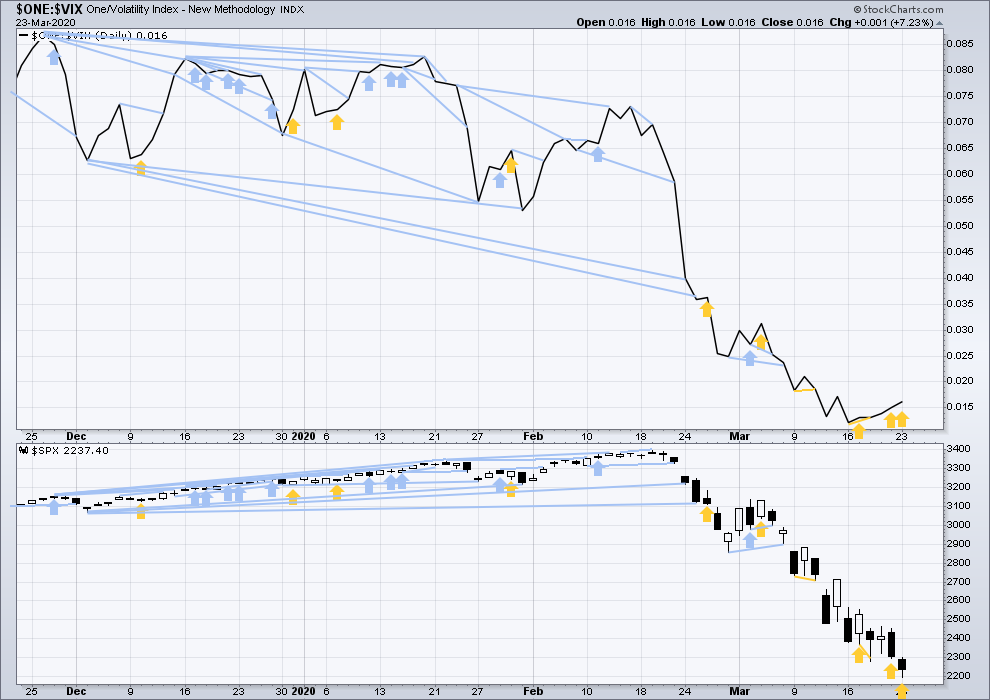
Click chart to enlarge. Chart courtesy of StockCharts.com. So that colour blind members are included, bearish signals
will be noted with blue and bullish signals with yellow.
On Monday again price has moved lower, but inverted VIX has moved higher. This divergence is bullish. There is now a small cluster of three bullish signals from inverted VIX suggesting a low may be in soon.
DOW THEORY
Dow Theory has confirmed a bear market with the following lows made on a closing basis:
DJIA: 21,712.53 – a close below this point has been made on the March 12, 2020.
DJT: 8,636.79 – a close below this point has been made on March 9, 2020.
Adding in the S&P and Nasdaq for an extended Dow Theory, a bear market has now been confirmed:
S&P500: 2,346.58 – a close below this point has now been made on March 20, 2020.
Nasdaq: 7,292.22 – a close below this point was made on the March 12, 2020.
Published @ 07:20 p.m. EST.
—
Careful risk management protects your trading account(s).
Follow my two Golden Rules:
1. Always trade with stops.
2. Risk only 1-5% of equity on any one trade.
—
New updates to this analysis are in bold.
What if A is not over? Seems a little suspicious and almost too easy to let longs get a free ride in a downtrend.
The market is what it is and does what it wants.
Just as in a bull market it’s never straight up, in a bear market it’s never straight down. Just often a lot quicker.
Yeah well. I think there is an AHA moment coming up because A may not be over.
AHA moment has already happened by realising [A] has finished.
Guess there will be many of these moments then.?
Ha no doubt. But hopefully accompanied by some very factual moments as well.
I’m looking at this B wave up as the top of the beginning of possibly the sale of the century.
I realise that this may be a bit of inside baseball but has anyone, medical folk on the site in particular, been following the literature regarding the enhanced gain of CV under 5G EMF?
BTW, an ES move above 2500 will imho confirm that the B wave up likely underway, green VIX print notwithstanding. Price trumps all…
Hope so Verne – long now on ES with a close stop!
This volatility has to stop-playing havoc with Initial Margins. Although it does move our old friend price a lot more!
Today was a solid 90% up day. Up volume 94% and advancers 92%.
I’m going to call the end of primary A and today the first day of primary B.
Green vix after the close,, Verne says you know what to do
Keep an eye on ES 2500. The VIX long tail does look bullish for vol but could be a head-fake…
11% up day in Dow – best day since 1933 – just confirms the fact that we are in a bear market – the corrections up are steep and fast.
Hourly chart updated:
Either this
or this
and you’ll notice that minor 2 doesn’t look like a zigzag, it looks like an impulse.
which supports the first chart, not this one.
Yes, I see 5 waves on the SPX, but not on the future. ES is for the moment a clear 3-wave up, and needs to make a 4-5 sequence to catch up with the SPX. (for ES, 2386 is the level at which 4 would enter price territory of 1)
Also 2499 on ES is the equivalent invalidation point on the main chart of minor 1 down.
So we are above the top of the channel now? And I assume we need to close above it to assume we are in the B wave?
No, we are roughly in the middle of Lara’s “wide” channel that encompasses all the action off the all time high. I have (roughly) that channel on this chart.
There was a more narrow, sharply down channel around price from 3/3 onward. Lara never showed that one. It’s fully busted to the upside; dead.
The B wave can stay in this channel and tag it’s upper line and be up a whopping 22% from the low. Plenty of movement to qualify a mighty B wave in my book.
In fact, I think 2700 area and that upper channel line is a very logical termination point for the B wave. But yea, it could go higher, and yea, it could not reach that high too.
I’ve got it right just below the top of the channel
My error, my channel here is “the whole shootin’ match”, while yours starts at the high of the 2.
Anyone else noticing the stealth move on vol instruments?
Got filled on a “stink bid” on UVXY April 100 strike calls this morning for 2.10 which are already bid at 4.00….gotta love sniper trades! 🙂
BTW, if VIX prints a green candle…well, you know what to do…!
Notice VIX trending up all day long after opening gap down consistent with gap up SPX open. But quite divergent since!
Now we’ve got SPX stalled under the bullish symmetry level, and RUT turned down for a second time at a 50% retrace level (RUT loves 50% levels for pivots).
The B wave horses are not out of the barn yet.
Kevin would you suspect those unemployment numbers are baked in?
could the stimulus package be a bust like every other stimulus package so far?
a ‘buy the rumor sell the news’ event?
maybe and maybe.
but the rumors of massive unemployment claims may not have made the same impact a real report will make.
as for stimulus, well usually a couple trillion gets the market’s attention. though in this case where it’s just throwing money into a black hole (the problem is NO DEMAND because NO ONE IS WORKING, so money for corps to “keep operating” is kind of silly if no one is buying!) maybe the market will figure it out immediately. But I doubt it. I think it gooses this market into the B wave.
ps: for stock traders, COUP has been strong, retrace big today, has now tagged and turned on a 61.8%. Could go up $4 quick like here.
so much divergence over the past 3 days… it was foretelling this bounce….actually no Verne lol we dont all know what to do- go long TVIX?
short the SPX…
Got one of those. Fortunately mid-May expiry!! Well under water at the moment. Looking for 2000 for that one…
Sold put spreads in SPY and IWM for Friday expiry. Betting the market can hold up through then. I don’t like counter trend trading, but I like to make some coin every week too…
Weekly jobless claims report due Thursday morning (8:30 am eastern time) has potential to slam this market back down.
AND NOTE: while the VIX gapped down consistent with the market gapping up, VIX has been climbing STRONGLY since even as the market moves up. Strong divergence…dum de dum dum.
Rodney – have not heard from you in the past couple of days .
Are you buying into this rally?
I have been watching and reading all the posts. But I really have not had much to post myself. Everything is okay in my world and I have been very busy in the face of this crisis communicating encouragement and support to people in my world.
I am not buying into this rally. I have two primary reasons for this: 1) The expected Primary B wave has not yet been proven conclusively to have arrived. It must break above the black channel line which Lara adjusted this morning. 2) B waves are notoriously difficult to trade because they can take on 20+ different patterns. In addition, they often morph into different patterns. For example, expected triangles often end up being a combination of some sort. Thus, one of my mantras is “I hate B waves!”
That being said, the expected Primary B wave may move all the way to SPX 2900+ as per Lara’s early morning update printed below. (Thank you Lara.) Since it is a high degree with much potential, I may take partial longs at some point.
So the bottom line for me is that the larger trend is still down until proven otherwise. The trend remains the same until that black channel line is broken. I am fully in cash and waiting patiently for my entry point which will be a scaling in process. The impulse I must avoid is “Greed or Fear of Missing Out”. The biggest trading mistakes I have made is being too early. Once the bottom of Cycle II is in, we will have a long way to go up in Cycle III.
Hope this helps a bit.
Thanks, Rodney. So if we know we are in for wave C eventually, why would you buy now? In case, we never have wave C and count is wrong? Why not wait for wave C to end as it would be way below current prices?
Exactly, for me. I am not a day trader.
Thank you Rodney.
I appreciate your comments and thoughts – always delivered in a language that is easy to understand.
I went in too early – last week, lost some. – but have decided to scale back in today, with about 20%.
Let’s see what the next couple of days will bring.
Thanks again.
As for “news doesn’t affect the market”, watch what happens when they announce agreement on a $2 trillion spending bill…
BOOM!!! Instant 2-3% rally? Maybe.
Is that tonight kev. I agree with you tho. Can only throw so much at it. Throwing cash at the problem isn’t going to fix next quarters earnings
Schumer is saying “we are close”, and the pressure is on to get it done “today”. But Pelosi may not be bought in, and so far today I don’t see anything about the resolution of the private slush fund that enables incredible corruption (“sure, but…what have you done for us recently???”), as well as $ to seriously undeserving corporations (my opinion, others may disagree).
I’ve got a stop buy above market in FAS, to try to catch what could be an instant high power move that comes finishes in 5 minutes!
https://www.cnbc.com/2020/03/24/pelosi-says-there-is-real-optimism-congress-can-reach-a-stimulus-deal-in-the-next-few-hours.html
I just saw this
Priced in…”Buy the rumor, sell…” you know… 🙂
New hourly chart:
While we still haven’t made a new short term swing high, it’s possible that primary A is incomplete
There are so many different ways to label this downwards movement now.
The channel is very important. To reduce risk, wait for a channel breach before expecting primary B has arrived.
Alternate hourly chart:
So may different ways to label downwards movement. It’s possible primary A could be complete.
Wait for the channel breach.
Couldn’t agree more; this thing can be modeled 20 different ways!
I’m focusing on two key levels. First, breaking the bullish symmetry (form a “largest” kickback rally seen in the entire move down from 3/4 (after the initial “b wave”; I’ll consider the b wave size later if/when appropriate, first things first). I’ve shown the projection of that move and the level, around 2424. The second is of course the pivot high at 2467.
The tight steeper channel is broken completely; I’ve removed it. The bigger channel upper line is quite far away, and afaiac not really in play at this time (may come in play later of course).
So for me…2424, then 2467.
Also note the very significant pile of Fibo structure lines price is just entering at 2404-2410. Could turn it, but probably just a consolidation at/under then up and through.
Hi Lara,
2,378.08 was the invalidation before the open. Now you are increasing the invalidation to 2,466.97. Is it because you want to be careful? Or? Thanks.
Ps. Your Analysis saved my 401k thank you!
The invalidation was of a continuing primary A wave down model. This new model has primary A complete, and primary B up launching. So now the invalidation would be a sudden reversal breaking the recent lows, with a primary B that is far too small.
Thanks Kevin.
“Ps. Your Analysis saved my 401k thank you!”
OMG I am so pleased to hear that!!
I am moving the invalidation point up, because the first invalidation point was breached shortly after the open today. So… the count published in this analysis was invalidated.
I should have published alternates yesterday. I’m kicking myself for not doing that.
Bottom line though is the channel. It needs to be breached for confidence.
Or maybe the B is shallow and the channel ends it?
Shallow, lol!!! That would be roughly 2200 up to 2700. A mere 22% rise!!!
Amazing coverage Lara for adding updates early and a couple of possibilities. I’m always impressed and glad to have joined years ago. The group too is a wonderful addition. Everyone be well, trade safe and enjoy the moves.
Don’t ever kick yourself… you might sprain your other leg!
🙂
Today’s ramp sporting classic “C” wave characteristics… 🙂
are you referring to the second alternate? headed to new highs now?
hard to follow as everyone is flip flopping from super bearish to super bullish now?
He talking about this being a correction (not impulse) upward, which on an hourly from the overall low has a small A up, B down, and now this C up. I believe. The chart I just posted clearly shows that action, with the A-B sequence forming a solid double bottom structure.
Ho-hum, just another 7% day…UN-BE-LIEV-ABLE!!! The new normal.
Thanks Kevin. Added a bit more below…
I am talking about the wave up today. Lara’s analysis should serve as a road-map, but there is no substitute for observing price action and drawing conclusions based on what actually occurs.
Main invalidated. High now of 2387
Buying is primarily momentum crowd driven so suspect. Also, look at the leaders in TECH space for split buying. GOLD up another $103 today so far. I just hope for better entry point for new short positions before the next leg of the drop.
Rishi, do you refer to GOLD or equity in general to short?
not GOLD but equities…AAPL and MSFT as an example. But only once clear signs of wave B being done.
‘endless quantitative easing’ smh lol
awesome for gold!
That’s what I was thinking – looks like long term gold becomes “gold”:) Good long term investment.
Took my gold put spread established early yesterday…at 1/2 profit after 1 day on a 30 day spread? Oh yea. Pigs get slaughtered (I know!).
I’ll believe Lara’s gold count until proven otherwise. She has this movement up in both her bull and bear counts as a counter move that shouldn’t reach new highs (a B wave in one, I forget on the other, but it’s the expectation is the same). So perhaps use some care re: getting too exuberant on the long side.
Thanks, Kevin. So we should be seeing new low in gold first before going to the sky? Is that what the count says? I just don’t have an access to it. Thank you.
Well it’s proprietary so it’s not really for me to share. No current “bull count”. This move up a 2 or a B, then down down down. And if the economy goes into recession I think that’s rational: no one is buying gold, and the industrial demand for gold plummets too.
Lara’s Weekly is a valuable product, my $0.02.
It’s the right time o the year to be a gambling man……
Well played sir! And gutsy.
So I noticed the S&P futures hit your price target to 2173 last night but not in the cash market. Does this affect your analysis in any way?
no, solely based on cash market. two separate markets. why are futures so ramped up tonite?
covid spending bill
looks like the main was invalidated after hours this evening?
no, count is only based on cash market
Ok , thanks.
so looks like we will limit up overnight?
no real guidance for that situation- anyone working a game plan or chart?
I rather like the bottom structure in GOOGL for some kind of a short term long trade. Turn off the 2019 low, higher swing low on the hourly. Might run up nicely tomorrow or when the corporate taxpayer $ cash giveaway program gets passed.
The inability of SPX to solidly break below the 2300 Fibonacci structural level is to be a building indicator that the B wave base is forming here. Could be wrong!
CTXS has great pivot low structure and a clean “neckline” which if broken to the upside might be an excellent buy trigger.
On the short side, BLUE looks ready to tumble again.
If you are of a gambling nature, and think a B wave should be launching here…FAS might be a very profitable play. But it’s one of those hugely leveraged funds that degrades price continuously, be forewarned!
I dont want to believe in a B wave- airlines are outlining a domestic air travel shutdown… definitely not taking any single stock risk here unless its ZM or APRN lol I just get edgy when theres no alternate and invalidation is so close! it’s like a magnet for a news headline and head fake
New case count back to it’s exponential growth pattern today; yesterday’s slight blip down appears to be an anomaly. Now at about 30,000 new cases a day. A week ago it was 15,000 new cases a day. And the shape of the curve suggests in another 7 days will be up to 70,000+ new cases a day.
Not close to controlled yet.
I’m watching impact on GDP estimates. It’s reminds me SO MUCH of how software R&D project schedules are typically produced. “What’s the date???” marketing wants to know!! So what does Mr. Brilliant SW R&D manager produce? The EARLIEST date that he can’t prove to himself he CAN’T MAKE IT. Because even with that he’s going to face FIRE for “taking so long”. The little drama is the absolute norm in all projects with high uncertainty.
Well, now we see it in the GDP #’s. Everything’s going to SUDDENLY BE BETTER AGAIN by Q3 and Q4!!! Because you can’t yet definitely prove it won’t be true!! So there won’t be any depression!! Just a quick here and gone recession.
Yea, right.
Third again 🙁
UK Lockdown 2nd
Late to the party. Lockdown here now day 9, and curfew extended from 5pm to 5am.
But then it’s not a competition. And if it were, it’s a really awful one.
Oddly enough, my sister is now under “lockdown”…at a resort on Lake Wakatipu in New Zealand! Was on a roving one month vacation, now not so roving anymore. So far the flight back is still on for the end of the month but…she might be there for the longer haul!
Nice choice of location!
Booya!