A small upwards day completes a spinning top candlestick. This session falls short of an 80% up day, so the main Elliott wave count remains most likely.
Summary: It may be safest to assume the downwards trend remains intact while price remains below 2,553.93. The short-term target remains at 2,173.
However, yesterday completed a Hammer reversal pattern that comes while RSI exhibits triple bullish divergence, On Balance Volume has not confirmed new lows, and ADX is now very extreme. Conditions are now set for a strong bounce. Be aware this market is vulnerable to large whipsaws.
A new high above 2,553.93 would provide some confidence that a multi-day to multi-week bounce may have arrived for primary wave B.
The final target is now at 1,708.
The biggest picture, Grand Super Cycle analysis, is here.
Last monthly charts are here with video here.
ELLIOTT WAVE COUNTS
MAIN WAVE COUNT
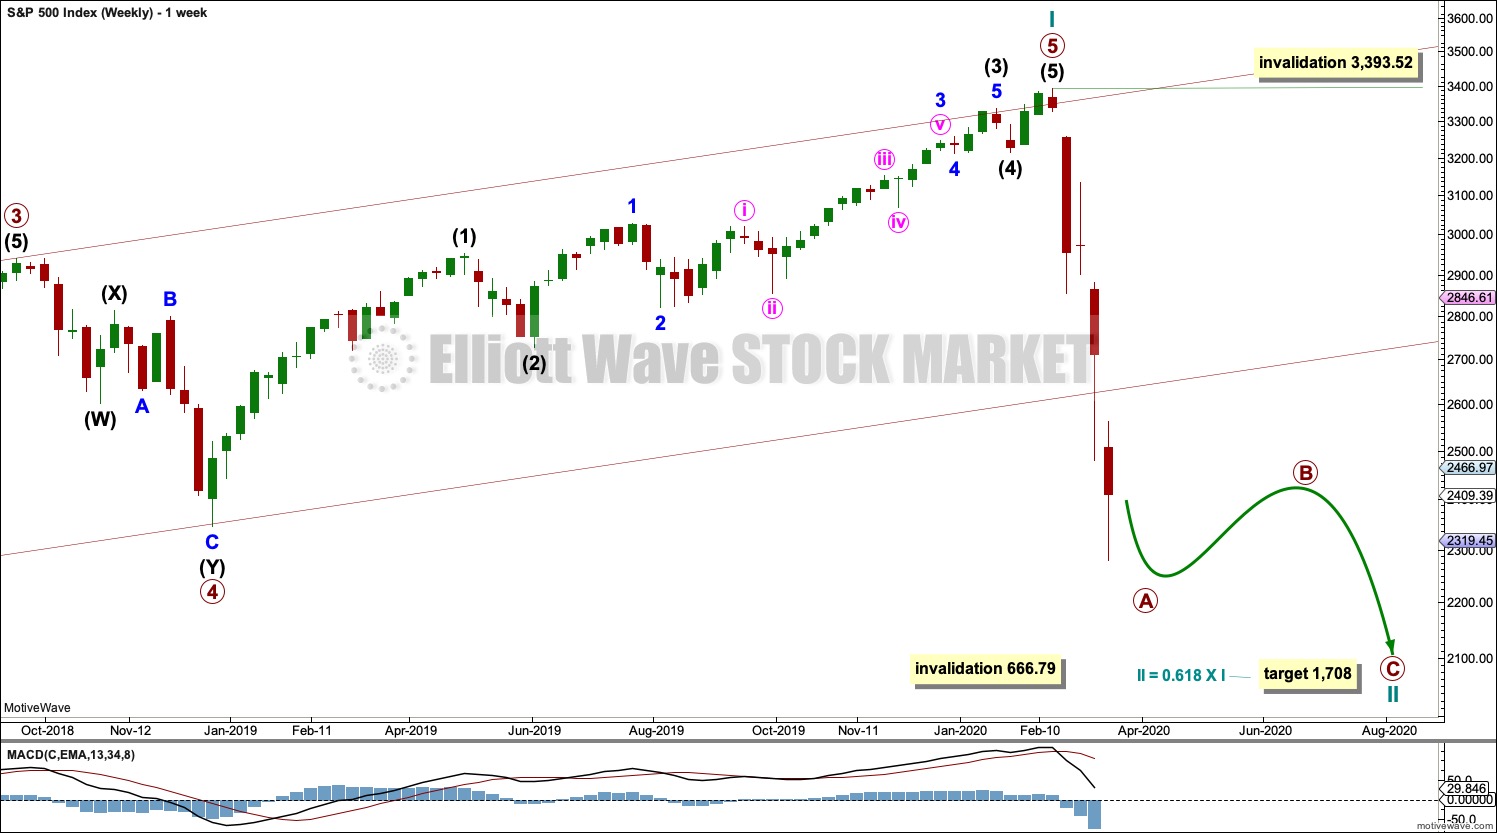
WEEKLY CHART
Now that the channel is breached by a full daily candlestick below and not touching the lower edge, further confidence in this wave count may be had.
Price is now below the 0.382 Fibonacci ratio of cycle wave I at 2,352. The structure of cycle wave II may need further to go to complete. The next Fibonacci ratio at 0.618 is now a preferred target for cycle wave II to end.
It is possible now that cycle wave II could be complete. This is outlined in a second alternate hourly chart below; in analysis of that chart I have outlined what needs to be seen for confidence in the alternate wave count.
Cycle wave II may not move beyond the start of cycle wave I below 666.79.
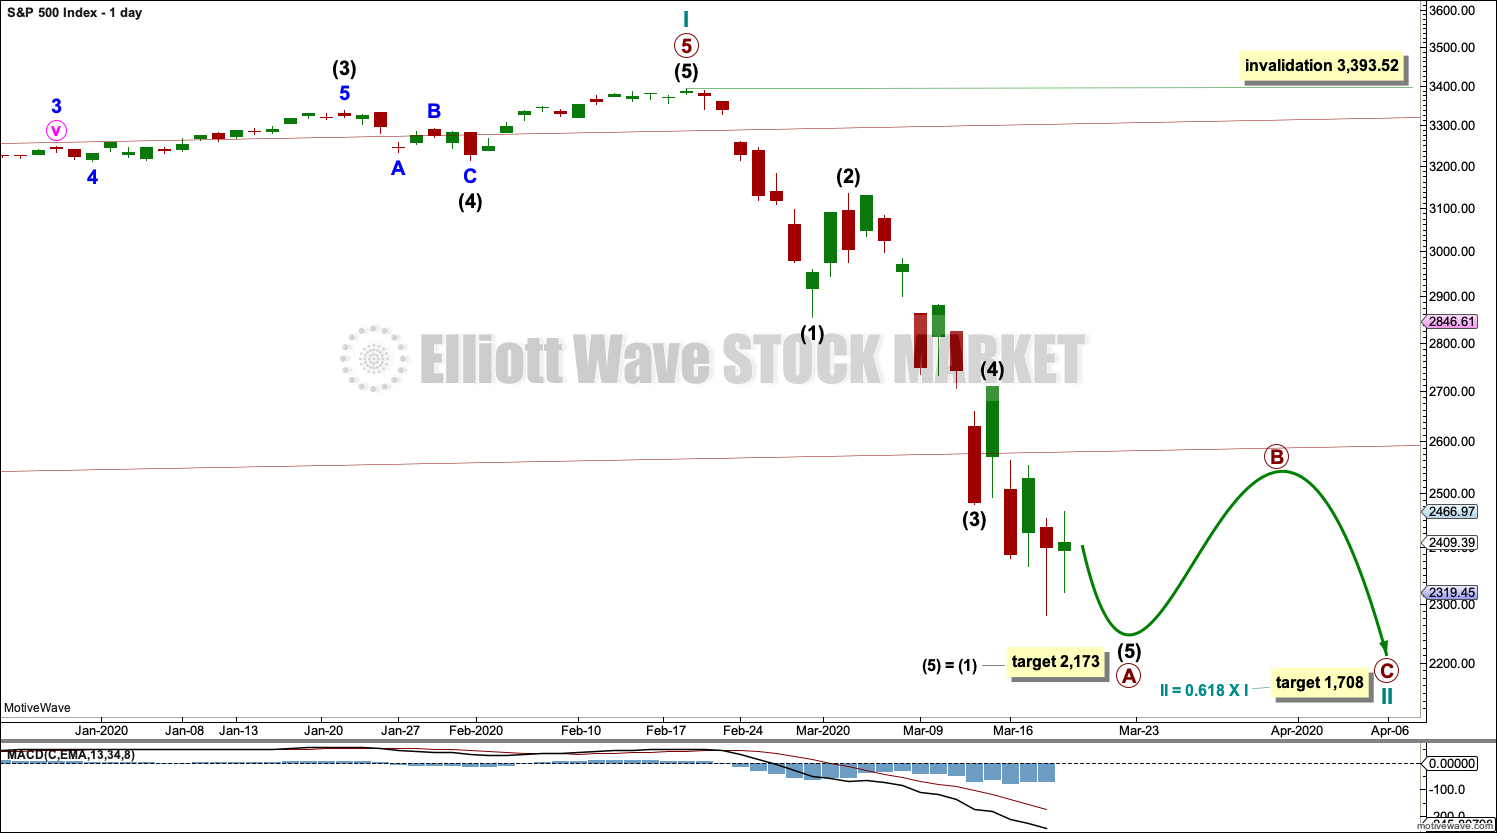
DAILY CHART
Redraw the wide maroon trend channel carefully: draw the first trend line from the end of primary wave 1 at 2,093.55 (December 26, 2014), to the end of primary wave 3 at 2,940.91 (September 21, 2018), then place a parallel copy on the end of primary wave 2 at 1,810.10 (February 11, 2016). The channel is fully breached indicating a trend change from the multi-year bull trend to a new bear trend.
Cycle wave II may subdivide as any Elliott wave corrective structure except a triangle. It would most likely be a zigzag. Primary wave A may be an incomplete five wave impulse. Primary wave B may not move beyond the start of primary wave A above 3,393.52.
Within primary wave A, there is no Fibonacci ratio between intermediate waves (1) and (3). This makes it more likely that intermediate wave (5) may exhibit a Fibonacci ratio to either of intermediate waves (1) or (3). The most common Fibonacci ratio for a fifth wave is equality in length with its counterpart first wave.
MAIN HOURLY CHART
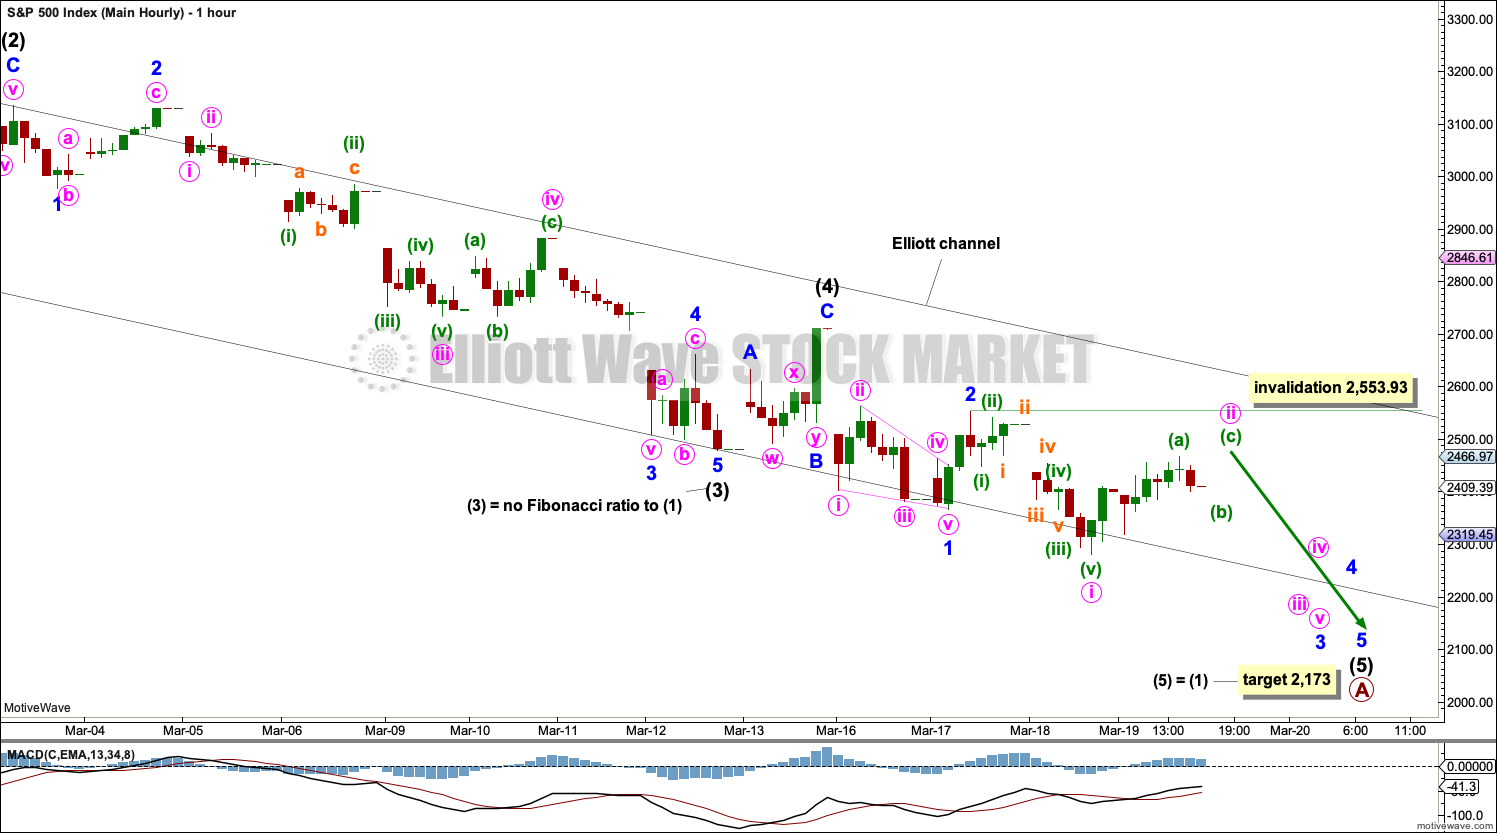
This remains the main wave count today because it is always safest to assume the trend remains the same until proven otherwise. The trend now is down, so assume it may continue down until this wave count is invalidated.
Primary wave A may be an incomplete five wave impulse.
Draw a channel about primary wave A using Elliott’s first technique: draw the first trend line from the ends of intermediate waves (1) to (3), then place a parallel copy on the end of intermediate wave (2).
During bear moves, this market sometimes behaves like commodities. It may exhibit swift strong fifth waves. Look for the possibility for intermediate wave (5) to end with further strength.
Intermediate wave (5) must subdivide as a five wave motive structure, either an impulse or an ending diagonal. An impulse is most likely. That is what shall be expected until and unless overlapping indicates a diagonal.
Within intermediate wave (5), minor waves 1 and 2 may be complete. Minor wave 3 may have begun and may only subdivide as an impulse. Within minor wave 2, minute wave ii may not move beyond the start of minute wave i above 2,553.93.
FIRST ALTERNATE HOURLY CHART
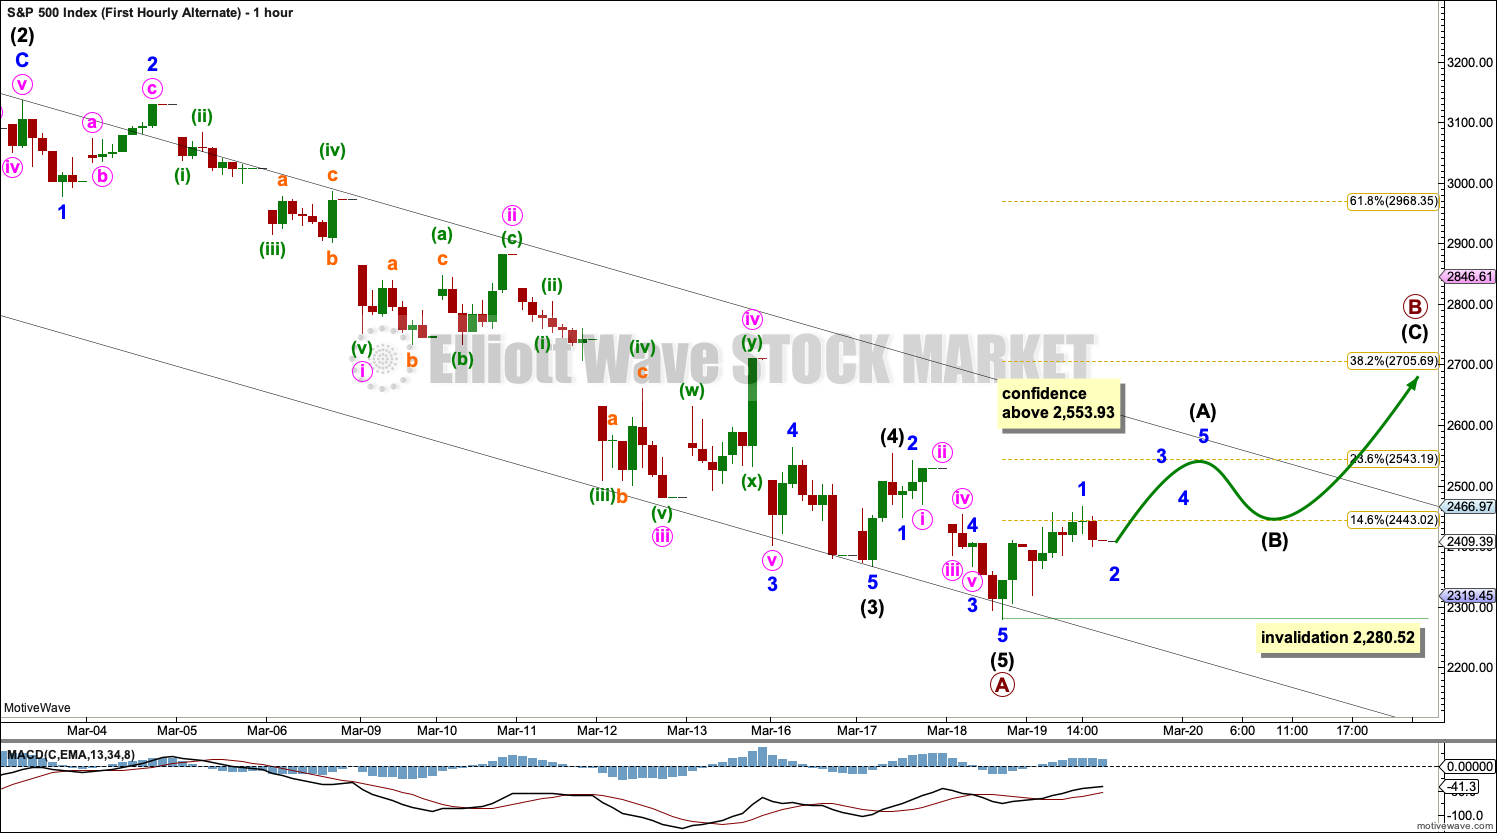
It is possible that primary wave A may be over. There is some support for this first alternate wave count from classic technical analysis.
Primary wave B may subdivide as any Elliott wave corrective structure. It may be a quick sharp bounce as a zigzag, or it may be a more time consuming sideways consolidation as a flat, combination or triangle.
A new wave at primary degree should begin with a five wave structure upwards on the hourly chart. Within that first five up, no second wave correction may move beyond its start below 2,280.52.
SECOND ALTERNATE HOURLY CHART
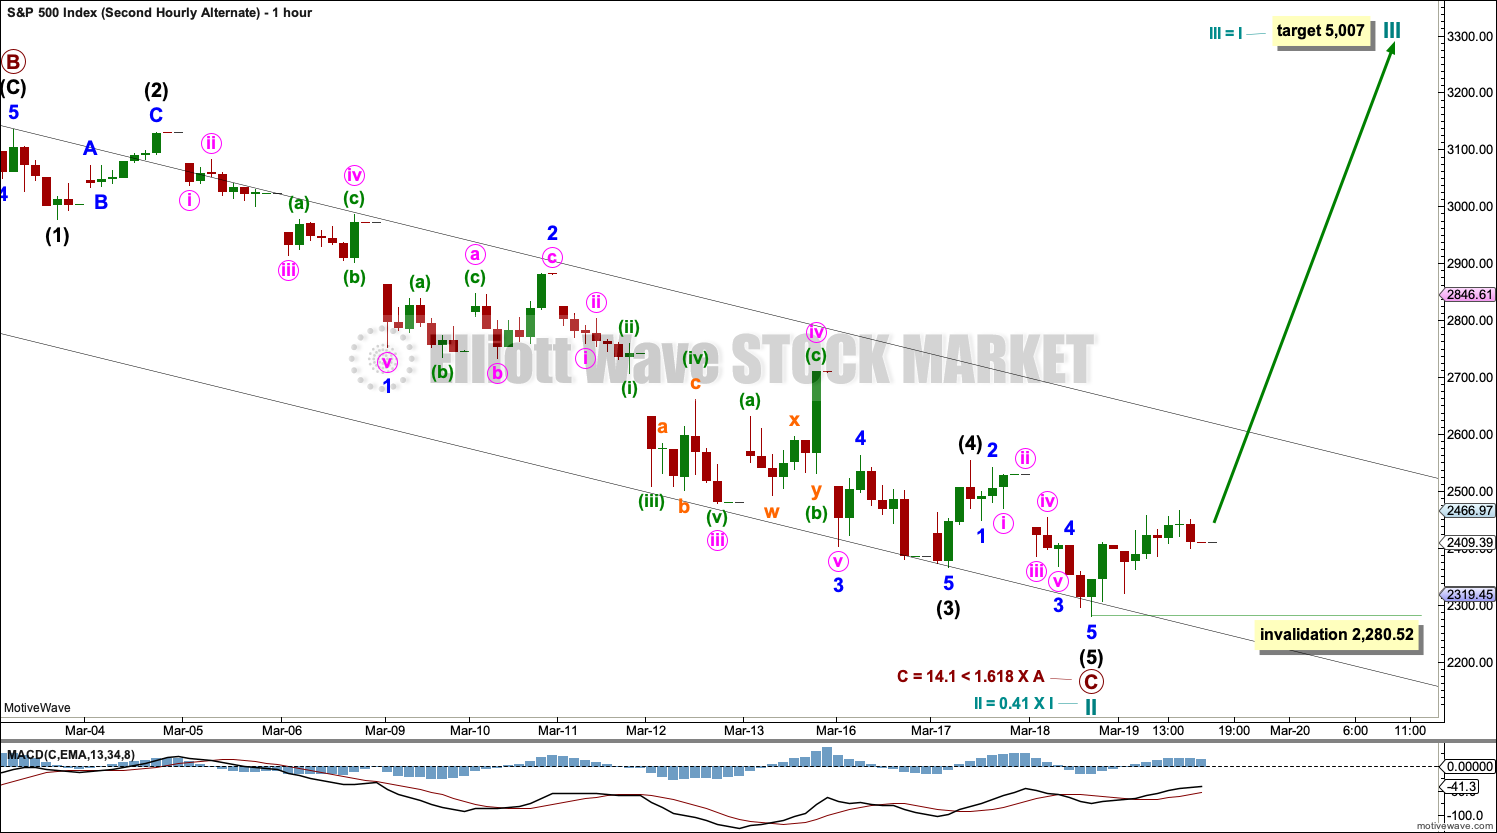
It is possible that cycle wave II may be a complete quick relatively shallow zigzag at 0.41 of cycle wave I. Coming after zero divergence between price and market breadth at the all time high, statistically a shallow bear market would be most likely.
This wave count absolutely requires some confidence from classic technical analysis before it may be considered seriously. It is published today to consider all possibilities.
This wave count may require one or more of the following conditions to be met for confidence in it:
– A 90% up day or two back to back 80% up days within three sessions from today.
– A 6 point rise in Lowry’s short-term index.
– A new high by the AD line.
– A new high above 3,393.52.
– A bullish candlestick reversal pattern with support from volume at the daily, weekly or monthly chart level.
TECHNICAL ANALYSIS
WEEKLY CHART
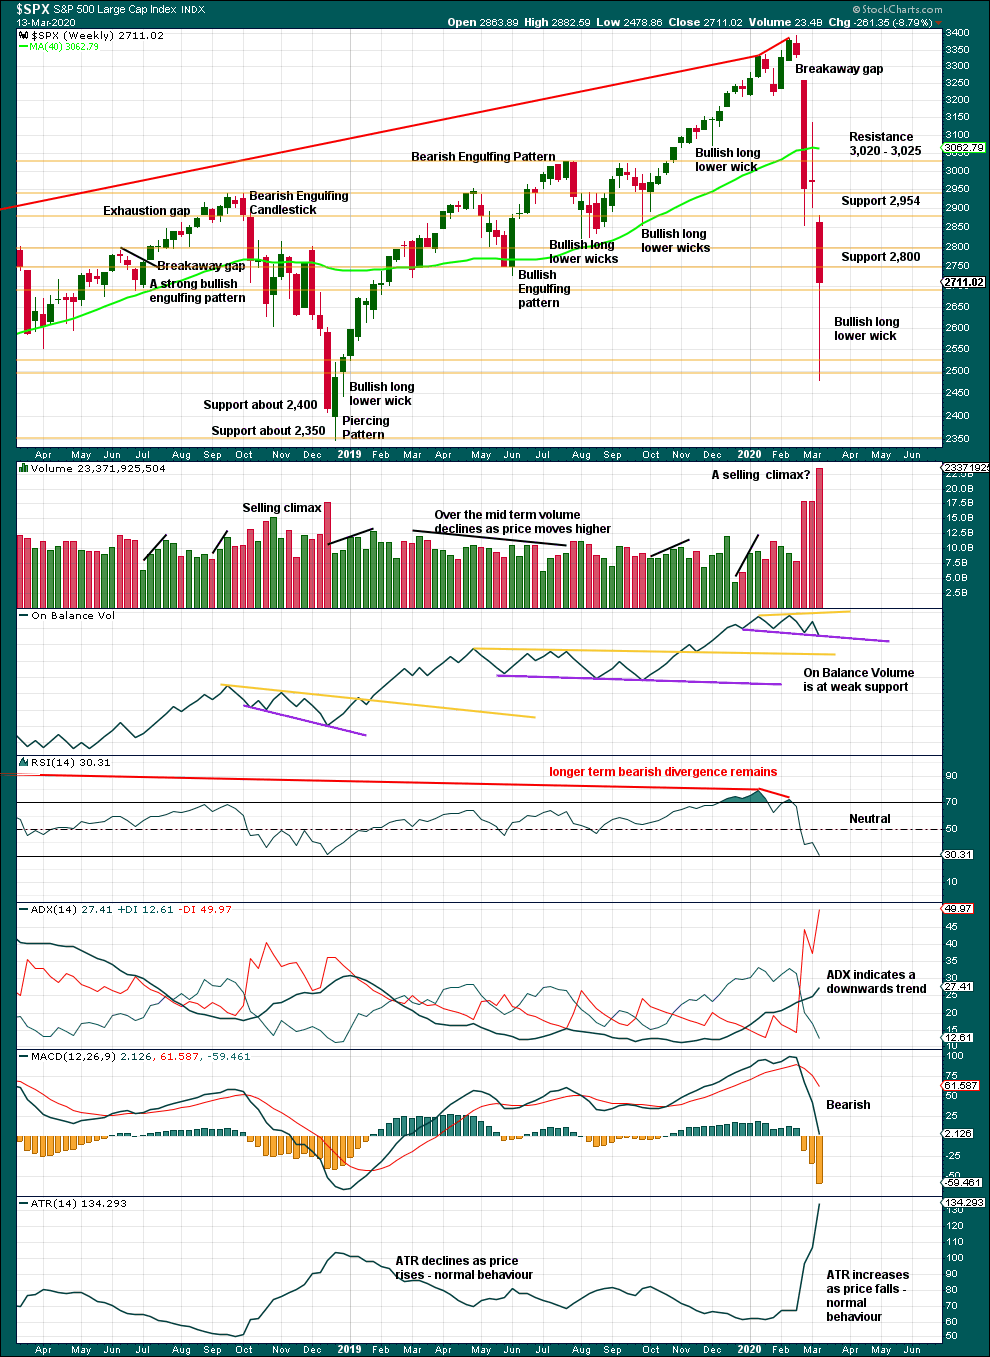
Click chart to enlarge. Chart courtesy of StockCharts.com.
A 32.8% drop in price (high to low) no longer has precedent within the larger bull market.
At the weekly chart level, conditions are not yet oversold; there is room for downwards movement to continue.
DAILY CHART
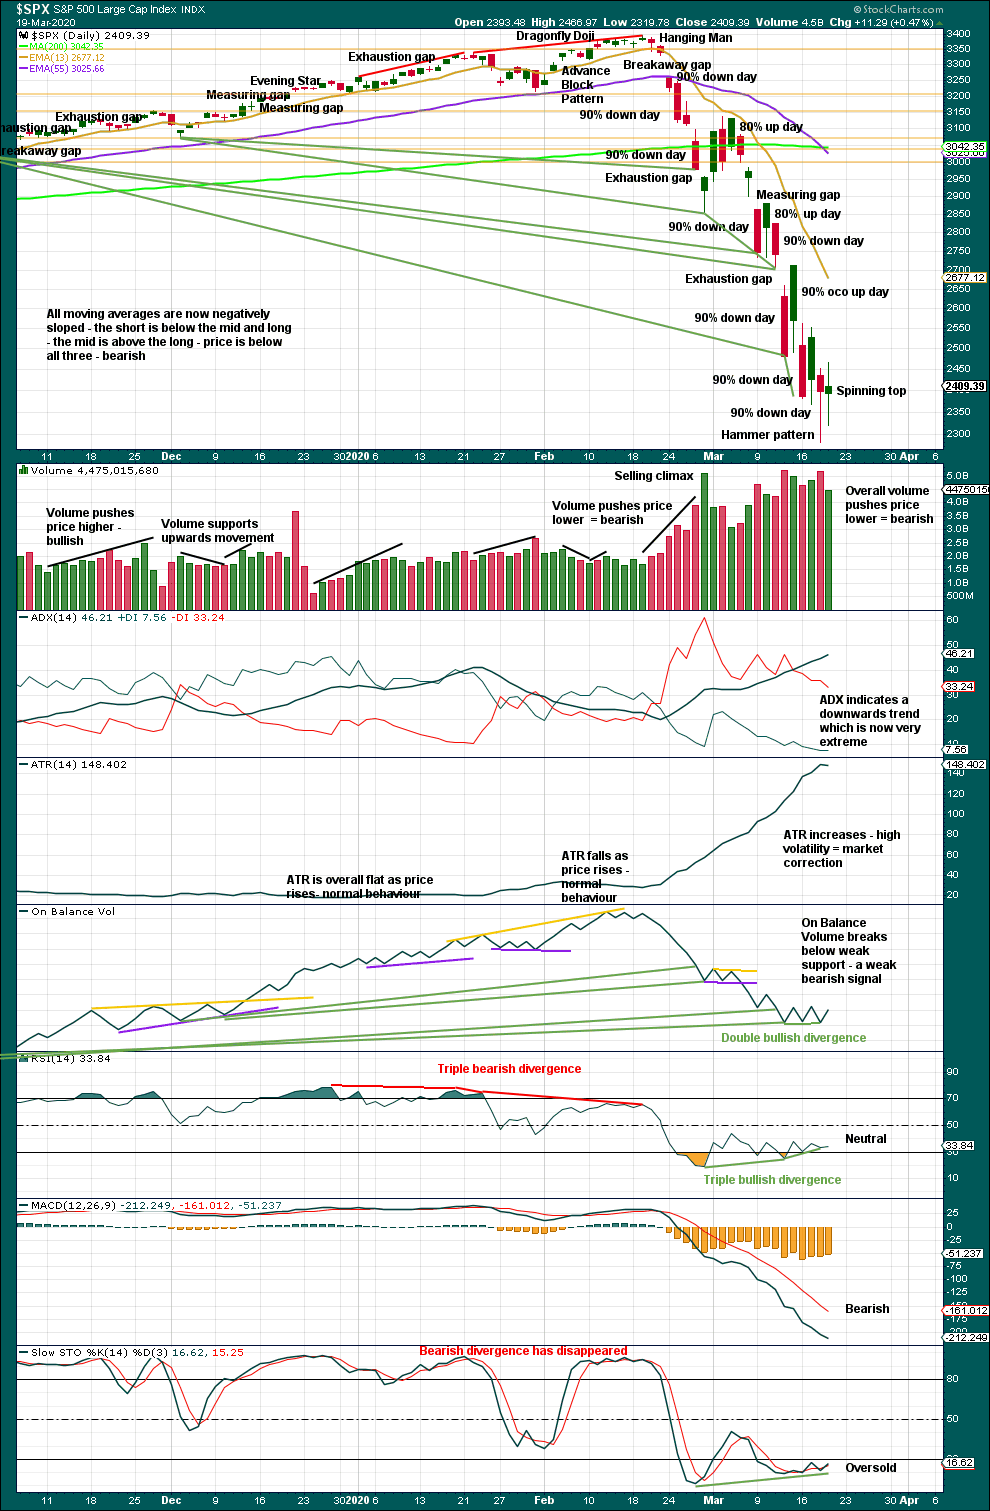
Click chart to enlarge. Chart courtesy of StockCharts.com.
There are now eight 90% downwards days in this strong downwards movement.
The following indicators still suggest a low may be in place soon:
– RSI reached deeply oversold and now exhibits short-term triple bullish divergence with price.
– Stochastics reached oversold and now exhibits short-term bullish divergence with price.
– On Balance Volume continues to exhibit double bullish divergence with price. On Balance Volume has failed to confirm the last three days’ lows.
If price bounces here, then it would most likely be a correction within an ongoing bear market and not necessarily the end of the bear market.
Today a spinning top represents indecision, a balance of bulls and bears. The bulls dominated but not decisively. This session fell short of an 80% up day. At this stage, there is not any evidence of a sustainable low in place.
BREADTH – AD LINE
WEEKLY CHART
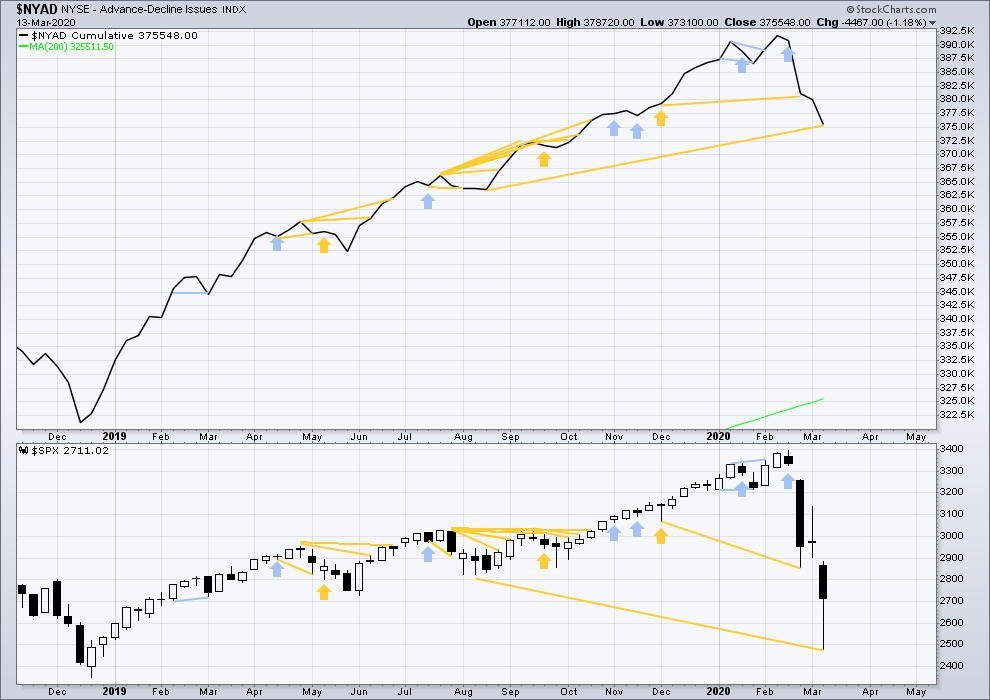
Click chart to enlarge. Chart courtesy of StockCharts.com. So that colour blind members are included, bearish signals
will be noted with blue and bullish signals with yellow.
Bear markets from the Great Depression and onwards have been preceded by an average minimum of 4 months divergence between price and the AD line with only two exceptions in 1946 and 1976. With no divergence between the AD line and price at the last all time high, this current bear market now makes a third exception.
In all bear markets in the last 90 years there is some positive correlation (0.6022) between the length of bearish divergence and the depth of the following bear market. No to little divergence is correlated with more shallow bear markets. Longer divergence is correlated with deeper bear markets.
This bear market comes after no bearish divergence. It would more likely be shallow, but this is a statement of probability and not certainty. So far it is slightly more than the 0.382 Fibonacci ratio of the bull market it is correcting (beginning March 2009).
Last week price made new lows below prior lows of August 2019, but the AD line has not. This fall in price does not have support from a corresponding decline in market breadth. This divergence is bullish and supports the view that this bear market may more likely be shallow.
Large caps all time high: 3,393.52 on 19th February 2020.
Mid caps all time high: 2,109.43 on 20th February 2020.
Small caps all time high: 1,100.58 on 27th August 2018.
DAILY CHART
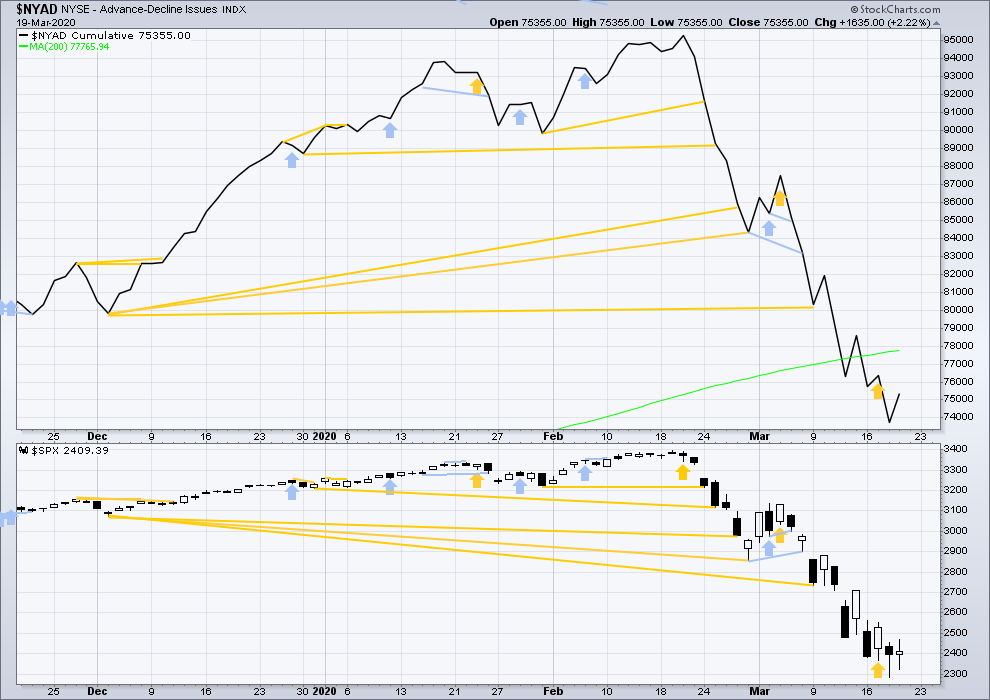
Click chart to enlarge. Chart courtesy of StockCharts.com. So that colour blind members are included, bearish signals
will be noted with blue and bullish signals with yellow.
Breadth should be read as a leading indicator.
Today both price and breadth have moved higher. There is no new short-term divergence, but mid-term bullish divergence remains (seen at the weekly chart level).
VOLATILITY – INVERTED VIX CHART
WEEKLY CHART
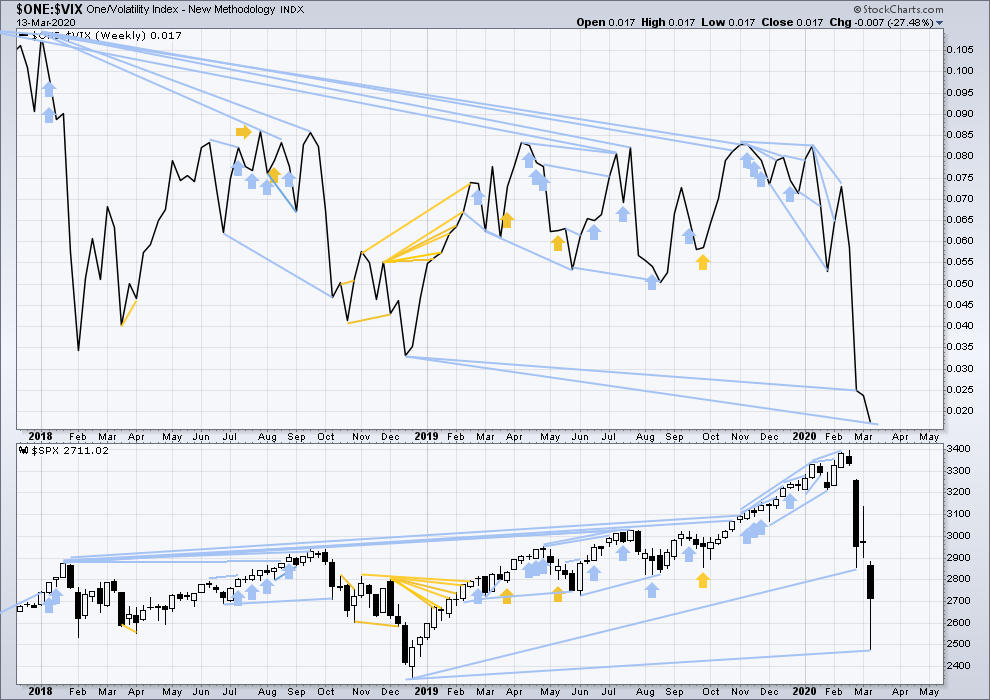
Click chart to enlarge. Chart courtesy of StockCharts.com. So that colour blind members are included, bearish signals
will be noted with blue and bullish signals with yellow.
The all time high for inverted VIX was on 30th October 2017. There is now over two years of bearish divergence between price and inverted VIX.
The rise in price is not coming with a normal corresponding decline in VIX; VIX remains elevated. This long-term divergence is bearish. It may now be resolved by this last fall in price, which meets the technical definition of a bear market.
Last week inverted VIX has made new lows below the prior major swing low of December 2018, but price has not. This divergence is bearish and suggests this bear market may not be complete.
DAILY CHART
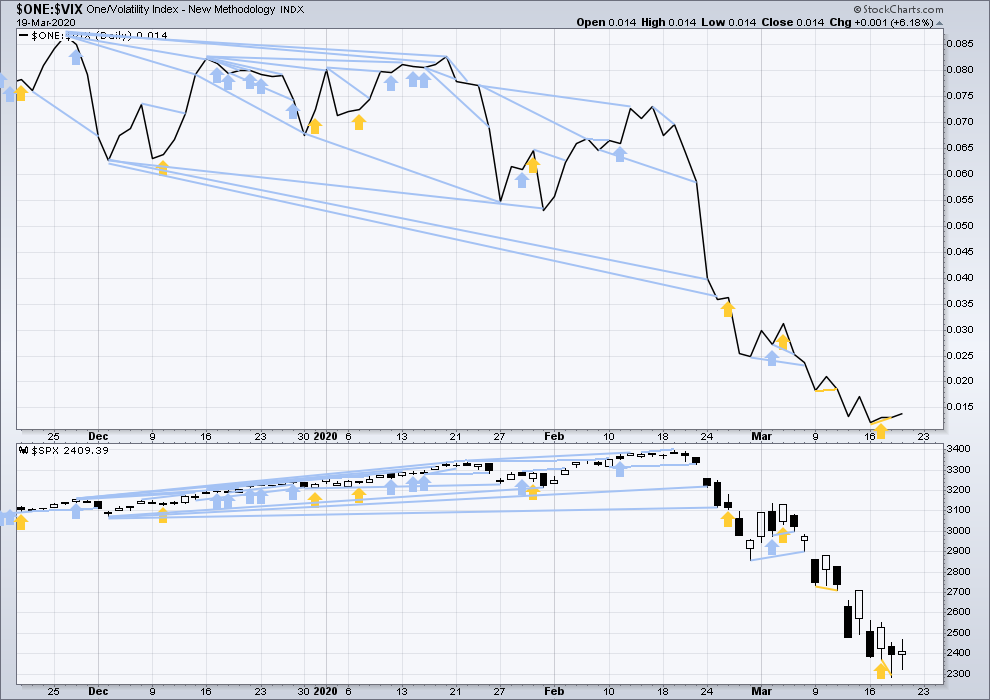
Click chart to enlarge. Chart courtesy of StockCharts.com. So that colour blind members are included, bearish signals
will be noted with blue and bullish signals with yellow.
Today both price and inverted VIX have moved higher. There is no new short-term divergence.
DOW THEORY
Dow Theory has confirmed a bear market with the following lows made on a closing basis:
DJIA: 21,712.53 – a close below this point has been made on the March 12, 2020.
DJT: 8,636.79 – a close below this point has been made on March 9, 2020.
Adding in the S&P and Nasdaq for an extended Dow Theory, a bear market has not been confirmed:
S&P500: 2,346.58 – while this point has been breached intra day, price has not yet closed below it.
Nasdaq: 7,292.22 – a close below this point was made on the March 12, 2020.
Published @ 06:35 p.m. EST.
—
Careful risk management protects your trading account(s).
Follow my two Golden Rules:
1. Always trade with stops.
2. Risk only 1-5% of equity on any one trade.
—
New updates to this analysis are in bold.

they are issuing driving permits to essential workers here and across from my girl friends office at long beach harbor she has seen national guard units massing.
I expect the quarantine to tighten up here in CA and to lose driving privilege’s soon.
I use Lara’s EW same way Kevin does. And interestingly, when her channels or formations get invalidated (not price level) I take the opposite side of it and it works perfectly. Lara is very important to me
I second this notion …
Question to all/anybody …….. how do markets overlap? Looks like Transports entered a bear market long ago, any may end soon….
Also, SPY started trading in 1992. Three of the five largest gap downs have come in the past week ….. yikes. From Ciovacco Capital yesterday …. a great video, lots of education.
I’ve analysed 3 of the 4 markets I need to today, and I’m too tired to do the S&P justice tonight. I’ll do it in the morning when I’m rested.
Just FYI if you’re all waiting on me.
Hey Verne,, check out the zerohedge article about Ronin Capital,, a reason for the weird vix today.
Thx Doc! Will do.
Headline on zerohedge “Second Great Depression Begins? Goldman Now Expects A Record 24% Crash In Q2 GDP; Sees 9% Unemployment”
Could be a buy signal
Updated hourly chart
Updated first alternate, which is TBH the one I think may be more likely
but
assume the trend remains the same, until proven otherwise
Thanks Lara. Have a great weekend.
Thanks Rodney 🙂
As of now, all waves counts from yesterday are still possible… One is correct…
I politely disagree. None are “correct”. Just as a road map with a line showing a potential path of a car isn’t “correct”. It merely shows what the car MAY DO, at some level of probability.
“Correct” implies the future is pre-ordained. It’s not.
The future will probably play out in one of these models. But even that is not certain, because truly ANYTHING can happen, and there are other valid models (you can develop and show ’em all!).
There are times the main is very high probability. There are times when it is just one of many possibilities. I believe this is one of the latter times.
I believe this notion of EW models being “predictive” of a pre-determined future greatly misleads traders first trying to use EW.
I totally agree with your comment
A critical point. I am not going to say to much so my head does not explode but there are a lot of dishonest people who present EWT as being “predictive” and fool a lot of gullible would-be traders into buying their B.S. It is really amazing to watch these fraudsters make one bone-headed call after another…(you are guaranteed to make money doing the exact opposite of what they say )…yet gas-light readers who can clearly see how ridiculously wrong they have been, with clap-trap about being able to “predict” the market.
A quick word of advise for new traders.
If you are worried about what the market is going to do, or dismayed by what it does, your approach may need some tweaking.
The first and most common mistake is incorrect position sizing so that when the market moves against you it results in a devastating loss. LIMIT RISK!!
The other thing that astonishes me about traders is their lack of discipline in establishing what the TREND is, AND maintaining discipline and recognizing COUNTER-TREND market moves and trading accordingly.
Finally, YOU MUST develop you own trading methodology, based on techniques that you have found which work for you, and that you are comfortable with. Learning involves trading losses…no way around that.
Somebody talked about traders gloating on the site and frankly I found that a bit offensive. We post our entries. We post what we pay. We post what we sell for. It does not get any more real than that. I have no time for talkers so I understand the sentiment, but to the best of my knowledge the members of this site are brutally honest…about wins and losses.
O.K I have said my piece and am done.
What Verne said.
Thank you Verne.
🙂
Please do forgive my mis-spellings…was a bit hurried…
I’ve had a flushed face every night for over a week…but never a fever. Until last night, about +1 to +1.5 degree. Gone in the morning, no other symptoms.
Hope it’s “just the flu”…
hot flashes
well damn…it’s about time!!
Kevin, I hope so too. I wish the best for you and your family…you will be in my prayers.
Keep well Kevin. If we get it, statistically it’s most likely to be “relatively” mild and we’ll recover. Most of us.
It’s still a horrible illness though.
Looks like traders are confident we get a significant low on Monday. I hope, for their sakes, that they are correct. This gutsy short vol trade is one of the most brazen I have ever seen!
Have a great week-end everyone!
Shelter in place if you can. The next two weeks are going to determine how we fare with this pandemic.
social media showing a tone here… people are moving from warnings, to jokes, now to what ‘life will be like when its over’. showing just how short the attention span if society is. after two months of police in the streets in wuhan new cases have platued. however today is the first day I’ve sensed quiet in the streets here in northern cal. I’m picturing a tone of dread when people realize it’s going to be another 30 days of this…
We will all be tested, and I don’t think it would be only 30 days. People still under-appreciate the negative potential of this virus. And don’t forget about second wave – I hope you don’t think that if China reports no new cases, it is over? Remember Toronto 2nd wave in SARS times? Supply shock is turning into demand shock and consumer confidence wont get back until the drug is developed and becomes commercially available. For that whole process to take at least 9-12 months in the best case scenario. Obviously, market can start rising before that in anticipation, but somehow no one talks about Q3 and Q4 being negative growth quarters. For some reason they are so positive and we are all back in business in Q3. That’s what current market price predicts. But do we really know that for the fact? I wouldn’t rush with such a conclusion yet.
totally on board with that. like I said people think they’ve only got 9 more days of this according to social media. police are already prosecuting shop owners trying to reopen in wuhan. there will be a second wave.
Absolutely a second wave! I don’t believe the worst has hit. How can billions of impoverished people in countries like China, India, etc be expected to stay home when there isn’t any food other than what they gather that day, let alone for weeks at a time? If the rate of infection is 2.5 for every 1 infected, we have a long way to go.
I think most pandemics take 1-2 years to work though a population 🙁
But they way the governments have reacted to this is very serious. It’s unheard of. I think it could be gone sooner, special cases.
30 days?
That would shock me. I would guess 60 minimum, and 90-120 quite possible. Based on the infection rate data. Maybe it’ll change…
Minimum 3 months period
guys… 30 days at minimum. I’m the one with the friend in tianjin china reporting directly how bad it was 3-4 weeks ago. my cupboards are full. I’ll be bugging out to a more remote local soon. although del taco does have $bynd meat tacos for sale in the drive through right now lol
In all my years of trading I have never seen such extreme divergence with VIX and market price. It is either extremely bearish, or extremely bullish…not sure which at this point.
It’s because you have never seen such an unprecedented level of leverage in the system in general with Fed’s QE and money pumping. Nothing is free in this world – everything is connected. It had to happen one day – coronavirus was just a catalyst. It could have been any smaller shock to this unstable system.
I agree…
Traders clearly have made what they consider to be a one-way bet on market direction. If VIX is any gauge, they are absolutely certain the next sustained direction is up. Are they right??!! 🙂
Some of the vol dislocation was caused by the Bridgewater puts. These puts expired today, along with the hedges made by the sellers to Bridgewater.
The 30 historical volatility is currently 71, and VIX at 60-ish is still fairly elevated. SPX has to move 3.5% every single day for 30 days to break even.
Interesting!
I know today is triple-witching, but the VIX action is most unusual.
Here’s a daily SPX chart suggesting no (along with our main!). Every time a daily candle has pushed above my lower volatility band (purple), and/or tagged or scribbled on the 5 ema (red), KABOOM, fresh sell off. If the pattern continues…
I will not go into the weekend long.
Kevin, with the exception of VXX?
Thanks
You mean will I hold VXX? I don’t trade VXX, or generally the VIX (once in a great while I might buy VIX calls when it’s very depressed…you know, in perhaps a year or more? Lol!!).
Well Boris has just been on and we’ve just shut the UK!
Massive amount of money thrown at businesses (I’m an FD and even I’m shocked) – paying peoples wages, no VAT payment from businesses, etc, etc.
God know how this will flush through the system!
the major averages on hourlies have inverse head/shoulder patterns in development. “Bottom structure” in my language. And again SPX’s low fulfills excellent fibonacci structure of the A wave down to date. I think the case builds for the alternate, slowly but surely. But unlikely there will be price action confirmation today.
I don’t see any inverse H&S for SPX though
I must say I am surprised at how bullish sentiment remains intact. A very good chartist I know posted on his blog yesterday that the “bottom was in”.
The nature of this market has changed. Just as bearish signal after bearish signal and extremity of indicators did nothing to stop the relentless bull march higher, it is entirely possible that we could see similar developments on the way down. This move up, bulllish expectations notwithstanding, looks very corrective to me.
Granted VIX and vol instruments are taking quite a beating this morning, is it possible that we now have traders using the same metrics as they have in the past and piling in heavy on the short side of volatility, as opposed to the price action there being indicative of a lasting market bottom? Just thinking out loud.
For now, watching for new developments….I suspect the round numbers will again tell the tale…
The price action yet again reached the channel’s resistance, crossed it and then went straight back down. It doesn’t look like any wave B yet. We are simply consolidating on a daily basis to drop down more. Again, just IMO.
/ES has some bullish overnight action. Notice how we now have a sequence of 3 higher lows and highs, with each correction back down coming to 76-78% level of 61.8% level.
And a clear break and now retest of the upper channel line I’ve drawn here.
I’ll be getting long on an SPX break above the high of yesterday I suspect.
2456 Kevin ?
Will it reach the swing high at 2456? I dunno. Right now a turn lower than that on top of the 50%. 2456 is above the 61.8%.
I think my SPX 2392 close thesis is still in play here. But watch for a sudden break upward. There is high quality bottom structure here in SPX on the hourly. Lots of individual names showing some strength, but as I suggested, maybe big money holding the averages here for expiration maximization.
Kevin. Thankyou. I’m guessing here but there seems to be some consolidation
On ES nice cluster target of 2408.58-2410 for (ii) of [iii] to sell from, following good 5 waves down then double zig or combination heading into this cluster target.
Assuming main count is the one.
Anyone else long the $ …. ?
Short-term maybe, long-term – good luck with all the money Feds throwing, I think you would be in for a big shock eventually.
in and out with profits yesterday, suspected it might be down today, will look to reenter. John Carter argues the $ is under huge demand and is the best long trade out there. Interestingly, Cooper is dismissive of that same thesis (I ran it by him). But you can’t deny the $ trend right now. It’s up.
Would you use UUP calls? I mostly trade fx, I want to transition to options
I bought FXE puts yesterday to play it. That’s how I’ll trade it again.
But FXE bouncing off a long term 100% retrace level today. Maybe it keeps rising if we get SPX in a B wave up here. I’m not anxious about trading $/FXE right here.
All of CA to shelter in home and Governor requests naval hospital ship to dock in LA ….. stay healthy and safe!
My up to date view (sans any EW model). Note this channel is NOT Lara’s wider channel; this is around only the more recent steeper price action off the primary 2 high on Lara’s main daily chart. You can see how price slightly scribbled over this upper channel line today and turned back down. Futures are down about 50 points or so and going sideways now.
My expectation for tomorrow: price noodling around and finally closing very close to 2392 (SPY at 240). I think Big Money maximize on their sold options at/around that price level and they will make sure they get their max payout.
I could be dead wrong, because it’s a storm tossed market.
If price jacks up and through that channel, then up and through the upper channel and then up and through the cluster of Fibonacci levels just above it, and then yet again with a break of the market bullish symmetry level, the alternate wave count will be incrementally confirmed, and I will likely be legging into a shorter term tactical long anticipating a more sustained B wave thrust over several days at least, which helpshedge my longer term (mid-May puts) which no longer have any matching sold puts (I took those when price tagged and started to turn off that channel line today). And if the main plays out instead, I turned the baggage of the sold puts into a profit, and the remaining long puts will gain profit at a much higher rate as price falls as a result.
This is how I trade. STRUCTURALLY, within the bigger context set for me by the wave count. The wave counts for me are “backstop”, and I use it to try to structure trade tactics that will result in profits no matter what happens in the shorter term. And more specifically, I try to pay sharp attention to when a main and and alternate hang “in the balance”, which I believe is the case here, and then go with whatever gets confirmed through structural price action. Newer traders should probably focus just on this: PATIENCE until strong confirmation of a wave count, then pounce. That moment is coming soon enough, maybe tomorrow but probably early next week.
Hi Kevin, thanks for the detailed explanations you always give, very helpful.
Question on your options opening/closings. Do you take the ask or simply set it on bid and wait? Its seems that you have to cross considering how fast you offload contracts sometimes (like today when it touched the line and you made the decision to close out).
thank you
Serg
When I want in or out I start “in the middle” and then slowly (or quickly if the market is starting to move against me) keep moving my price until I get filled.
When I’m overly concerned about spreads and commissisons (which tends to be when I’m trading more intra-day and for smaller moves), I don’t use options. I’ve been using UPRO and UWM, but I am going to switch to SPY and IWM and just double my size. You get weird price effects with those leveraged instruments and you don’t get prices that reflect actual index moves sizes; in other words, you get tend to get “cheated”. SPY and IWM, not being based on futures, should be more crisp. Of course that’s for longs. I don’t often put on intra-day shorts but in this environment I may be and I’ll try the unleveraged short funds.
Got it. thank you. Agreed that leveraged ones bleed.
Here’s the fundamental reason why I am very bearish overall. Now up to 27000 new CV cases every day. The the rate of growth of that number is clearly accelerating fast, in an exponential fashion (in this phase; eventually, it slow and turns and drops).
Until the growth rate slows and then the absolute #’s start falling, in my sober view, the world plunges head long into total economic meltdown. Hard to understand how such a slow down is going to happen over the next several weeks or even months (warmer weather? Maybe. A sudden vaccine with high efficacy? Maybe. Social distancing? Maybe.)
Lastly, assuming it’s not going to happen for many months, I think the market is still vastly over valued relative to the earnings impacts (and outright corporate bankruptcies) coming. People talk about fear driving this market; I’m suspicious it’s being held up rather on hope, combined with a dearth so far of the hard economic #’s showing horrible results. I expect that to change over the coming weeks.
I will adjust my view with new different data. Objectivity and a flexible outlook is critical now.
Hi Kevin,
I have to agree with you on that market’s overly optimistic view. Most of the analysts’ estimates project only Q1 and Q2 to be down quarters for S&P 500 and then strong bounce in Q3 and Q4. That’s where the market stands. Now if you think about it, it takes at least 3-6 months to produce, test and approve some vaccine. It would take at least 9-12 months to make it commercially available. Q1, Q2 being only negative quarters is based on the fact that China recovered in 3-4 months (also questionable, just based on “reports” from the information controlled country). But even if it’s true, they used draconian measures, which worked. By the time US and Europe implement it, it will be too late, way more people get infected (the case with Italy so far) and it would be much longer process than 3-4 months there. What I’m trying to point out is that market didn’t really feel much pain (unemployment started to go up already), but market doesn’t feel like capitulated yet. It just happened so fast that assumption is that it will go away fast. But market will only start recovering when pain is felt throughout the system and I think we didn’t see it all yet. If there is no fundamental change within 1-2 months from now, we might start seeing real pain. Just my 2 cents. It’s a human nature to hope for the best outcome.
neighbors had a corona virus party this afternoon- *shake my head
Lara, since you have some time on your hands these days, after your family issues, you might give us a brief insight as to how you became an EW analyst. Just asking. Take care.
Hi Rodney, the issue is finally dealt with and all is good again.
It was totally random. Cesar gave me a copy of the Frost and Prechter book “Elliott Wave Principle”. I thought it was interesting. About the same time we were beginning to trade currencies and so I was familiar with candlestick charts.
I just… began trying to do Elliott wave analysis. We had a website forexinfo.us and I started publishing my EW analysis. After about 6 months of doing it daily, I became reasonably confident in what I was doing and the early days of this business were born.
That was back in 2008 during the GFC. Fun times, but not as fun as today.
Lara thanks as always for what you do. In the main hourly chart, any reason why the channel is not drawn from (2) to (4) with a parallel on (3)?
I’ve drawn it from 1 to 3 with a copy on 2 (Elliott’s first technique) because it works to contain almost all movement.
You only need to redraw the channel using Elliott’s second technique (2 to 4, copy on 3) if the fourth wave is not contained within the channel.
This one is.
Thanks Lara
I be first,, prize please
That was quick – what do you want?
Don’t offer doc an inch. He’ll end up taking a mile. He’s a sly one!
I thought you were my best friend
All I want is an inch
Say no more.
Mark, my style of trading is closer to gambling. I like a high payout trade….. don’t listen to me unless you need medical advice ….
RTOFLMAO!!!! That’s awesome Peter. Well, your true confession is awesome. Your style…hey, we all have our own tradings paths to follow! Whatever works for you.
LOL – thanks for that.
I tend to look at trends and the underlying mood of the world. The issue I have is exiting a losing trade (and mistaking building on it) and staying with a winning position. “Simple” options interest me in this market – as I think equities will fall in the medium term then when the world adjusts and investors need returns on their cash they will look for dividends and share growth.
I’ll try not to listen to you 🙂
2 things:
1. How impressive is the new chancellor ?
2. The key is now going to be the Long Gilt IMO. The amount of cash going into the system is mindboggling. Once you give everyone cash without them working, Im wondering the moral hazard of that , and their propensity to reign back from that when the crisis subsides.
Look at the chart of the long gilt, once mortgages are reinstated will banks keep mortgage rates low ? As ever in the UK its the consumer and his/her confidence that is the issue. After the “holiday” if Banks raise rates then this could aggravate the contraction.