A bounce or sideways consolidation was expected to continue for the short term, which is what is happening.
Summary: There is no evidence to suggest the larger bull market is over. The current pullback is very deep and not likely to be finished yet. At its conclusion, it may present a good buying opportunity.
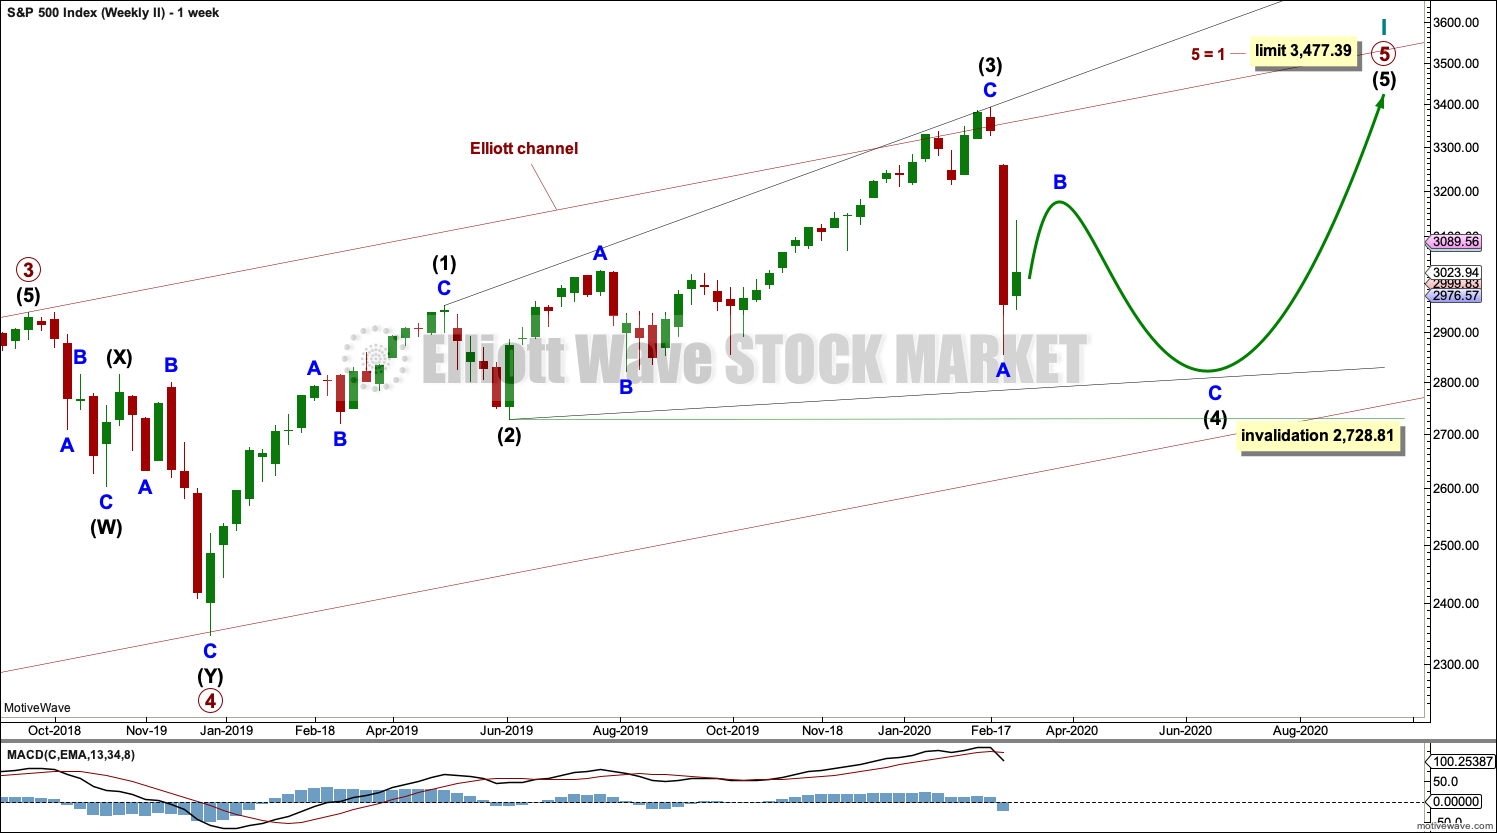
For the short term, a bounce or sideways consolidation may continue for wave B. Targets for it to end are either 3,188 or 3,257. Thereafter, wave C may end below 2,812.68.
For the very short term for tomorrow, a little more downwards movement may move at least slightly below 2,977.24 before an upwards swing begins.
A new low below 2,728.81 would indicate a deeper correction that may end at the lower edge of the teal multi-year trend channel.
The biggest picture, Grand Super Cycle analysis, is here.
Last monthly charts analysis is here with video here.
ELLIOTT WAVE COUNTS
FIRST WAVE COUNT
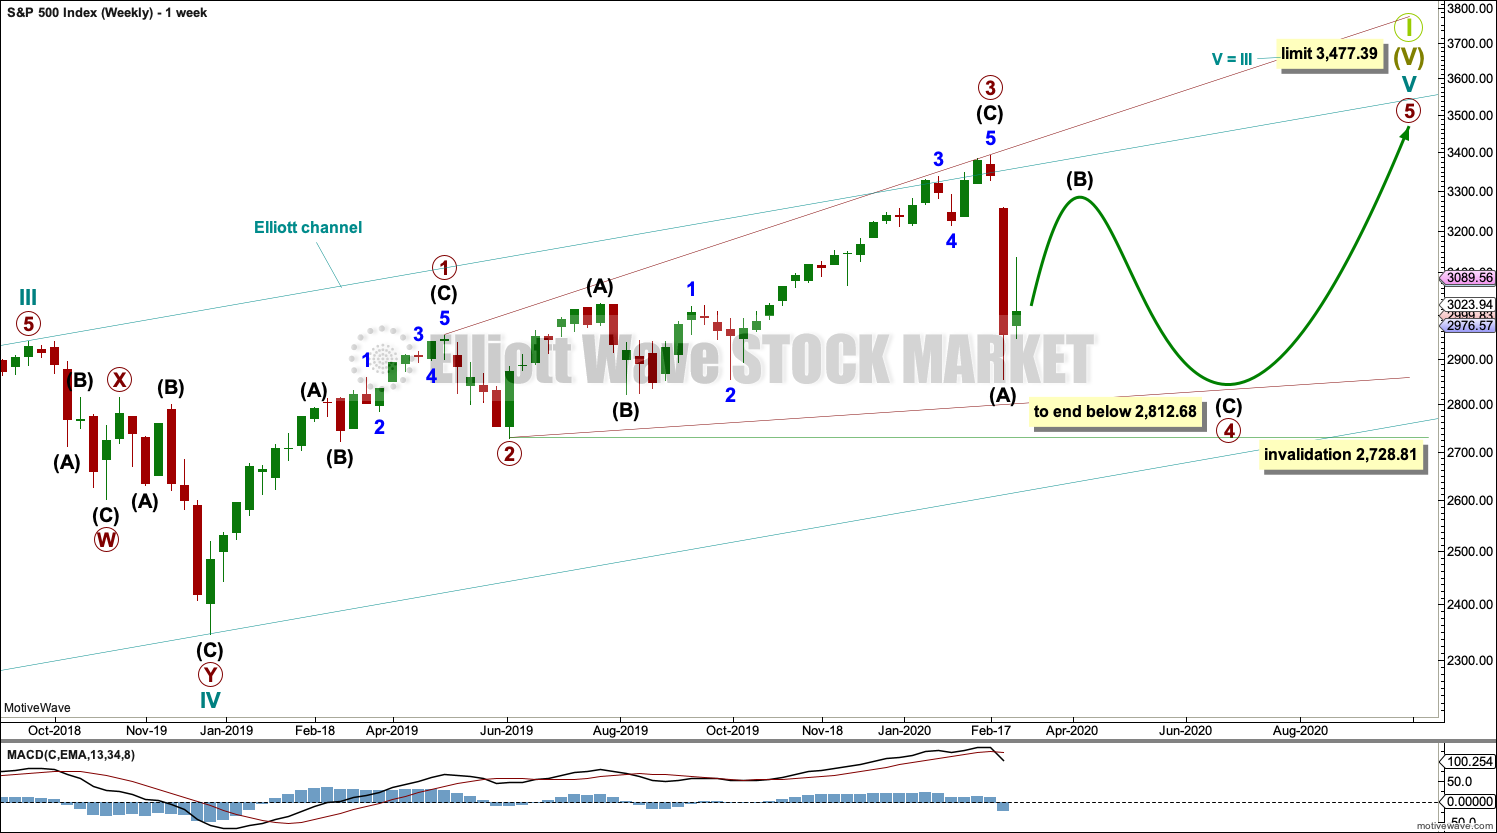
WEEKLY CHART
Cycle wave V may subdivide either as an impulse or an ending diagonal. This wave count considers a diagonal. The alternate considers an impulse.
A channel is drawn about the impulse of Super Cycle wave (V) using Elliott’s first technique. Draw this channel first from the high of 2,079.46 on the 5th of December 2014 to the high of 2,940.91 on the 21st of September 2018, then place a parallel copy on the low at 1,810.10 on the 11th of February 2016. Cycle wave IV found support about the lower edge.
The middle of the third wave overshoots the upper edge of the Elliott channel drawn about this impulse. All remaining movement is contained within the channel. This has a typical look.
Within Super Cycle wave (V), cycle wave III may not be the shortest actionary wave. Because cycle wave III is shorter than cycle wave I, this limits cycle wave V to no longer than equality in length with cycle wave III at 3,477.39. A new high by any amount at any time frame above this point would invalidate this main wave count in favour of one of the two alternate monthly charts which may be seen in last published monthly analysis.
At this stage, cycle wave V may end within this year or possibly into next year.
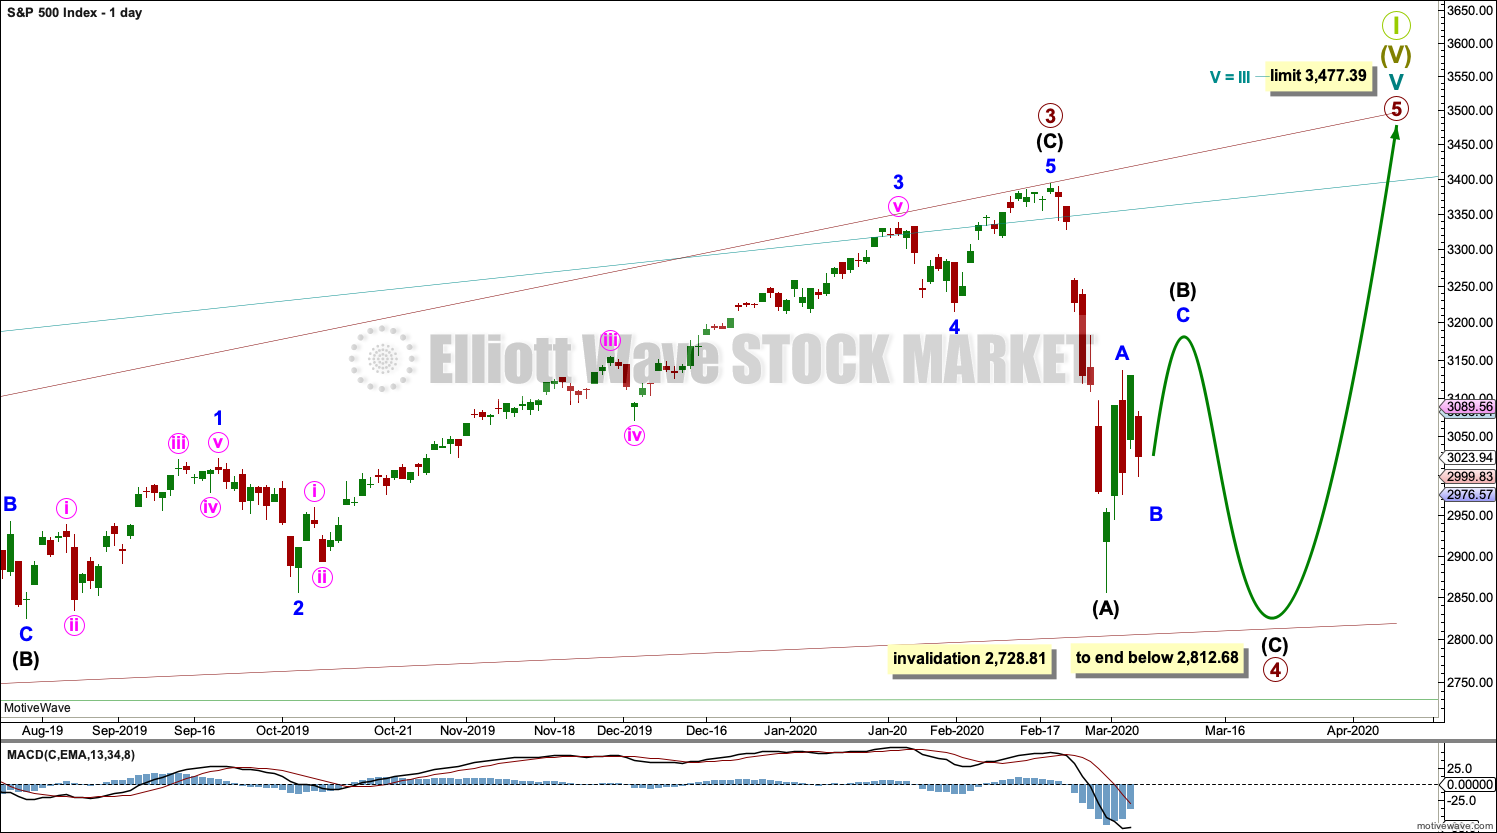
The daily chart below will focus on movement from the end of intermediate wave (B) within primary wave 3.
Ending diagonals require all sub-waves to subdivide as zigzags. Primary wave 4 of a diagonal must overlap primary wave 2. This rule is now met. Primary wave 4 may not move below the end of primary wave 2 below 2,728.81.
This ending diagonal would be expanding. Primary wave 3 is longer than primary wave 1, and primary wave 4 so far is longer than primary wave 2. Primary wave 5 would need to be longer than primary wave 3 for all rules regarding wave lengths of expanding diagonals to be met.
Fourth and second waves of diagonals most commonly end somewhere between 0.66 to 0.81 of the prior wave. This gives a target zone for primary wave 4 from 2,954.81 to 2,855.10. However, this diagonal is expanding and primary wave 5 needs to be longer in length than primary wave 3, which was 664.71 points for this rule to be met. This rule needs to be met prior to the upper limit for cycle wave V at 3,477.39, so primary wave 5 would need to begin below 2,812.68.
DAILY CHART
All sub-waves of an ending diagonal must subdivide as zigzags. This is the only Elliott wave structure where a third wave sub-divides as anything other than an impulse.
Primary wave 4 must subdivide as a zigzag. Within the zigzag, a sharp bounce or a time consuming sideways consolidation for intermediate wave (B) may be underway.
Diagonals normally adhere very well to their trend lines, which may be tested within the sub-waves. The upper 1-3 trend line is tested at the end of minor wave 3 within intermediate wave (C) within primary wave 3.
Primary wave 4 may not move beyond the end of primary wave 2 below 2,728.81.
HOURLY CHART
Primary wave 4 within a diagonal must subdivide as a zigzag. Within the zigzag, intermediate wave (B) would very likely show on the daily and weekly chart for primary wave 4 to have the right look. Intermediate wave (B) now shows up on the daily chart.
Intermediate wave (B) may not move beyond the start of intermediate wave (A) above 3,393.52.
This first hourly chart looks at the possibility that intermediate wave (B) may be unfolding as a zigzag. This is the most common Elliott wave corrective structure, so this wave count has a higher probability than the alternate hourly chart below.
Within the zigzag, minor wave B may be an incomplete regular flat correction. Within the regular flat, both minute waves a and b subdivide well as three wave structures. Minute wave b is a 0.96 length of minute wave a. Minute wave c would be very likely to make at least a slight new low below the end of minute wave a at 2,977.24 to avoid a truncation.
Regular flat corrections usually fit well within channels. Draw a small channel about minor wave B as shown. Minute wave c may find support about the lower edge.
When minor wave B may be complete, then a five wave structure upward for minor wave C may complete a zigzag for intermediate wave (B).
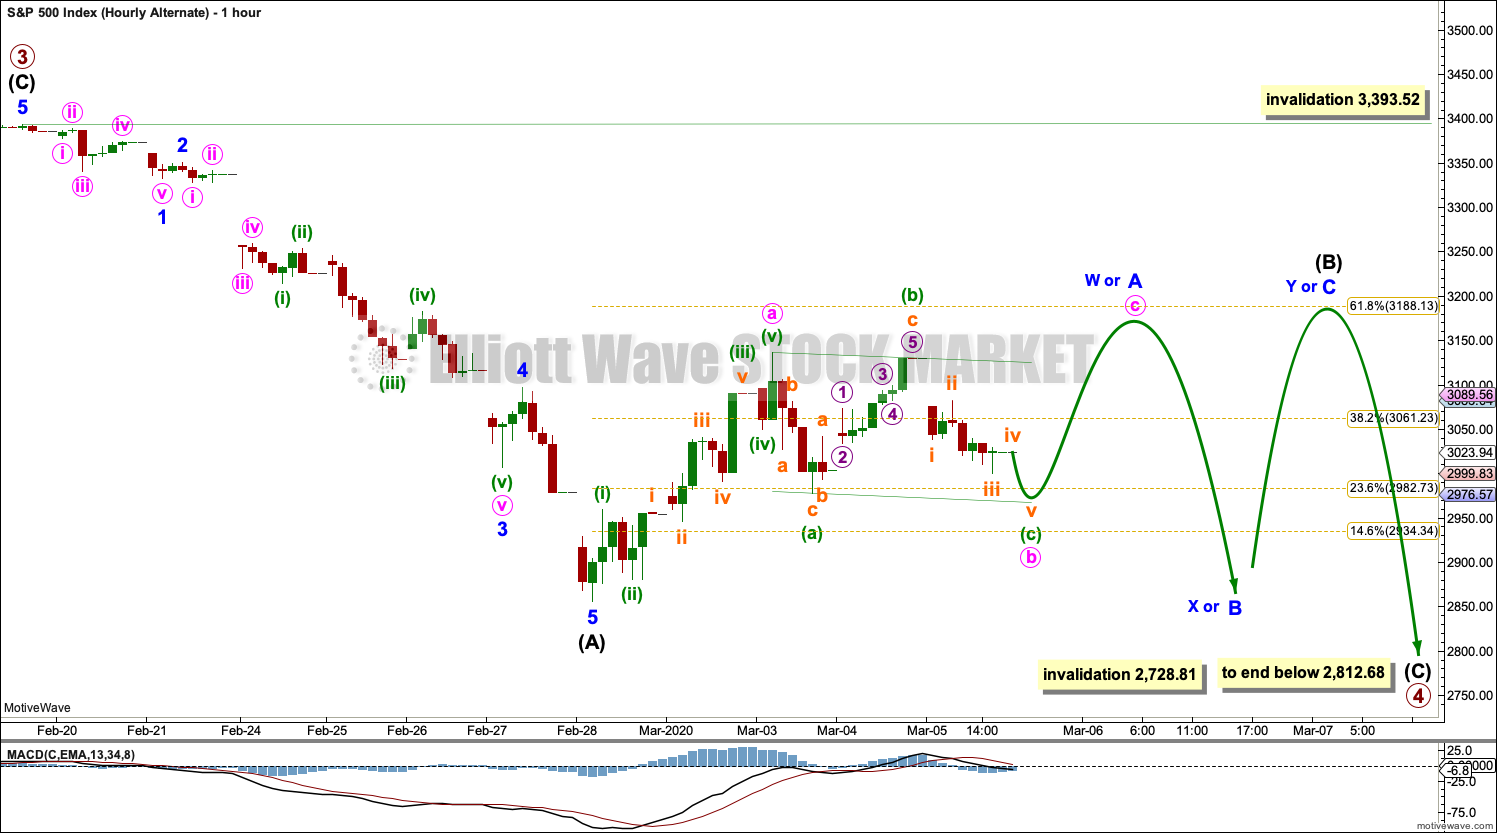
ALTERNATE HOURLY CHART
It is also possible to move the degree of labelling within intermediate wave (B) down one degree. Intermediate wave (B) may be unfolding sideways as a flat, combination or triangle. All of these structures begin with a three wave structure, or minor wave A or W, that may be an incomplete zigzag.
When minor wave A or W may be complete, then minor wave B or X may be a deep pullback.
SECOND WAVE COUNT
WEEKLY CHART
This second wave count sees all subdivisions from the end of the March 2009 low in almost the same way, with the sole difference being the degree of labelling.
If the degree of labelling for the entirety of this bull market is all moved down one degree, then only a first wave at cycle degree may be nearing an end.
When cycle wave I is complete, then cycle wave II should meet the technical definition of a bear market as it should retrace more than 20% of cycle wave I, but it may end about either the 0.382 or 0.618 Fibonacci Ratios of cycle wave I. Cycle wave II may end close to the low of primary wave II within cycle wave I, which is at 1,810.10. It is also possible that cycle wave II could be fairly shallow and only barely meet the definition of a bear market.
An ending expanding diagonal is still viewed as nearing an end. This wave count labels it primary wave 5. Primary wave 5 may still need another year to two or so to complete, depending upon how time consuming the corrections within it may be.
Primary wave 5 may be subdividing as a diagonal, in the same way that cycle wave V is seen for the first weekly chart.
ALTERNATE WAVE COUNT
WEEKLY CHART
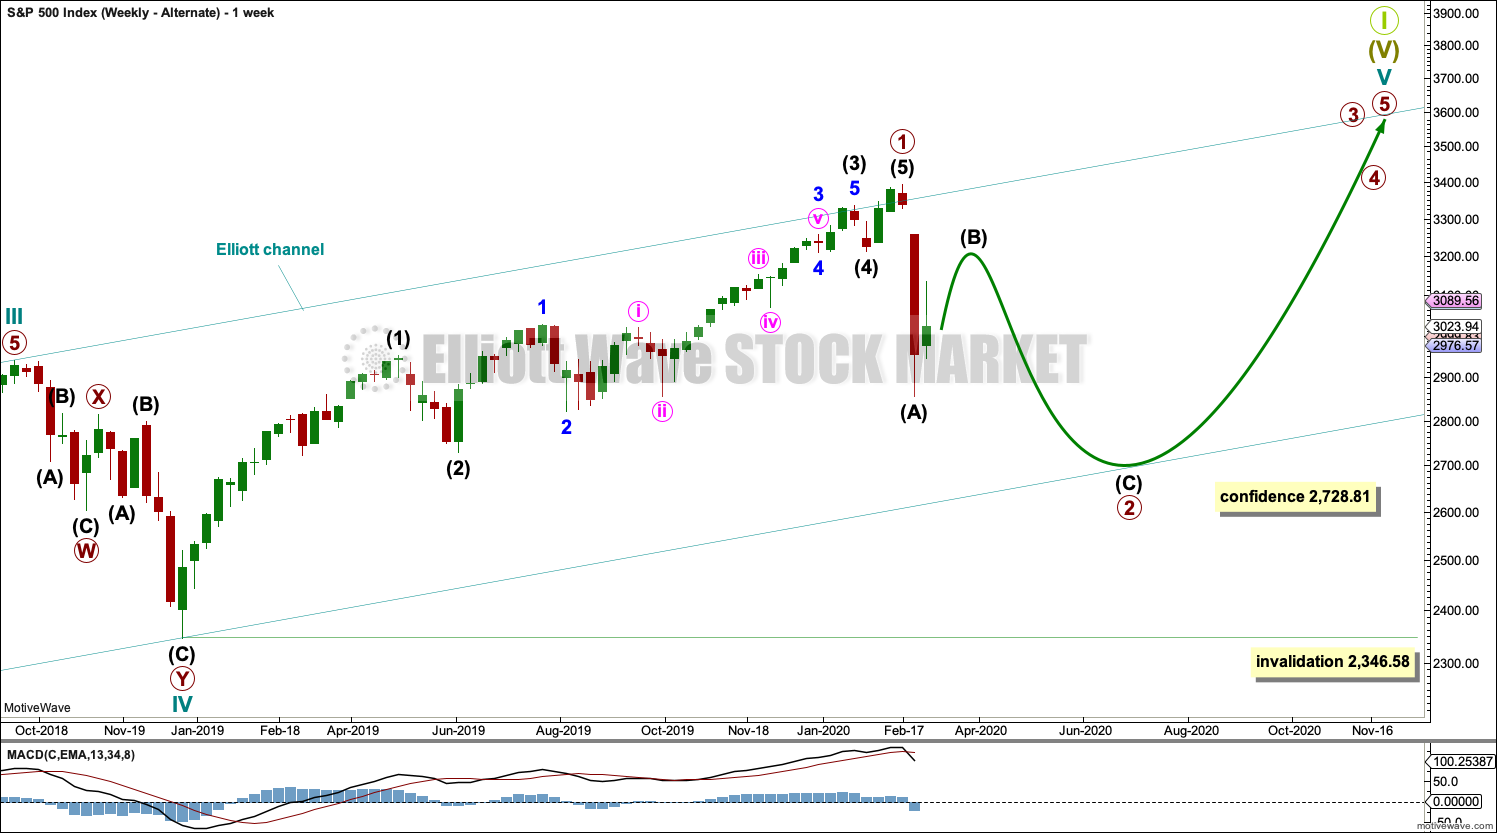
It is also possible that cycle wave V may still be unfolding as an impulse. Within the impulse, only primary wave 1 may be over at the last high.
Primary wave 1 is seen as an impulse. Within primary wave 1, there is poor proportion between the corrections of intermediate waves (2) and (4) and minor waves 2 and 4. This gives the wave count a forced look, but it is valid.
Primary wave 2 may be unfolding as a zigzag. It may find strong support about the lower edge of the multi-year teal trend channel.
Primary wave 2 may not move beyond the start of primary wave 1 below 2,346.58.
If the main wave count is invalidated with a new low below 2,728.81, then this alternate would then be used.
The limit is removed from this alternate. If only primary wave 1 is over at the last all time high, then more room would be required for the structure of cycle wave V to complete than the limit would allow. This alternate may fit with one of the alternate monthly charts.
TECHNICAL ANALYSIS
WEEKLY CHART
Click chart to enlarge. Chart courtesy of StockCharts.com.
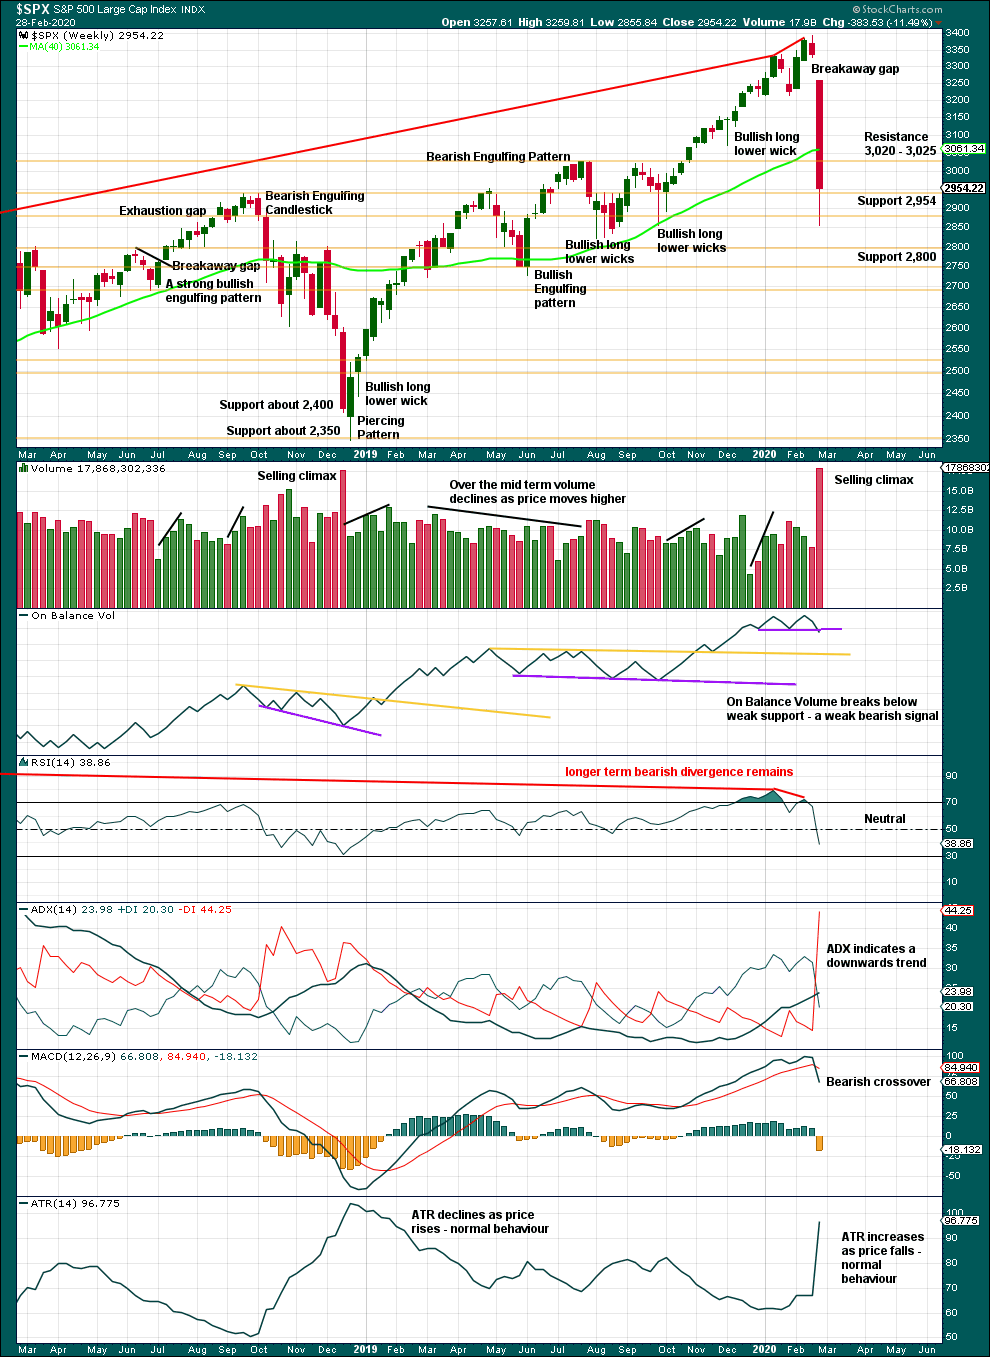
Risk of a pullback identified has been followed by a 15.8% drop in price (high to low) so far. This dramatic drop in price has precedent within the larger bull market. It does not necessarily mean the secular bull market must be over.
At the weekly chart level, conditions are not yet oversold; this pullback may be expected to continue further.
For the short term, the volume spike last week may be a selling climax. In conjunction with a bullish long lower wick on this weekly candlestick, a bounce may be expected about here.
DAILY CHART
Click chart to enlarge. Chart courtesy of StockCharts.com.
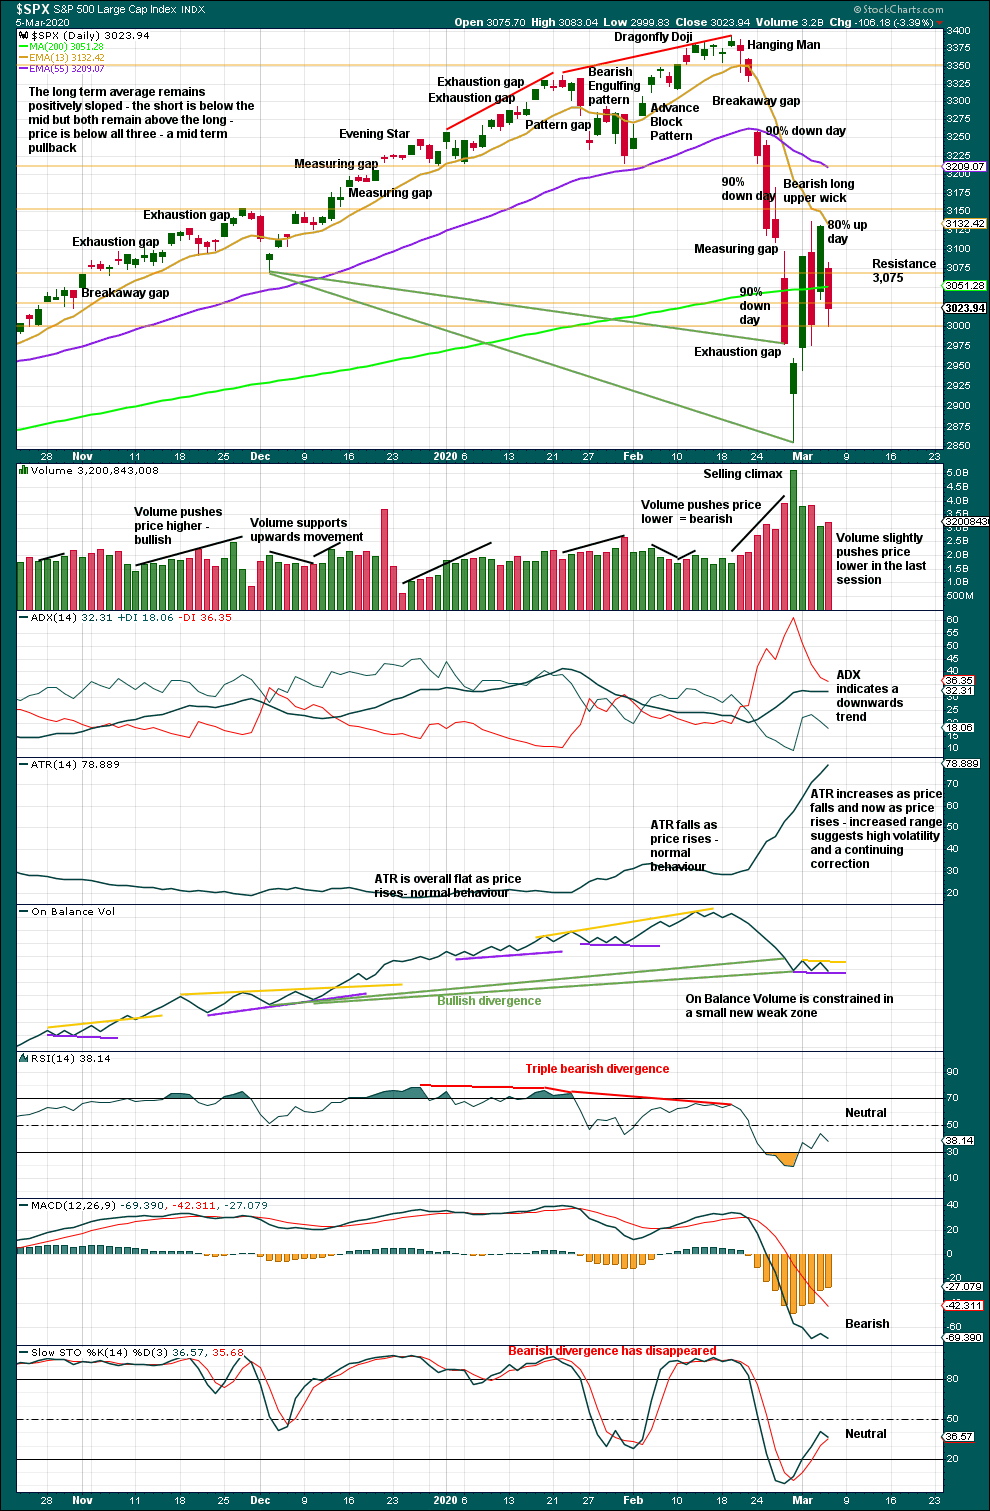
There are now three 90% downwards days in this strong downwards movement.
Following a 90% downwards day, either a 90% upwards day or two back to back 80% upwards days within 3 sessions would be required to indicate a 180°reversal in sentiment and indicate a sustainable low may be in place.
Although Wednesday met the requirement of an 80% upwards day, Thursday did not. In the absence of a 90% upwards day or two back to back 80% upwards days, there is no evidence here of strong buying needed to signal a sustainable low in place. The correction may be reasonably expected to continue sideways and / or lower.
BREADTH – AD LINE
WEEKLY CHART

Click chart to enlarge. Chart courtesy of StockCharts.com. So that colour blind members are included, bearish signals
will be noted with blue and bullish signals with yellow.
Bear markets from the Great Depression and onwards have been preceded by an average minimum of 4 months divergence between price and the AD line with only two exceptions in 1946 and 1976. With the AD line making new all time highs with last all time highs from price, the end of this bull market and the start of a new bear market is very likely a minimum of 4 months away, which is mid June 2020.
In all bear markets in the last 90 years there is some positive correlation (0.6022) between the length of bearish divergence and the depth of the following bear market. No to little divergence is correlated with more shallow bear markets. Longer divergence is correlated with deeper bear markets.
If a bear market does develop here, it comes after no bearish divergence. It would therefore more likely be shallow.
Last week price and the AD line have both moved lower. Price has made new lows below the prior swing low of the week beginning 2nd December 2019, but the AD line has not. Price is falling faster than market breadth; breadth does not support this fall in price. This divergence is bullish and fairly strong, and it supports the new Elliott wave count.
Large caps all time high: 3,393.52 on 19th February 2020.
Mid caps all time high: 2,109.43 on 20th February 2020.
Small caps all time high: 1,100.58 on 27th August 2018.
DAILY CHART
Click chart to enlarge. Chart courtesy of StockCharts.com. So that colour blind members are included, bearish signals
will be noted with blue and bullish signals with yellow.
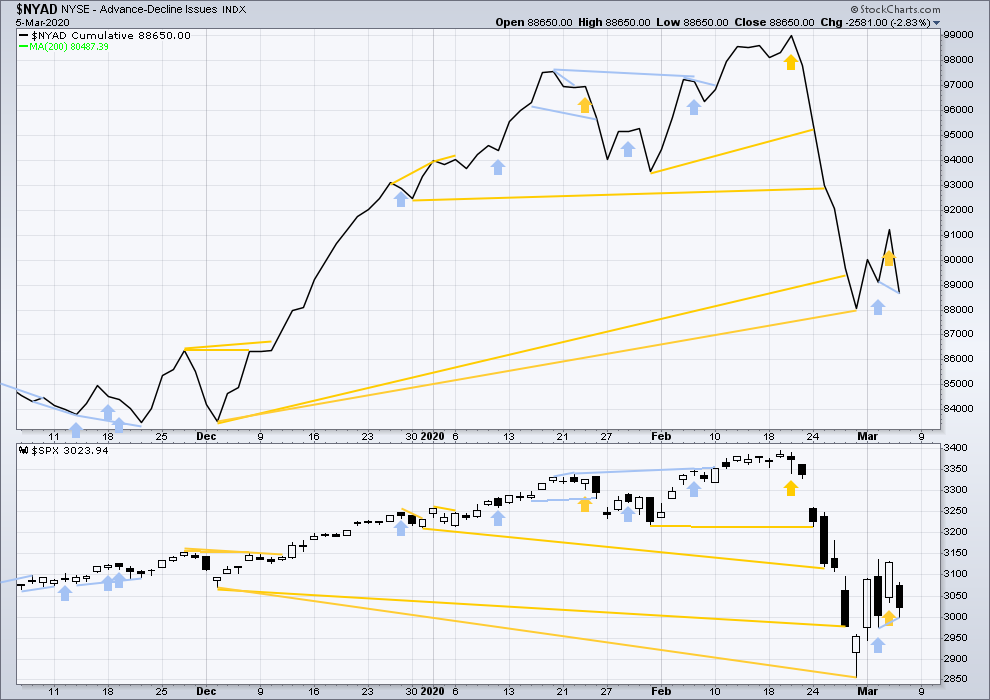
Breadth should be read as a leading indicator.
Both price and the AD line have moved lower today. The AD line has made a new low below the prior low two sessions ago, but price has not. This divergence is bearish for the short term.
VOLATILITY – INVERTED VIX CHART
WEEKLY CHART
Click chart to enlarge. Chart courtesy of StockCharts.com. So that colour blind members are included, bearish signals
will be noted with blue and bullish signals with yellow.
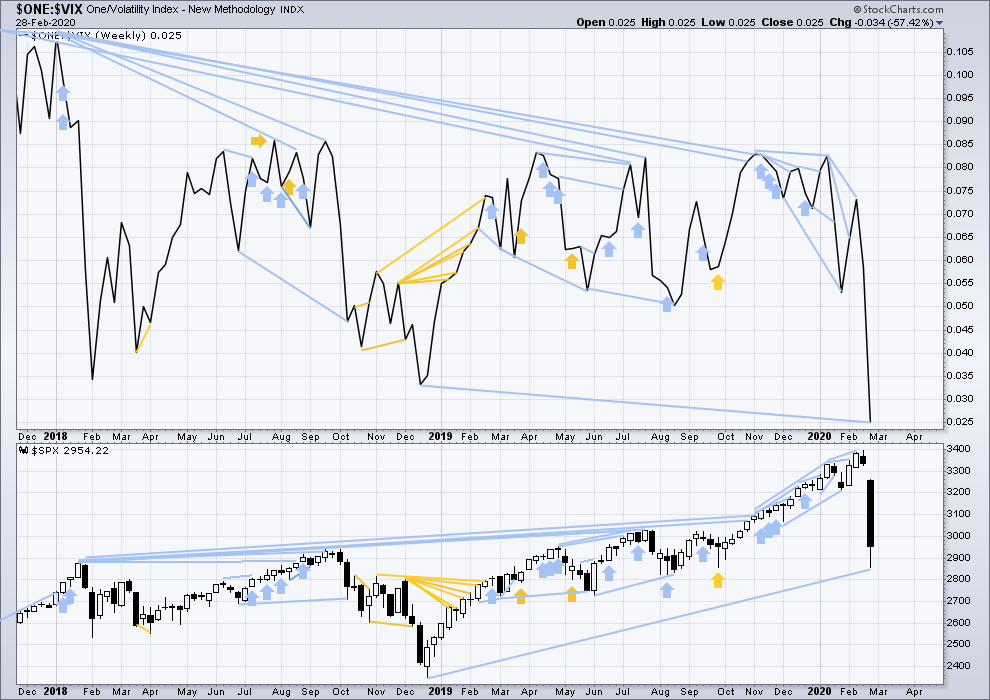
The all time high for inverted VIX was on 30th October 2017. There is now over two years of bearish divergence between price and inverted VIX.
The rise in price is not coming with a normal corresponding decline in VIX; VIX remains elevated. This long-term divergence is bearish and may yet develop further as the bull market matures.
This divergence may be an early warning, a part of the process of a top developing that may take years. It is clearly not useful in timing a trend change from bull to a fully fledged bear market.
Last week both price and inverted VIX have moved lower. Inverted VIX has made new lows below prior lows of weeks beginning 17th / 24th December, but price has not. Inverted VIX is falling faster than price. This divergence is bearish. Because this disagrees with the AD line, it shall not be given weight in this analysis.
DAILY CHART
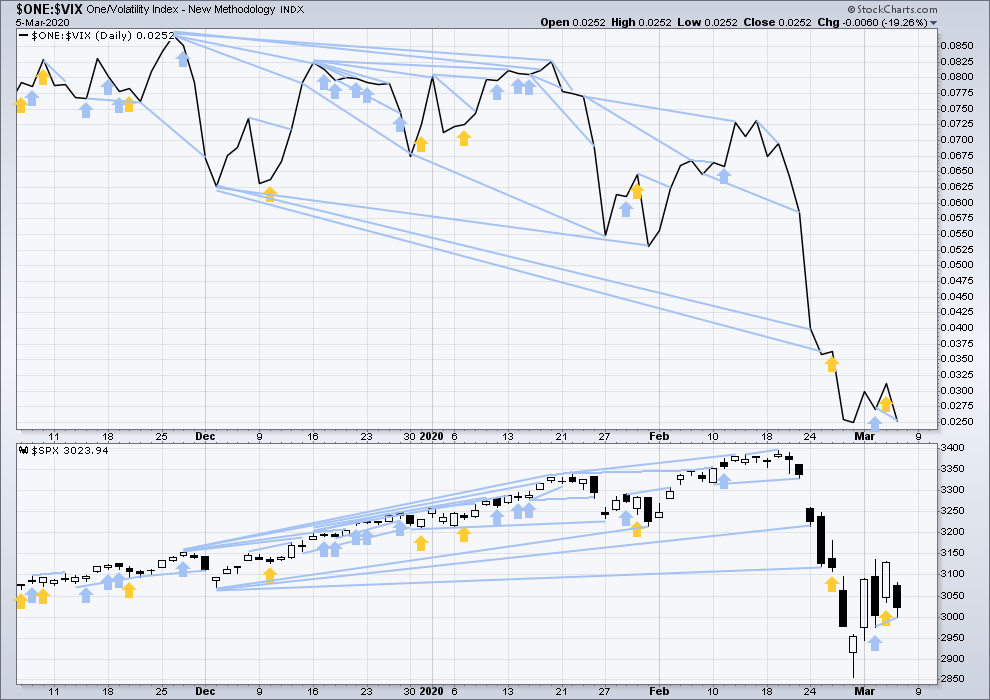
Click chart to enlarge. Chart courtesy of StockCharts.com. So that colour blind members are included, bearish signals
will be noted with blue and bullish signals with yellow.
Today both price and inverted VIX have moved lower. Inverted VIX has made a new low below the low of two sessions prior, but price has not. This divergence is bearish for the short term and agrees with the AD line.
DOW THEORY
Dow Theory would confirm a bull market if the following highs are made:
DJIA: 26,951.81 – a close above this point has been made on the 3rd of July 2019.
DJT: 11,623.58 – to date DJT has failed to confirm an ongoing bull market.
S&P500: 2,940.91 – a close above this point was made on the 29th of April 2019.
Nasdaq: 8,133.30 – a close above this point was made on the 26th of April 2019.
Dow Theory would confirm a bear market if the following lows are made on a closing basis:
DJIA: 21,712.53
DJT: 8,636.79
S&P500: 2,346.58
Nasdaq: 7,292.22
Published @ 07:06 p.m. EST.
—
Careful risk management protects your trading account(s).
Follow my two Golden Rules:
1. Always trade with stops.
2. Risk only 1-5% of equity on any one trade.
—
New updates to this analysis are in bold.


It is very typical for price to head back an re-test a broken S/R pivot.
3000 was YUGE! Very fiercely contested.
Enjoy your week-end with friends and family. NOTHING is more important…
Cheerio!
Hi Somlogan:
Just saw your note on earlier thread.
Congrats on 5X trade! 🙂
EPIC DAY!!!!!
I went into the weekend flat. Let it rip up now!!!! Yee-haw.
Buying March 13 DIA 275 strike calls for 0.69. Gid-yap! 🙂
(Break from bullish falling wedge)
Hi Verne,
you mean on the hourly? Closing above 258 previous resistance?
Was watching on 15 min. Price broke above upper wedge boundary…
Hourly chart updated:
The flat correction of minor B may now be over. There is a Bullish Engulfing candlestick pattern on the low at the hourly chart level.
Nice bounce in the channel. They bounce it back and forth like a ball, but still the ball that rolls down nonetheless:)
We might be coming to 2885 level with that rate (123.6% fib)
50% short, omg
target?
closed
A take on RUT.
Yeah, that last what I see
Also, the minute v is now equal to the minute i in length. So the minor A impulse could be just about complete. On the other hand, that leaves the pivot in hyperspace between the 61.8% and 76-78% levels. So dropping to the 1380 area then completing could very well be in the cards.
Very reasonable. Seeing the recent rally as an Intermediate X is a good idea because it doen’t have or require the B wave parameters or requirements.
BTW, I like and need old people. I am one of those old Boomers. Fortunately I am the youngest of the Boomer generation which is perhaps the second best generation falling behind the WW II generation.
nice charts on Bitcoin and ethereum. been scooping those up.
Main hourly playing out nicely!
How do you figure? We look too be in a coil that was entered from above…. or am I missing something ?
Larger coil unfolding…think “degree”…
oh yeah….
I’ll be mildly surprised to see SPX above 3137 any time soon, honestly. RUT’s action suggests pretty strongly to me that the B wave up in SPX is complete. Could be wrong for sure. It’s a wild market. “Just another +3% day, yawn!!!”.
A bigger day for me today than yesterday. But the REAL opportunity is just ahead, in my opinion. That said, the market is not going to make it easy to find the high probability, super low risk short set up, which is why I’m trading it pretty hard on the swings (and because they are MASSIVE and high momentum). Because EVERYBODY is waiting to jump on the B wave high…again supporting the thesis that it’s already in with that little double top.
Opinions on shorting TLT today? Has the look and feel of parabolic capitulation to me…
of course. a lot of capitulation here. I like the counts- either main or alternate because we’ve just destroyed any longs this morning and at 3140 all the shorts will be destroyed… it’s a perfect march to the woodshed for everyone! after everyone is washed out we go lower to complete the pattern and wipe out the longs buying the break over 3130…then we swing higher off new lows to tap those new highs in the 3400 level- completelydestroying anyone who thinks it’s the end of the civilised world! its these wild markets that create massive opportunity and drive weak hands back to 9-5 punch in punch out jobs.
(hey how about sanateli on CNBC floating the idea we just give Covid19 to everyone in the US in an attempt to save the economy haha only lose 11million americans a lot of calls for his head on voicing that one out loud)
Or, as a trading friend of mine commented…US social security will be in much better shape with far less baby boomers around. Sick joke, I know.
Maybe that’s why they created this coronavirus after all – who needs old people – extra money to support. Very cruel joke, but every joke is only partially a joke.
I like this scenario – that’s Lara’s main count:)
Take a look a WTI. We have taken out Dec 18 lows…!
Tread carefully…!
I certainly have been watching TLT for a top, and yes, now it’s in blow off territory.
But if TSLA taught us anything, it’s to wait for some kind of indication of a break. TLT could gap up again several times next week.
I’m not an economist, but seems to me there’s real trouble brewing if the world goes into recession and interest rates are already on the floor.
That’s the thing tho: there hasn’t been a recession in memory with interest rates and energy prices at the bottom. If anything, bonds and oil are telling us that we “have been” in a recession up to now, and we’re hitting the bottom of the recession.
Look at oil/bonds at market tops and bottoms. This is why I just cannot see a recession at these stimulatory bond/oil prices.
There is never been times when alternative sources of energy are used as much. After all, oil issues are not coming only from less demand from China manufacturing. They started cutting production with more competition from the US and more alternative sources. Secular trends – take long to develop but they are happening. Similar to what happened to coal as a source of energy.
A chart reflecting Lara’s update yesterday (March 04 Intraday update).
Currently in minute b up. May not be finished. Then 50%, .618% down to 2883, poss. 2875 region Lara mentioned yesterday, then a bounce? Poss. flat. We don’t break 2855 yet.
Look for move back up to contested 3K naginot line.
A close above good for a short term bullish spin…
Great trading day today!
Have a great week-end everyone…
Go spend some of this week’s juicy profits to keep your local economy humming! 🙂
Thanks for your recommendations this week Verne.
And keep those hands clean….
Will do my friend. Good to be back for a visit with the old posse…! 🙂
BTW, take a look at Innovio Pharmaceutical (INO)
One of their PIs put out a good paper (being peer reviewed) on Covid 19 and they are readying a vaccine. I am holding 8 strike calls picked up for a song and plan on taking delivery. Potential for a buy-out (hostile or otherwise) is good and could be a big pay-day. 🙂
I like this
Can the first leg down be the B? In which case, price is pushing up in E?
In the bigger context, while violent churn was expected here and exactly what we are getting (my analogy: the A wave was the smack of the giant bell, and bell’s ring for a long time!), structurally a big triangle doesn’t match up with any higher 2 wave.
Again, I’m not overly focused on precise upward correction structure here. Trading the swings, with a total downward bias (short only!). I want it to go up and clearly complete the B wave; that sets up VERY high confidence shorts for the C down!
I was looking at it like this … sorry on mobile today
I believe this is a good count. The trouble with B waves is thay can continually morph into all sort of possibilities. I’ve said it before, “I hate B waves.”
I hate them too.
We also need to fill the gap up to 2999 at least. Not necessarily today.
Price rebounding off 76-78% retrace levels of the initial A up of the B up. But did it go too deep to still fit in Lara’s main model of a B of B flat?
I’m only 10% short, we break the AM low and I’ll have to got to 50%. I posted a triangle but it disappeared ….
Triangle thesis ?
So far the price went way below 2977 mentioned by Lara – does it mean we are definitely done with wave B or does the count still hold true unless it goes below 2900?
All I can say in the face of these historic times is that I am glad I am out sitting on cash as we await signs of a bottom which may be much, much lower.
Very well said.
That’s a very reasonable plan.
I on the other hand am striving to use this to dramatically improve my financial fortunes. It’s a once every 10 years or so opportunity.
Epic day for me so far, and it’s only 30 minutes in…currently flat.
And the BIG opportunity lies ahead: the potential a very, very large price collapse in coming weeks.
Rodney,
sitting on cash is like shorting market (all relative performance), so you’re definitely in a positive territory 🙂 Good job!
Are we going to see 2900 tonight
Futures already down over 2.77% across the board….if we are entering a bear market (as on paper a correction is up to 20% decline)…looks like a lot of investors will be seeing it for the first time…imagine if it takes indexes all the way to 2016 levels
Hi Lara,
I could not see the channel around Minor B on your main hourly?
Draw a line from the top of minor A to the top of minute [b].
Then draw a parallel line from the bottom of minute [a].
It helps to enlarge the chart.
It’s the small downwards sloping pink channel… the pink lines make it a bit hard to see
Well futures are practically now at 2977. I’m not sure this will turn
ES just turned up just short of the bottom line of the channel at 2962.25.
Whether it’s permanent only time will tell.
Now below the bottom line of the channel.
Boo-Yah!
A chance that wave (B) was completed and we r heading for (C) ?
IMO, yes. But Lara’s model is far more often accurate than my opinions.
Why do I say yes, quite possible? Because we just saw one of the fast large corrections in stock market history. So getting surprise sharp and “early” downward movement seems like a real possibility to me.
James Flannagan makes a data based argument that this is most likely the start of a bear market. He has extensive data showing there has NEVER been a market move of this size and momentum of this A wave, at this stage of a bull market (well into it, vs. early) that DID NOT lead to a bear market. He argues that if this is “just a correction”, it would be historic, a first ever. I’ll try putting the URL to his free webinar video in a reply (always seems to go into moderation though). If it doesn’t show, you might search for “Gann Global Financial” and “The Stunning Implications of our 9-day, 16% decline in the stock market”.
That said, price has NOT hit his projected range for completion of the B wave; he’s got that around 60-70% retrace, and we only hit about 52% so far.
WILD TIMES!!! I’ve said it and I’ll say it again: I think the odds of a major bear market here are quite significant.
Here’s the URL I have to the Flannagan webinar video:
http://www.gannglobal.com/webinar/2020/03/01-20-03-03-Webinar-Invitation-MF.php?inf_contact_key=915c33d77ce53cd8ebdf89432efadb2716358d5485884e2f31e6019a0d26c8b0
Thanks a lot Kevin
Kevin,
so now within a single week you switched your thesis from Ciovacco crazy bull expansion to doom and gloom bear market from Flannagan. Do you have a firm footing on any? It looks like market easily shook you off your thesis. I have much much less experience than you but I noticed that market usually punishes anyone who doesn’t have firm position unless proven wrong. At this stage I don’t think market showed that we are no longer in the bull market.
What if the truth is somewhere between those 2 extremes?:)
I know you are simply trying to present alternatives, but there are always opposite opinions. The most important thing is to pick one and stick to it unless it’s confirmed to be wrong.
Politely…I could not disagree with you more.
Holding on to our thesis in the face of contrary evidence is what punishes us traders.
The market was booming and all the evidence indicated more to come. Then along came a vicious virus and the market behavior did NOT hold to the bullish thesis. Time to reassess. Sadly, I reassessed a little late and took medicine for it. The giant gap down alone was enough to flow a hole in the bullish thesis (easier in hindsight though).
If you find me too changeable, so be it. We all have our own paths to follow.
Very nice profits at open today, took ’em when I saw futures pushing up at the bell. I’ll reload…this market is likely (probabilistically) going far, far lower, and relatively soon at that. My thesis. I will change it any time I get what I view as contrary data.
Kevin, sorry, if I sounded negative. I just wanted to point out that be greedy when everyone is fearful and vice versa still holds true for any environment. You just have to be careful of picking the bottom but same might hold true for this bearish thesis – all of a sudden the virus stops spreading for any reason or they find a cure, of whatever it could be – my point is that I’m still with Lara’s count and the count shows we are still in the bull market, as she pointed out multiple times, and this is just a correction. We also knew that primary corrections are huge – look at what Feds did to the market ballooning as it was – it was unprecedented. The further it goes away from average, the faster it had to fall back to it. That’s exactly what it is doing now, but average is still pointing up in long term unless proven otherwise.
To sum it up, I think one needs to stay bullish longer term, same as one had to stay bearish at the times of ATH numbers. Timing is everything and it’s next to impossible to pick tops or bottoms but market gives clues on long term direction.
Again, I politely (and rather strongly) disagree with your statement that “one needs to stay bullish longer term”. If by that you mean it’s fine to hold equities here, no, not in my opinion. I’m advising all friends/family that will listen to exit equities NOW. Way, way, way too much downside risk at the moment. Worst case, they miss a little upward movement. But is there any serious chance this market goes to new ATH’s anytime soon? Very doubtful. Is there a non-trivial chance this market goes into bear mode? Absolutely. My $0.02, for those who will listen and are willing to exit (they are programmed by Wall Street to “hold, hold, hold!”).
Ok, this is your opinion. But I hope you didn’t tell your friends back 2 weeks ago to keep holding and buying more of equity when we were making ATHs as Ciovacco was your guide.
And I’m not saying to buy equities now, but I’m saying to get ready for the buying opportunity. And what do you call bearish market? 20% drop from the top? Ok, we might just touch it on the bottom, but it can reverse immediately from there (2700s level).
The market didn’t confirm that we broke the bullish multi-year trend line and so far Lara’s premise works.
ABC
Hmmm…looks like bottom is going to fall out tomorrow. FED unable to calm the markets.
that’s a little greedy dontcha think ;?)
greedy was buying a bunch of cheap calls for tomorrow, i don’t know how we are gonna rally….
Oops!!!
Don’t fight the tape!